In the dynamic energy sector, EOG Resources, Inc. and Occidental Petroleum Corporation stand out as prominent players in oil and gas exploration and production. Both headquartered in Houston and listed on the NYSE, they share overlapping markets and pursue innovation to enhance resource development. This comparison will explore their strategies, financial health, and growth potential to help you identify the most compelling investment opportunity in 2026.
Table of contents
Companies Overview
I will begin the comparison between EOG Resources, Inc. and Occidental Petroleum Corporation by providing an overview of these two companies and their main differences.
EOG Overview
EOG Resources, Inc. focuses on exploring, developing, producing, and marketing crude oil, natural gas, and natural gas liquids. With principal operations in New Mexico, Texas, and Trinidad and Tobago, EOG holds estimated net proved reserves of 3.7B barrels of oil equivalent. Founded in 1985 and based in Houston, Texas, EOG positions itself as a key player in the Oil & Gas Exploration & Production industry.
OXY Overview
Occidental Petroleum Corporation engages in acquiring, exploring, and developing oil and gas properties across the US, Middle East, Africa, and Latin America. It operates through Oil & Gas, Chemical, and Midstream and Marketing segments. Founded in 1920 and headquartered in Houston, Texas, Occidental is a diversified energy company with a broader operational scope including chemicals and midstream services.
Key similarities and differences
Both EOG and Occidental operate in Oil & Gas Exploration & Production and are headquartered in Houston, Texas. However, EOG concentrates primarily on upstream activities, while Occidental has a more diversified business model including chemicals and midstream operations. Occidental employs over 13K staff compared to EOG’s 3.1K, reflecting its broader operational footprint and segment diversity.
Income Statement Comparison
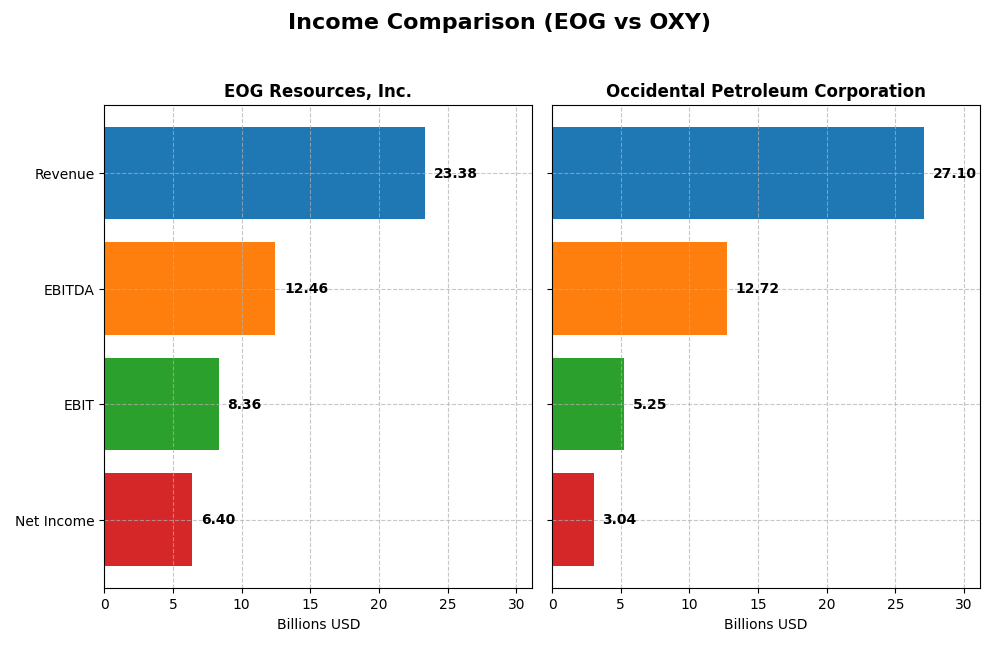
This table presents a side-by-side comparison of key income statement metrics for EOG Resources, Inc. and Occidental Petroleum Corporation for the fiscal year 2024.
| Metric | EOG Resources, Inc. | Occidental Petroleum Corporation |
|---|---|---|
| Market Cap | 57.5B | 42.2B |
| Revenue | 23.4B | 27.1B |
| EBITDA | 12.5B | 12.7B |
| EBIT | 8.4B | 5.2B |
| Net Income | 6.4B | 3.0B |
| EPS | 11.31 | 2.59 |
| Fiscal Year | 2024 | 2024 |
Income Statement Interpretations
EOG Resources, Inc.
EOG Resources showed strong revenue growth overall, rising 137% from 2020 to 2024, with net income increasing by over 1158%. Margins remained robust, with a gross margin of 75.7% and net margin of 27.4% in 2024. However, the most recent year experienced a slight revenue increase of 0.85% but declines in gross profit and net income margins, indicating some pressure on profitability.
Occidental Petroleum Corporation
Occidental Petroleum’s revenue grew 58% over five years, accompanied by a net income increase of 121%. Margins are lower than EOG’s but remain favorable, with a 35.6% gross margin and 11.2% net margin in 2024. The latest fiscal year saw a 4.35% revenue decline and a sharp 31.9% drop in net margin, signaling recent operational challenges despite solid long-term gains.
Which one has the stronger fundamentals?
Both companies present favorable income statement fundamentals with solid margin profiles and positive long-term growth. EOG boasts substantially higher margins and stronger net income expansion, though recent growth has slowed. Occidental shows steadier revenue but lower margins and a sharper recent profitability decline. These mixed factors make direct comparison nuanced, with each firm exhibiting distinct strengths and weaknesses.
Financial Ratios Comparison
The table below presents the most recent financial ratios for EOG Resources, Inc. and Occidental Petroleum Corporation as of fiscal year 2024, offering a side-by-side view of their key performance and financial health metrics.
| Ratios | EOG Resources, Inc. | Occidental Petroleum Corporation |
|---|---|---|
| ROE | 21.8% | 8.9% |
| ROIC | 14.8% | 5.5% |
| P/E | 10.8 | 14.8 |
| P/B | 2.36 | 1.32 |
| Current Ratio | 2.10 | 0.95 |
| Quick Ratio | 1.91 | 0.73 |
| D/E | 0.17 | 0.79 |
| Debt-to-Assets | 10.7% | 31.7% |
| Interest Coverage | 58.6 | 5.1 |
| Asset Turnover | 0.50 | 0.32 |
| Fixed Asset Turnover | 0.68 | 0.39 |
| Payout ratio | 32.6% | 47.5% |
| Dividend yield | 3.01% | 3.21% |
Interpretation of the Ratios
EOG Resources, Inc.
EOG Resources shows strong financial ratios overall, with favorable net margin at 27.39%, ROE at 21.82%, and ROIC at 14.75%. Its liquidity ratios are solid, with a current ratio of 2.1 and a low debt-to-equity ratio of 0.17. Asset turnover metrics are less favorable, suggesting efficiency challenges. EOG pays a dividend with a 3.01% yield, supported by strong free cash flow, indicating sustainable shareholder returns.
Occidental Petroleum Corporation
Occidental Petroleum exhibits mixed ratios with a favorable net margin of 11.23% but an unfavorable ROE of 8.91%. Its liquidity ratios are weak, with a current ratio below 1, signaling potential short-term stress. Debt levels are higher, reflected in a neutral debt-to-equity ratio of 0.79. The dividend yield is slightly above 3%, but given weaker cash flow coverage and higher debt, sustainability may be a concern.
Which one has the best ratios?
EOG Resources presents a more favorable overall ratio profile, with 78.57% favorable metrics and strong profitability, liquidity, and dividend coverage. Occidental Petroleum’s ratios are more mixed, with equal favorable and unfavorable proportions and weaker liquidity and return measures. Based on these comparisons, EOG shows a stronger financial health and ratio performance in 2024.
Strategic Positioning
This section compares the strategic positioning of EOG Resources, Inc. and Occidental Petroleum Corporation, including Market position, Key segments, and disruption:
EOG Resources, Inc.
- Leading U.S.-focused oil and gas producer with moderate beta (0.50), facing typical industry pressure.
- Primarily engaged in oil and condensate, natural gas production, and gathering with key markets in the U.S. and Trinidad and Tobago.
- Limited exposure to technological disruption explicitly stated; focused on traditional hydrocarbon exploration and production.
Occidental Petroleum Corporation
- Diversified energy company with operations in chemicals, midstream, and oil & gas, with lower beta (0.38).
- Operates three segments: oil and gas, chemicals, and midstream, with substantial chemical revenue diversification.
- No explicit mention of technological disruption, but diversified segments may mitigate technological risks.
EOG vs OXY Positioning
EOG focuses on a concentrated portfolio centered on oil and gas production in North America and Trinidad and Tobago, emphasizing upstream activities. Occidental shows a more diversified approach including chemicals and midstream operations, potentially balancing sector cyclicality but adding complexity.
Which has the best competitive advantage?
EOG demonstrates a very favorable moat with a strong and growing ROIC over WACC, indicating durable competitive advantage. Occidental has a slightly favorable moat with growing ROIC but is currently shedding value, reflecting a less robust competitive position.
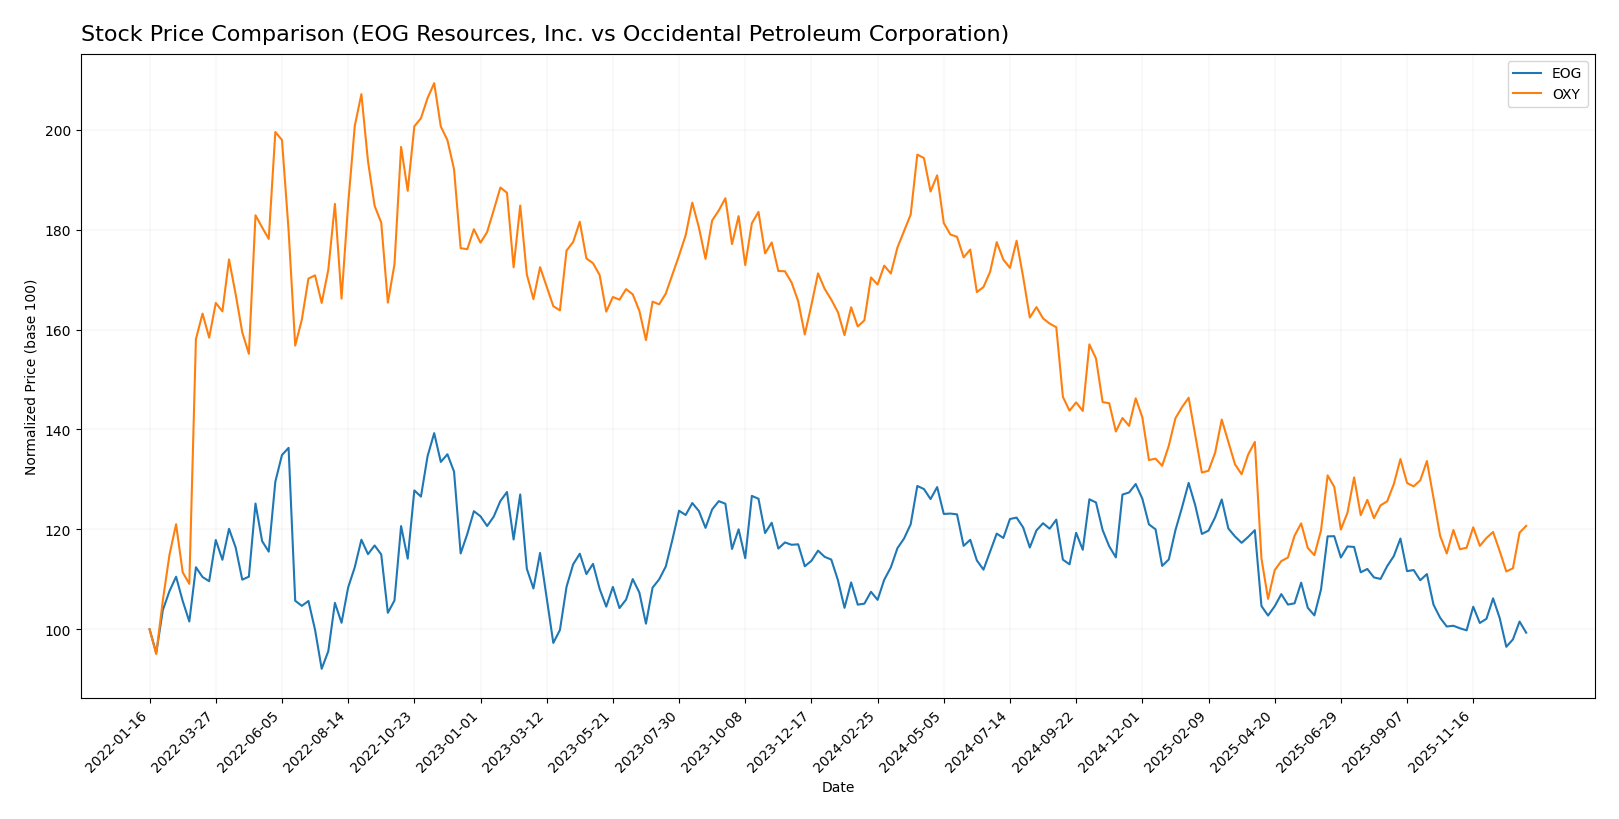
Stock Comparison
The stock prices of EOG Resources, Inc. and Occidental Petroleum Corporation have both experienced significant bearish trends over the past 12 months, with notable volatility and accelerating declines in their market values.
Trend Analysis
EOG Resources, Inc. saw a 7.61% price decline over the past year, confirming a bearish trend with accelerating downward momentum and a standard deviation of 8.9. The stock ranged between 101.93 and 136.58.
Occidental Petroleum Corporation’s stock dropped 29.18% over the same period, also bearish with acceleration and an 8.33 standard deviation, hitting a high of 69.25 and a low of 37.67.
Comparing the two, Occidental Petroleum experienced a steeper decline and thus delivered the weaker market performance relative to EOG Resources over the past year.
Target Prices
The consensus target prices for EOG Resources, Inc. and Occidental Petroleum Corporation indicate moderate upside potential.
| Company | Target High | Target Low | Consensus |
|---|---|---|---|
| EOG Resources, Inc. | 170 | 124 | 139.45 |
| Occidental Petroleum Corporation | 64 | 38 | 49.36 |
Analysts expect EOG’s stock to appreciate from its current price of $104.92 toward the $139 consensus, while Occidental’s consensus target of $49.36 suggests a moderate increase from its $42.86 price.
Analyst Opinions Comparison
This section compares analysts’ ratings and financial grades for EOG Resources, Inc. (EOG) and Occidental Petroleum Corporation (OXY):
Rating Comparison
EOG Rating
- Rating: A-, considered Very Favorable overall by analysts.
- Discounted Cash Flow Score: 5, indicating a very favorable valuation outlook.
- ROE Score: 5, showing very efficient profit generation from equity.
- ROA Score: 5, excellent effectiveness in asset utilization.
- Debt To Equity Score: 2, moderate financial risk with some reliance on debt.
- Overall Score: 4, favorable summary rating reflecting strong fundamentals.
OXY Rating
- Rating: B+, also considered Very Favorable but lower than EOG’s rating.
- Discounted Cash Flow Score: 5, equally very favorable valuation outlook.
- ROE Score: 3, moderate efficiency in generating profit from equity.
- ROA Score: 4, favorable but less than EOG in asset utilization.
- Debt To Equity Score: 1, indicating higher financial risk due to leverage.
- Overall Score: 3, moderate summary rating reflecting some financial concerns.
Which one is the best rated?
Based strictly on the provided data, EOG holds a higher overall rating (A- vs. B+) and superior scores in ROE, ROA, and overall financial health. OXY scores well on discounted cash flow but has higher financial risk from debt.
Scores Comparison
Here is a comparison of the Altman Z-Score and Piotroski Score for EOG Resources and Occidental Petroleum:
EOG Scores
- Altman Z-Score: 3.34, indicating a safe zone with low bankruptcy risk.
- Piotroski Score: 5, reflecting average financial strength.
OXY Scores
- Altman Z-Score: 1.39, indicating a distress zone with high bankruptcy risk.
- Piotroski Score: 5, reflecting average financial strength.
Which company has the best scores?
EOG Resources shows a significantly stronger Altman Z-Score in the safe zone, while both companies share an identical average Piotroski Score of 5. This suggests better financial stability for EOG based on the provided data.
Grades Comparison
The following tables summarize the recent grades assigned to EOG Resources, Inc. and Occidental Petroleum Corporation by recognized grading companies:
EOG Resources, Inc. Grades
This table presents the latest grades from various reputable financial institutions for EOG Resources, Inc.:
| Grading Company | Action | New Grade | Date |
|---|---|---|---|
| Bernstein | Maintain | Market Perform | 2026-01-05 |
| Citigroup | Maintain | Neutral | 2025-12-17 |
| Mizuho | Maintain | Neutral | 2025-12-12 |
| UBS | Maintain | Buy | 2025-12-12 |
| Piper Sandler | Maintain | Neutral | 2025-11-18 |
| Wells Fargo | Maintain | Overweight | 2025-11-11 |
| Piper Sandler | Maintain | Neutral | 2025-10-21 |
| Susquehanna | Maintain | Positive | 2025-10-20 |
| Wells Fargo | Maintain | Overweight | 2025-10-17 |
| Morgan Stanley | Maintain | Equal Weight | 2025-10-14 |
EOG Resources has received mostly neutral to positive grades, with several “Buy” and “Overweight” ratings indicating a favorable outlook.
Occidental Petroleum Corporation Grades
This table shows the recent grades given by credible grading firms for Occidental Petroleum Corporation:
| Grading Company | Action | New Grade | Date |
|---|---|---|---|
| UBS | Maintain | Neutral | 2025-12-12 |
| B of A Securities | Maintain | Neutral | 2025-12-11 |
| JP Morgan | Downgrade | Underweight | 2025-12-08 |
| Citigroup | Maintain | Neutral | 2025-11-19 |
| Piper Sandler | Maintain | Neutral | 2025-11-18 |
| Susquehanna | Maintain | Positive | 2025-11-13 |
| Wells Fargo | Maintain | Underweight | 2025-11-12 |
| Mizuho | Maintain | Outperform | 2025-11-11 |
| Piper Sandler | Maintain | Neutral | 2025-10-21 |
| Susquehanna | Maintain | Positive | 2025-10-20 |
Occidental Petroleum’s grades predominantly range from neutral to underweight, with a few positive and outperform ratings, reflecting a more cautious stance.
Which company has the best grades?
EOG Resources, Inc. holds generally stronger and more consistent buy and overweight ratings compared to Occidental Petroleum Corporation’s mixed neutral and underweight grades. This suggests EOG is viewed more favorably by analysts, potentially impacting investor confidence and portfolio decisions.
Strengths and Weaknesses
Below is a comparison of key strengths and weaknesses for EOG Resources, Inc. and Occidental Petroleum Corporation based on the most recent data.
| Criterion | EOG Resources, Inc. | Occidental Petroleum Corporation |
|---|---|---|
| Diversification | Focused on oil and natural gas segments with strong U.S. presence; less diversified globally | More diversified with chemical, midstream, and oil & gas segments globally |
| Profitability | High profitability: net margin 27.4%, ROIC 14.8%, with strong value creation (ROIC > WACC) | Moderate profitability: net margin 11.2%, ROIC 5.5%, slightly value destructive (ROIC ~ WACC) |
| Innovation | Demonstrates growing ROIC indicating efficient capital use and competitive advantage | ROIC growing but still close to WACC; innovation impact less pronounced |
| Global presence | Primarily U.S. and Trinidad & Tobago markets | Global footprint with significant chemical and midstream operations |
| Market Share | Strong in U.S. oil production with stable revenue from oil and natural gas | Large market share in chemicals and oil & gas segments with broader product base |
Key takeaways: EOG shows stronger profitability and a durable competitive advantage with focused operations and efficient capital use. Occidental offers diversification and global reach but currently has lower profitability and a less established economic moat. Investors should weigh the trade-off between EOG’s efficiency and Occidental’s broader market exposure.
Risk Analysis
Below is a comparison of key risks for EOG Resources, Inc. and Occidental Petroleum Corporation as of 2024:
| Metric | EOG Resources, Inc. | Occidental Petroleum Corporation |
|---|---|---|
| Market Risk | Moderate (beta 0.50) | Lower (beta 0.38) |
| Debt level | Low (D/E 0.17, 11% assets) | High (D/E 0.79, 32% assets) |
| Regulatory Risk | Moderate | Moderate |
| Operational Risk | Moderate | Moderate |
| Environmental Risk | Moderate (energy sector) | Elevated (chemical segment adds complexity) |
| Geopolitical Risk | Limited (US, Trinidad) | Higher (US, Middle East, Africa, Latin America) |
EOG’s strongest risk factor is market volatility, though its low debt and strong coverage ratios reduce financial risk. Occidental faces higher financial risk due to elevated debt and geopolitical exposure, particularly in volatile regions, which could impact operations and profitability. Investors should prioritize EOG for financial stability but remain cautious on market shifts affecting both.
Which Stock to Choose?
EOG Resources, Inc. shows a favorable income evolution with strong net and EBIT margins despite recent slight declines in growth rates. Its financial ratios are very favorable overall, highlighting robust profitability, low debt levels, and excellent interest coverage. The company holds a very favorable rating (A-) and demonstrates a very favorable moat with a durable competitive advantage and growing ROIC.
Occidental Petroleum Corporation presents a favorable income statement but with lower margins and declining recent growth. Its financial ratios are mixed, with several unfavorable liquidity and leverage metrics despite favorable valuation ratios. The company’s rating is also very favorable (B+), yet its moat is only slightly favorable, indicating limited competitive advantage and value creation.
For investors prioritizing financial strength, profitability, and a durable competitive advantage, EOG may appear more favorable given its very favorable rating and strong income and ratio profiles. Conversely, those seeking potential value in a company with improving profitability but higher leverage and mixed ratios might find Occidental’s profile more suitable depending on risk tolerance.
Disclaimer: Investment carries a risk of loss of initial capital. The past performance is not a reliable indicator of future results. Be sure to understand risks before making an investment decision.
Go Further
I encourage you to read the complete analyses of EOG Resources, Inc. and Occidental Petroleum Corporation to enhance your investment decisions: