Navigating the energy sector requires careful analysis, especially when comparing major players like EOG Resources, Inc. and Expand Energy Corporation. Both companies operate in oil and gas exploration and production, yet differ in scale, geographic focus, and innovation strategies. This comparison highlights their unique strengths and challenges. Join me as we explore which of these energy firms presents the most compelling investment opportunity in 2026.
Table of contents
Companies Overview
I will begin the comparison between EOG Resources, Inc. and Expand Energy Corporation by providing an overview of these two companies and their main differences.
EOG Resources, Inc. Overview
EOG Resources, Inc. is an established energy company focused on exploring, developing, producing, and marketing crude oil, natural gas, and natural gas liquids. Headquartered in Houston, Texas, it holds significant net proved reserves primarily in New Mexico, Texas, and Trinidad and Tobago. Founded in 1985, EOG maintains a strong market position within the Oil & Gas Exploration & Production industry.
Expand Energy Corporation Overview
Expand Energy Corporation operates as an independent exploration and production company in the United States, concentrating on unconventional natural gas assets. Based in Oklahoma City, the company owns interests in approximately 5,000 natural gas wells across the Marcellus and Haynesville/Bossier Shales. Formerly Chesapeake Energy, it rebranded in 2024 and is focused on acquisition, exploration, and development of oil and gas properties.
Key similarities and differences
Both EOG and Expand Energy operate in the Oil & Gas Exploration & Production sector with a focus on natural gas and oil extraction. EOG has a broader geographic footprint and larger proved reserves, while Expand Energy specializes in onshore unconventional natural gas plays in specific U.S. shale basins. Market capitalization and employee count also differ, reflecting their scale and operational scope.
Income Statement Comparison
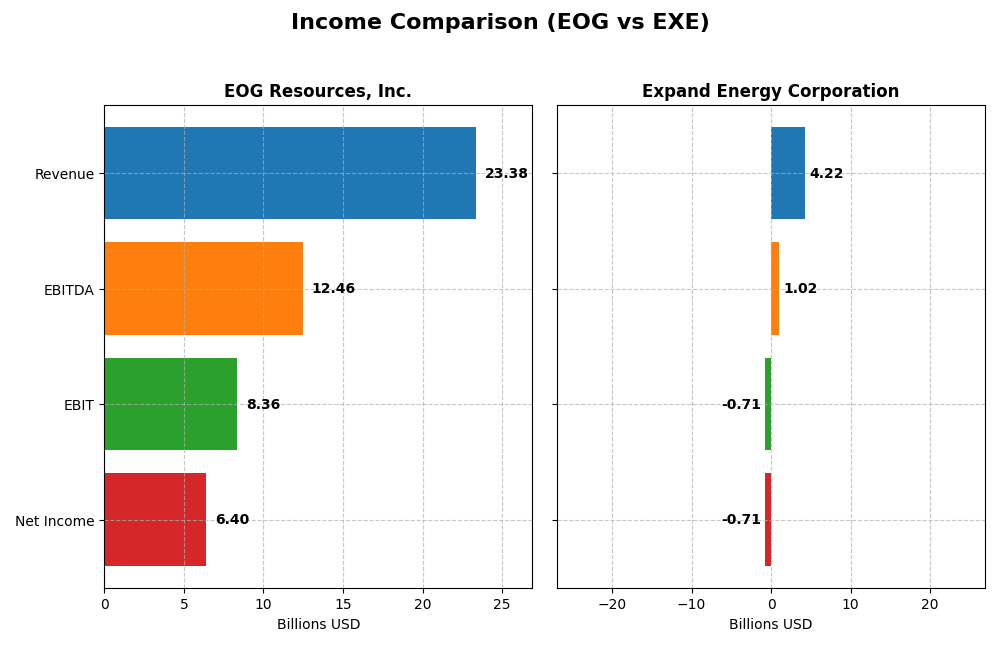
Below is a side-by-side comparison of the key income statement metrics for EOG Resources, Inc. and Expand Energy Corporation for the fiscal year 2024.
| Metric | EOG Resources, Inc. | Expand Energy Corporation |
|---|---|---|
| Market Cap | 57.5B | 24.2B |
| Revenue | 23.4B | 4.22B |
| EBITDA | 12.5B | 1.02B |
| EBIT | 8.36B | -711M |
| Net Income | 6.40B | -714M |
| EPS | 11.31 | -4.55 |
| Fiscal Year | 2024 | 2024 |
Income Statement Interpretations
EOG Resources, Inc.
EOG Resources has shown a strong upward trend in revenue and net income from 2020 to 2024, with revenue growing 137% and net income increasing over 1158%. Margins have remained robust, with a gross margin of 75.7% and net margin at 27.4% in 2024. However, the latest year saw a slowdown in growth, with revenue up only 0.85% and net income declining 16.4%, indicating some margin pressure.
Expand Energy Corporation
Expand Energy experienced a decline in revenue by 19% over the 2020–2024 period but improved net income by 93%. The company posted a gross margin of 27.0% in 2024, yet it reported negative EBIT and net margins, -16.8% and -16.9% respectively. The most recent year showed significant declines across revenue (down 45.7%) and net income, reflecting operational challenges and margin contraction.
Which one has the stronger fundamentals?
EOG Resources presents stronger fundamentals with favorable margins and significant overall growth in revenue and net income despite recent year growth slowing. Conversely, Expand Energy’s fundamentals appear weaker, marked by negative profitability margins and steep declines in recent revenue and earnings. Overall, EOG’s income statement metrics offer a more stable and positive financial profile.
Financial Ratios Comparison
Below is a comparison of key financial ratios for EOG Resources, Inc. and Expand Energy Corporation based on their latest fiscal year data from 2024.
| Ratios | EOG Resources, Inc. | Expand Energy Corporation |
|---|---|---|
| ROE | 21.82% | -4.06% |
| ROIC | 14.75% | -2.70% |
| P/E | 10.84 | -21.89 |
| P/B | 2.36 | 0.89 |
| Current Ratio | 2.10 | 0.64 |
| Quick Ratio | 1.91 | 0.64 |
| D/E | 0.17 | 0.33 |
| Debt-to-Assets | 10.74% | 20.88% |
| Interest Coverage | 58.57 | -6.53 |
| Asset Turnover | 0.50 | 0.15 |
| Fixed Asset Turnover | 0.68 | 0.17 |
| Payout Ratio | 32.59% | -54.34% |
| Dividend Yield | 3.01% | 2.48% |
Interpretation of the Ratios
EOG Resources, Inc.
EOG Resources exhibits predominantly favorable financial ratios in 2024, including a strong net margin of 27.39% and a robust return on equity of 21.82%. Its liquidity and solvency ratios, such as the current ratio at 2.1 and debt-to-equity at 0.17, are solid, though asset turnover ratios are somewhat weak. The company maintains a steady dividend yield of 3.01%, indicating reliable shareholder returns supported by healthy free cash flow coverage.
Expand Energy Corporation
Expand Energy shows generally unfavorable ratios in 2024, with negative net margin (-16.92%) and return on equity (-4.06%), signaling operational and profitability challenges. Liquidity ratios are below par, with a current ratio of 0.64, and interest coverage is negative, reflecting financial stress. Despite this, the company pays a dividend yielding 2.48%, possibly sustained by strategic reinvestment or asset management, but risks remain due to weak earnings and cash flow.
Which one has the best ratios?
Comparatively, EOG Resources presents a very favorable overall ratio profile with strong profitability, liquidity, and dividend metrics, while Expand Energy’s ratios are largely unfavorable, marked by losses and liquidity concerns. EOG’s financial health and shareholder returns appear more robust, whereas Expand is burdened by operational inefficiencies and financial strain in 2024.
Strategic Positioning
This section compares the strategic positioning of EOG Resources, Inc. and Expand Energy Corporation, covering Market position, Key segments, and Exposure to technological disruption:
EOG Resources, Inc.
- Large market cap of 57B, moderate beta; faces competition in US oil and gas E&P sector.
- Diversified revenue: oil, condensate, natural gas liquids, and gas production dominate.
- No explicit data on technological disruption exposure provided.
Expand Energy Corporation
- Mid-sized 24B market cap, lower beta; operates in US natural gas resource plays.
- Focused on natural gas and liquids with significant unconventional gas assets.
- No explicit data on technological disruption exposure provided.
EOG Resources, Inc. vs Expand Energy Corporation Positioning
EOG has a diversified portfolio across oil, condensate, and gas segments, while Expand Energy concentrates on unconventional natural gas assets. EOG’s larger scale offers broader market exposure; Expand’s focus may present concentrated operational risks and opportunities.
Which has the best competitive advantage?
EOG shows a very favorable economic moat with growing ROIC exceeding WACC, indicating durable competitive advantage and value creation. Expand Energy is slightly unfavorable, shedding value despite improving profitability, implying a weaker competitive position.
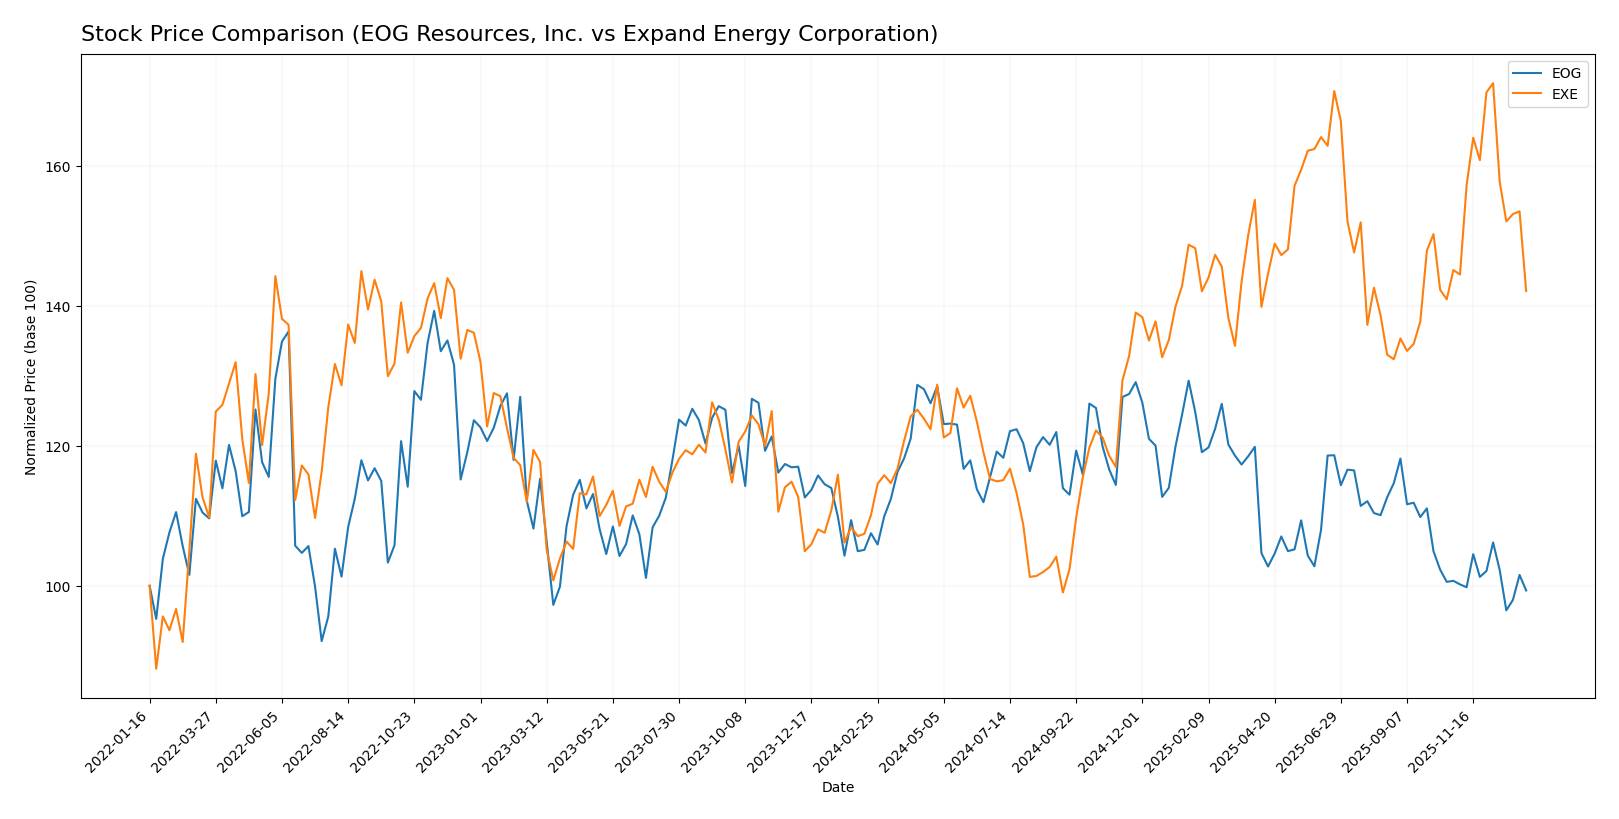
Stock Comparison
The stock prices of EOG Resources, Inc. and Expand Energy Corporation have shown contrasting movements over the past 12 months, with EOG experiencing a bearish trend and EXE displaying bullish momentum despite recent slight declines.
Trend Analysis
EOG Resources, Inc. showed a -7.61% price change over the past year, indicating a bearish trend with accelerating decline and notable volatility (std deviation 8.9), ranging from $101.93 to $136.58. Expand Energy Corporation posted a 29.09% gain over the same period, marking a bullish trend with deceleration and higher volatility (std deviation 12.95), with prices between $70.84 and $122.86. Comparing both, EXE delivered the highest market performance over the last 12 months, significantly outperforming EOG Resources.
Target Prices
Analysts provide a clear consensus on target prices for both EOG Resources, Inc. and Expand Energy Corporation.
| Company | Target High | Target Low | Consensus |
|---|---|---|---|
| EOG Resources, Inc. | 170 | 124 | 139.45 |
| Expand Energy Corporation | 150 | 125 | 140.63 |
The target consensus for EOG Resources at 139.45 suggests a potential upside from its current 104.92 price, while Expand Energy’s 140.63 consensus also indicates room to grow from its current 101.63 level. Overall, analysts expect positive price appreciation for both stocks.
Analyst Opinions Comparison
This section compares the analysts’ ratings and scores for EOG Resources, Inc. and Expand Energy Corporation:
Rating Comparison
EOG Rating
- Rating: A- indicating a very favorable overall evaluation.
- Discounted Cash Flow Score: 5, very favorable, suggesting strong cash flow prospects.
- ROE Score: 5, very favorable, showing excellent profit generation from equity.
- ROA Score: 5, very favorable, demonstrating highly effective asset utilization.
- Debt To Equity Score: 2, moderate, indicating a balanced but moderate financial risk.
- Overall Score: 4, favorable, summarizing strong financial standing.
EXE Rating
- Rating: B reflecting a very favorable but lower overall assessment.
- Discounted Cash Flow Score: 4, favorable, indicating good future cash flow potential.
- ROE Score: 3, moderate, indicating average efficiency in generating profit from equity.
- ROA Score: 4, favorable, showing good asset utilization effectiveness.
- Debt To Equity Score: 2, moderate, reflecting a similar moderate financial risk.
- Overall Score: 3, moderate, indicating a less strong but acceptable financial position.
Which one is the best rated?
Based strictly on the provided data, EOG has higher ratings and scores across most key financial metrics, including discounted cash flow, ROE, ROA, and overall score. EXE scores lower, especially in ROE and overall score, making EOG the better rated company in this comparison.
Scores Comparison
Here is a comparison of the Altman Z-Score and Piotroski Score for EOG Resources and Expand Energy Corporation:
EOG Scores
- Altman Z-Score: 3.34, indicating EOG is in the safe zone
- Piotroski Score: 5, categorized as average financial health
EXE Scores
- Altman Z-Score: 2.43, placing EXE in the grey zone
- Piotroski Score: 6, also considered average financial health
Which company has the best scores?
EOG Resources has a higher Altman Z-Score, suggesting greater financial stability compared to Expand Energy. Both companies have average Piotroski Scores, with EXE slightly higher but still within the same category.
Grades Comparison
The following presents the latest reliable grades for EOG Resources, Inc. and Expand Energy Corporation:
EOG Resources, Inc. Grades
This table summarizes recent analyst grades for EOG Resources, Inc.:
| Grading Company | Action | New Grade | Date |
|---|---|---|---|
| Bernstein | Maintain | Market Perform | 2026-01-05 |
| Citigroup | Maintain | Neutral | 2025-12-17 |
| Mizuho | Maintain | Neutral | 2025-12-12 |
| UBS | Maintain | Buy | 2025-12-12 |
| Piper Sandler | Maintain | Neutral | 2025-11-18 |
| Wells Fargo | Maintain | Overweight | 2025-11-11 |
| Piper Sandler | Maintain | Neutral | 2025-10-21 |
| Susquehanna | Maintain | Positive | 2025-10-20 |
| Wells Fargo | Maintain | Overweight | 2025-10-17 |
| Morgan Stanley | Maintain | Equal Weight | 2025-10-14 |
EOG’s grades predominantly range from Neutral to Overweight, reflecting a generally cautious but positive stance among analysts.
Expand Energy Corporation Grades
This table summarizes recent analyst grades for Expand Energy Corporation:
| Grading Company | Action | New Grade | Date |
|---|---|---|---|
| UBS | Maintain | Buy | 2026-01-08 |
| Jefferies | Maintain | Buy | 2026-01-08 |
| Bernstein | Maintain | Outperform | 2026-01-05 |
| Citigroup | Maintain | Buy | 2025-12-19 |
| Mizuho | Maintain | Outperform | 2025-12-12 |
| UBS | Maintain | Buy | 2025-12-12 |
| Piper Sandler | Maintain | Overweight | 2025-11-18 |
| Morgan Stanley | Maintain | Overweight | 2025-10-30 |
| UBS | Maintain | Buy | 2025-10-30 |
| Morgan Stanley | Maintain | Overweight | 2025-10-14 |
Expand Energy Corporation’s grades are consistently Buy or Outperform, indicating strong analyst confidence.
Which company has the best grades?
Expand Energy Corporation has received consistently stronger grades, with multiple Buy and Outperform ratings, compared to EOG Resources’ more mixed Neutral and Overweight grades. This suggests that analysts are generally more optimistic about Expand Energy’s prospects, which may influence investor sentiment and portfolio positioning.
Strengths and Weaknesses
Below is a comparison of key strengths and weaknesses for EOG Resources, Inc. (EOG) and Expand Energy Corporation (EXE) based on the most recent financial and operational data.
| Criterion | EOG Resources, Inc. (EOG) | Expand Energy Corporation (EXE) |
|---|---|---|
| Diversification | Strong diversification across oil, natural gas, liquids, and marketing segments | Moderate diversification focused on natural gas and marketing |
| Profitability | High profitability with 27.4% net margin and 21.8% ROE; ROIC at 14.75% well above WACC | Negative profitability: -16.9% net margin, -4.1% ROE, ROIC at -2.7% below WACC |
| Innovation | Demonstrates durable competitive advantage with growing ROIC trend | Growing ROIC trend but still value destroying; innovation impact uncertain |
| Global presence | Significant US and Trinidad operations with strong market position | Primarily focused on North American natural gas markets |
| Market Share | Large market share in oil and gas production and marketing | Smaller market share, less scale compared to EOG |
EOG Resources stands out with strong profitability, a very favorable economic moat, and diversified revenue streams, making it a robust investment candidate. In contrast, Expand Energy shows signs of recovering profitability but remains value destructive, with weaker financial health and smaller market presence, warranting cautious consideration.
Risk Analysis
Below is a comparative risk assessment for EOG Resources, Inc. and Expand Energy Corporation based on the latest available data for 2024-2026.
| Metric | EOG Resources, Inc. | Expand Energy Corporation |
|---|---|---|
| Market Risk | Moderate (Beta 0.50) | Moderate (Beta 0.45) |
| Debt level | Low (D/E 0.17) | Moderate (D/E 0.33) |
| Regulatory Risk | Medium (Energy sector compliance) | Medium (Energy sector compliance) |
| Operational Risk | Moderate (Asset turnover low) | High (Negative margins, low asset turnover) |
| Environmental Risk | Medium (Oil & Gas industry impact) | Medium (Oil & Gas industry impact) |
| Geopolitical Risk | Moderate (US and Trinidad exposure) | Moderate (US focused) |
EOG Resources shows a stronger financial position with low debt and solid coverage, making its operational and market risks more manageable. Expand Energy faces higher operational risks from negative profitability and tighter liquidity, increasing financial distress risk despite moderate debt. Investors should weigh EOG’s stability against Expand’s growth challenges and potential volatility.
Which Stock to Choose?
EOG Resources, Inc. has shown strong income growth over 2020-2024 with favorable profitability metrics, including a 27.39% net margin and 21.82% ROE. Its debt levels are low and well-covered by interest, supported by a very favorable A- rating and a robust economic moat.
Expand Energy Corporation presents weak income trends with a negative net margin of -16.92% and negative ROE. Despite some favorable debt ratios and a B rating, its overall financial health is challenged by high leverage and unfavorable profitability, reflecting a slightly unfavorable moat rating.
For risk-averse investors valuing stable profitability and a durable competitive advantage, EOG may appear more favorable, while risk-tolerant investors seeking potential growth opportunities might consider EXE’s recent stock appreciation despite financial weaknesses.
Disclaimer: Investment carries a risk of loss of initial capital. The past performance is not a reliable indicator of future results. Be sure to understand risks before making an investment decision.
Go Further
I encourage you to read the complete analyses of EOG Resources, Inc. and Expand Energy Corporation to enhance your investment decisions: