EOG Resources, Inc. and EQT Corporation are two prominent players in the U.S. oil and gas exploration and production sector, each with a distinct approach to energy resources. EOG focuses on crude oil and natural gas liquids, while EQT specializes in natural gas production, particularly in the Marcellus region. This comparison highlights their market overlap and innovation strategies to help you, the investor, decide which company offers the most compelling opportunity in today’s evolving energy landscape.
Table of contents
Companies Overview
I will begin the comparison between EOG Resources, Inc. and EQT Corporation by providing an overview of these two companies and their main differences.
EOG Overview
EOG Resources, Inc. is an energy company focused on exploring, developing, producing, and marketing crude oil, natural gas, and natural gas liquids. Headquartered in Houston, Texas, it operates mainly in New Mexico, Texas, and Trinidad and Tobago. As of 2021, EOG reported substantial proved reserves totaling 3,747 million barrels of oil equivalent, positioning it as a significant player in oil and gas exploration and production.
EQT Overview
EQT Corporation is a U.S.-based natural gas production company headquartered in Pittsburgh, Pennsylvania. It specializes in producing natural gas and natural gas liquids such as ethane, propane, and butane. EQT holds 25.0 trillion cubic feet of proved reserves across roughly 2.0 million gross acres, including 1.7 million in the Marcellus play, making it a major natural gas producer with a focus on U.S. reserves.
Key similarities and differences
Both EOG and EQT operate within the oil and gas exploration and production sector, with a focus on hydrocarbons. However, EOG has a broader portfolio including crude oil and operates internationally, while EQT primarily produces natural gas and natural gas liquids with a focus on U.S. reserves. EOG’s market capitalization is notably higher at $57.5B compared to EQT’s $31.9B, reflecting differences in scale and asset diversity.
Income Statement Comparison
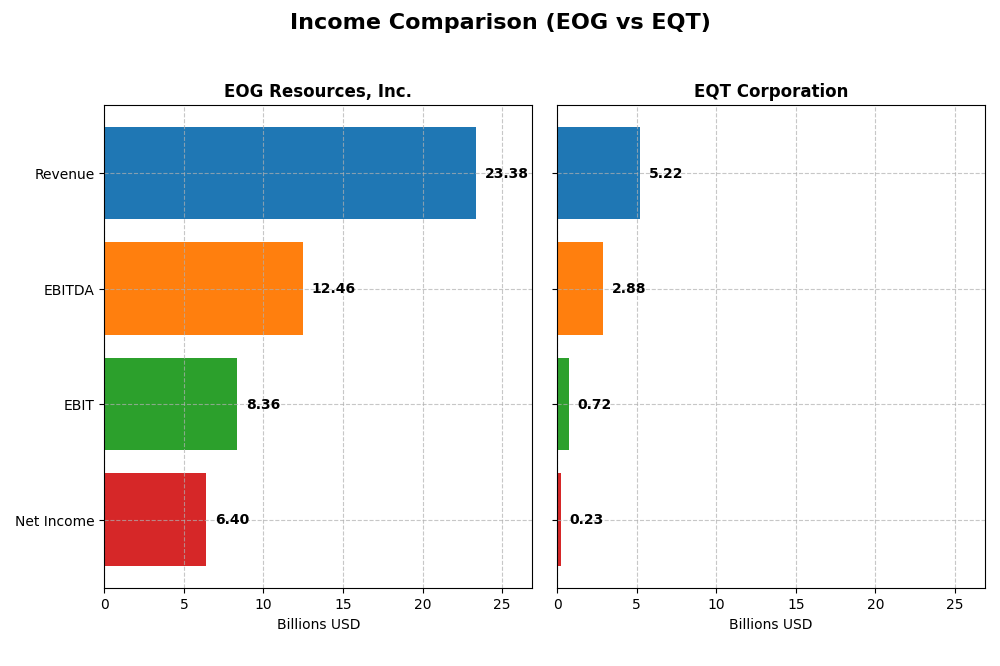
Below is the income statement comparison for EOG Resources, Inc. and EQT Corporation for the fiscal year 2024, highlighting key financial metrics to facilitate a clear evaluation.
| Metric | EOG Resources, Inc. | EQT Corporation |
|---|---|---|
| Market Cap | 57.5B | 31.9B |
| Revenue | 23.4B | 5.2B |
| EBITDA | 12.5B | 2.9B |
| EBIT | 8.4B | 0.7B |
| Net Income | 6.4B | 0.2B |
| EPS | 11.31 | 0.45 |
| Fiscal Year | 2024 | 2024 |
Income Statement Interpretations
EOG Resources, Inc.
EOG Resources demonstrated strong revenue growth of 137% from 2020 to 2024, with net income surging over 1158% in the same period. Margins remain robust, with a gross margin of 75.7% and net margin near 27.4%. However, in 2024, growth slowed with a slight revenue increase of 0.85% and a 16.4% decline in net margin, indicating some recent margin pressure.
EQT Corporation
EQT’s revenue increased by 96% from 2020 to 2024, accompanied by a net income growth of 124%. Margins are comparatively modest, with a 14.7% gross margin and a 4.4% net margin in 2024. The latest year showed a 3% revenue rise but a significant 87% fall in net margin, reflecting weaker profitability despite stable top-line growth.
Which one has the stronger fundamentals?
EOG Resources exhibits stronger fundamentals with higher and more consistent profitability margins and larger overall income growth. EQT’s performance is more mixed, with neutral margin levels and recent margin deterioration despite revenue gains. EOG’s favorable margin metrics and substantial earnings growth outweigh EQT’s neutral evaluations and weaker recent profitability.
Financial Ratios Comparison
The table below presents a side-by-side comparison of key financial ratios for EOG Resources, Inc. and EQT Corporation for the fiscal year 2024, offering insights into their operational efficiency, profitability, liquidity, and leverage.
| Ratios | EOG Resources, Inc. | EQT Corporation |
|---|---|---|
| ROE | 21.82% | 1.12% |
| ROIC | 14.75% | 1.66% |
| P/E | 10.84 | 101.91 |
| P/B | 2.36 | 1.14 |
| Current Ratio | 2.10 | 0.70 |
| Quick Ratio | 1.91 | 0.70 |
| D/E (Debt-to-Equity) | 0.17 | 0.45 |
| Debt-to-Assets | 10.74% | 23.51% |
| Interest Coverage | 58.57 | 1.51 |
| Asset Turnover | 0.50 | 0.13 |
| Fixed Asset Turnover | 0.68 | 0.16 |
| Payout Ratio | 32.59% | 141.64% |
| Dividend Yield | 3.01% | 1.39% |
Interpretation of the Ratios
EOG Resources, Inc.
EOG Resources exhibits strong financial health with favorable net margin (27.39%), ROE (21.82%), ROIC (14.75%), and a solid current ratio of 2.1, indicating good liquidity. Despite slightly unfavorable asset turnover ratios, its interest coverage ratio (60.55) and manageable debt levels underscore financial stability. The company pays a dividend with a favorable 3.01% yield, supported by strong free cash flow, suggesting sustainable shareholder returns.
EQT Corporation
EQT Corporation shows weaker financial ratios, including a low net margin (4.42%), ROE (1.12%), and ROIC (1.66%), reflecting limited profitability. Its liquidity ratios are unfavorable, with a current ratio of 0.7 and low interest coverage at 1.58, indicating potential financial stress. The dividend yield is modest at 1.39% but considered neutral given the company’s challenging profitability and cash flow position.
Which one has the best ratios?
EOG Resources clearly holds a stronger ratio profile with predominantly favorable metrics reflecting profitability, liquidity, and financial stability. Conversely, EQT Corporation faces several unfavorable ratios, particularly in profitability and liquidity, which weigh on its overall financial strength. Based on these evaluations, EOG Resources demonstrates superior financial ratio performance.
Strategic Positioning
This section compares the strategic positioning of EOG Resources, Inc. and EQT Corporation, focusing on market position, key segments, and exposure to technological disruption:
EOG Resources, Inc.
- Larger market cap of 57.5B with lower beta of 0.50, facing typical oil & gas competitive pressure.
- Diversified revenue streams: oil, natural gas, liquids, and marketing operations across multiple regions.
- No explicit data on technological disruption exposure provided, operates in traditional oil & gas sectors.
EQT Corporation
- Smaller market cap of 31.9B with beta of 0.68, concentrated in natural gas production.
- Primarily focused on natural gas and NGLs production and sales, concentrated in Marcellus play.
- No explicit data on technological disruption exposure provided, focused on natural gas extraction.
EOG vs EQT Positioning
EOG exhibits a diversified business model with multiple product lines and geographical presence, while EQT is concentrated mainly on natural gas production in the U.S. EOG’s broader scope may offer varied revenue sources; EQT’s focus may limit diversification but leverages a specific resource base.
Which has the best competitive advantage?
EOG demonstrates a very favorable economic moat with growing ROIC exceeding WACC by 8.88%, indicating durable competitive advantage. EQT shows a slightly unfavorable moat, shedding value despite improving profitability, reflecting weaker competitive positioning.
Stock Comparison
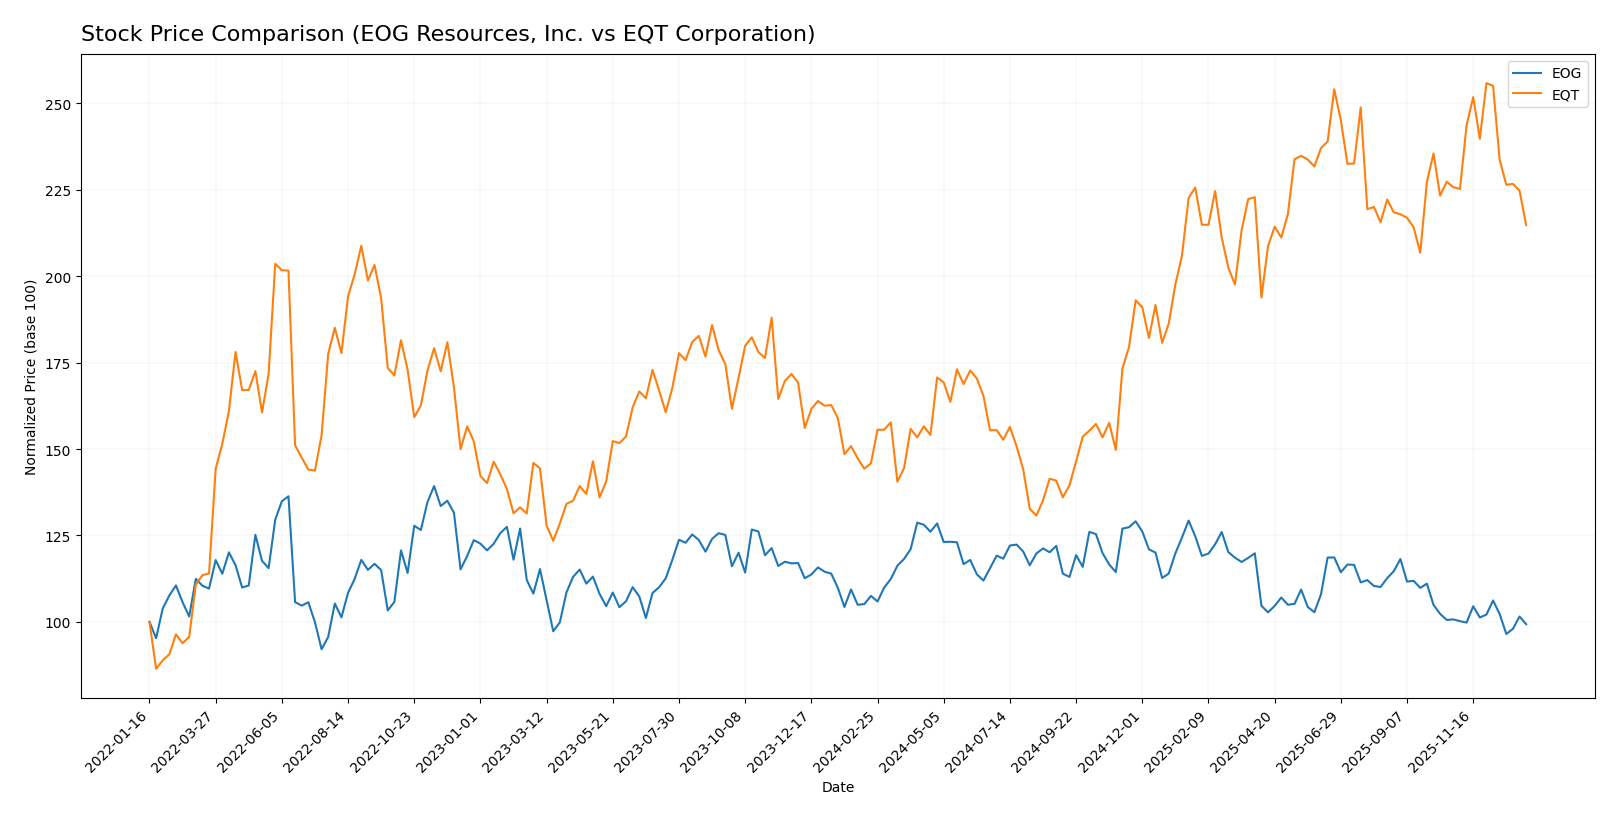
The stock prices of EOG Resources, Inc. and EQT Corporation over the past 12 months show contrasting trends, with EOG exhibiting a bearish acceleration and EQT a bullish deceleration, both facing recent downward pressure in trading dynamics.
Trend Analysis
EOG Resources, Inc. experienced a bearish trend over the past year with a -7.61% price decline, accelerating downward from a high of 136.58 to a low of 101.93, and recent trading shows a mild -1.37% drop.
EQT Corporation showed a strong bullish trend over the same period with a 47.23% price increase, though with decelerating momentum; its price ranged from 31.1 to 60.86, but recent sessions saw a -4.86% decline.
Comparatively, EQT delivered the highest market performance with a significant positive return, whereas EOG weakened, despite both stocks facing recent short-term downward trends.
Target Prices
The consensus target prices from verified analysts indicate a positive outlook for both EOG Resources, Inc. and EQT Corporation.
| Company | Target High | Target Low | Consensus |
|---|---|---|---|
| EOG Resources, Inc. | 170 | 124 | 139.45 |
| EQT Corporation | 55 | 23 | 41.11 |
Analysts expect EOG Resources to trade well above its current price of $104.92, suggesting upside potential. EQT’s consensus target of $41.11 is below its current price of $51.09, implying a more cautious outlook.
Analyst Opinions Comparison
This section compares analysts’ ratings and grades for EOG Resources, Inc. and EQT Corporation:
Rating Comparison
EOG Rating
- Rating: A-, classified as Very Favorable.
- Discounted Cash Flow Score: 5, indicating a Very Favorable valuation outlook.
- ROE Score: 5, showing very efficient profit generation from equity.
- ROA Score: 5, demonstrating very effective asset utilization.
- Debt To Equity Score: 2, reflecting a Moderate financial risk profile.
- Overall Score: 4, assessed as Favorable.
EQT Rating
- Rating: A-, classified as Very Favorable.
- Discounted Cash Flow Score: 5, indicating a Very Favorable valuation outlook.
- ROE Score: 4, showing favorable but lower efficiency in profit generation.
- ROA Score: 4, demonstrating favorable but lesser asset utilization.
- Debt To Equity Score: 2, reflecting a Moderate financial risk profile.
- Overall Score: 4, assessed as Favorable.
Which one is the best rated?
Both EOG and EQT share the same overall rating of A- and an overall score of 4, indicating favorable assessments. However, EOG scores higher in return on equity and assets, suggesting stronger operational efficiency compared to EQT.
Scores Comparison
Here is a comparison of the Altman Z-Score and Piotroski Score for EOG and EQT:
EOG Scores
- Altman Z-Score: 3.34, indicating a safe zone.
- Piotroski Score: 5, reflecting average financial strength.
EQT Scores
- Altman Z-Score: 2.01, placing it in the grey zone.
- Piotroski Score: 8, indicating very strong financial health.
Which company has the best scores?
EOG has a higher Altman Z-Score in the safe zone, suggesting lower bankruptcy risk. EQT scores much stronger on Piotroski, showing better financial health. Both present strengths in different risk and stability measures.
Grades Comparison
Here is a comparison of the recent grades assigned to EOG Resources, Inc. and EQT Corporation by major grading companies:
EOG Resources, Inc. Grades
The table below displays the latest grades from established financial institutions for EOG Resources, Inc.:
| Grading Company | Action | New Grade | Date |
|---|---|---|---|
| Bernstein | Maintain | Market Perform | 2026-01-05 |
| Citigroup | Maintain | Neutral | 2025-12-17 |
| Mizuho | Maintain | Neutral | 2025-12-12 |
| UBS | Maintain | Buy | 2025-12-12 |
| Piper Sandler | Maintain | Neutral | 2025-11-18 |
| Wells Fargo | Maintain | Overweight | 2025-11-11 |
| Piper Sandler | Maintain | Neutral | 2025-10-21 |
| Susquehanna | Maintain | Positive | 2025-10-20 |
| Wells Fargo | Maintain | Overweight | 2025-10-17 |
| Morgan Stanley | Maintain | Equal Weight | 2025-10-14 |
EOG’s grades predominantly range from Neutral to Buy, with consistent maintenance of these ratings indicating stability in market perception.
EQT Corporation Grades
Below are the recent grades from recognized grading companies for EQT Corporation:
| Grading Company | Action | New Grade | Date |
|---|---|---|---|
| Bernstein | Maintain | Outperform | 2026-01-05 |
| Citigroup | Maintain | Buy | 2025-12-19 |
| Mizuho | Maintain | Outperform | 2025-12-12 |
| UBS | Maintain | Buy | 2025-12-12 |
| Scotiabank | Maintain | Sector Perform | 2025-11-21 |
| Piper Sandler | Maintain | Neutral | 2025-11-18 |
| Wells Fargo | Maintain | Overweight | 2025-10-23 |
| UBS | Maintain | Buy | 2025-10-17 |
| Scotiabank | Maintain | Sector Perform | 2025-10-09 |
| Barclays | Maintain | Overweight | 2025-10-07 |
EQT’s grades mostly fall into the Buy and Outperform categories, showing a generally more optimistic outlook from analysts.
Which company has the best grades?
EQT Corporation holds generally higher grades, including multiple Outperform and Buy ratings, compared to EOG Resources’ mix of Neutral and Buy ratings. This suggests EQT may be viewed more favorably by analysts, potentially affecting investor sentiment and portfolio allocation decisions.
Strengths and Weaknesses
Below is a comparison of key strengths and weaknesses for EOG Resources, Inc. (EOG) and EQT Corporation (EQT) based on recent financial and operational data.
| Criterion | EOG Resources, Inc. | EQT Corporation |
|---|---|---|
| Diversification | Broad revenue streams: oil, natural gas, liquids, and midstream services with significant US presence and international exposure. | Primarily focused on natural gas with less diversification; limited oil sales and midstream activities. |
| Profitability | High profitability: net margin 27.4%, ROIC 14.75%, strong ROE 21.8%, and favorable PE of 10.8. | Low profitability: net margin 4.4%, ROIC 1.66%, weak ROE 1.1%, very high PE at 101.9. |
| Innovation | Demonstrates durable competitive advantage with growing ROIC, indicating efficient capital use and operational improvements. | ROIC growing but still below WACC, indicating value destruction despite improving profitability. |
| Global presence | Strong US market with significant oil and gas production; some international operations (e.g., Trinidad and Tobago). | Mainly US-focused, limited international presence, concentrated in natural gas markets. |
| Market Share | Large market share in oil and condensate production with substantial natural gas gathering and transportation. | Smaller market share, focused on natural gas sales with limited oil contribution, lower asset turnover ratios. |
Key takeaways: EOG stands out with robust profitability, diversified operations, and a strong competitive moat, making it a value creator. EQT, while showing some improvement, struggles with low profitability and higher risk, reflecting a less favorable investment profile. Investors should weigh EOG’s strengths against EQT’s ongoing challenges.
Risk Analysis
Below is a comparison table of key risks for EOG Resources, Inc. and EQT Corporation based on the most recent data available in 2026:
| Metric | EOG Resources, Inc. | EQT Corporation |
|---|---|---|
| Market Risk | Moderate (Beta 0.50) | Moderate (Beta 0.68) |
| Debt level | Low (Debt/Equity 0.17) | Moderate (Debt/Equity 0.45) |
| Regulatory Risk | Moderate (Energy sector) | Moderate (Energy sector) |
| Operational Risk | Moderate (Oil & Gas E&P) | Moderate (Natural Gas E&P) |
| Environmental Risk | Elevated (Fossil fuel focus) | Elevated (Fossil fuel focus) |
| Geopolitical Risk | Moderate (US & Trinidad) | Moderate (US-focused) |
The most impactful risks for both companies stem from environmental and regulatory challenges linked to fossil fuel operations. EQT’s higher debt and weaker liquidity increase its financial vulnerability. EOG’s stronger financials and lower leverage provide a cushion against market and operational shocks.
Which Stock to Choose?
EOG Resources, Inc. shows strong income growth over 2020-2024, with favorable profitability and solid financial ratios including a 21.8% ROE and low debt levels. Its rating is very favorable, supported by a robust economic moat indicating durable competitive advantage.
EQT Corporation presents more modest income growth and neutral to unfavorable profitability metrics, with a weaker ROE of 1.12% and higher debt burden. While its rating remains very favorable overall, its financial ratios and economic moat status are less convincing, reflecting value destruction but improving profitability.
For investors prioritizing consistent profitability and strong financial health, EOG might appear more favorable due to its solid income evolution and very favorable ratios. Conversely, those with a higher risk tolerance or seeking potential turnaround opportunities could interpret EQT’s improving but still challenged metrics as worth monitoring.
Disclaimer: Investment carries a risk of loss of initial capital. The past performance is not a reliable indicator of future results. Be sure to understand risks before making an investment decision.
Go Further
I encourage you to read the complete analyses of EOG Resources, Inc. and EQT Corporation to enhance your investment decisions: