Home > Comparison > Utilities > XEL vs ETR
The strategic rivalry between Xcel Energy Inc. and Entergy Corporation defines the current dynamics in the regulated electric utilities sector. Xcel Energy operates a diverse, multi-state utility model with strong emphasis on renewable sources. Entergy combines utility operations with significant nuclear power generation and wholesale commodity sales. This analysis pits their distinct operational approaches against each other to identify which corporate strategy delivers superior risk-adjusted returns for a diversified portfolio.
Table of contents
Companies Overview
Xcel Energy and Entergy Corporation stand as pivotal players in the regulated electric utility sector, shaping energy delivery across diverse U.S. regions.
Xcel Energy Inc.: Diverse Energy Producer and Distributor
Xcel Energy operates as a regulated electric utility, generating and distributing electricity through coal, nuclear, natural gas, hydro, solar, and wind sources. Its revenue primarily stems from electricity and natural gas sales to 3.7M and 2.1M customers, respectively. In 2026, Xcel emphasizes investing in renewable generation facilities and natural gas infrastructure, aiming to enhance its clean energy portfolio and grid reliability.
Entergy Corporation: Integrated Utility with Nuclear Strength
Entergy positions itself as a regulated electric utility with significant wholesale operations, generating electricity via nuclear, gas, coal, hydro, and solar power. It serves 3M utility customers in four states while also operating wholesale power plants, including 6,000 MW of nuclear capacity. Its strategic focus in 2026 targets optimizing nuclear plant operations and expanding wholesale power sales to bolster long-term earnings stability.
Strategic Collision: Similarities & Divergences
Both companies champion regulated electric utilities but diverge in asset composition and market approach. Xcel pursues a broad energy mix with a strong push into renewables and natural gas, while Entergy leans heavily on nuclear power and wholesale markets. The primary battleground lies in balancing clean energy transition with reliable supply. Investors face distinct profiles: Xcel offers growth through renewables; Entergy delivers steady cash flow from nuclear assets.
Income Statement Comparison
The following data dissects the core profitability and scalability of both corporate engines to reveal who dominates the bottom line:
| Metric | Xcel Energy Inc. (XEL) | Entergy Corporation (ETR) |
|---|---|---|
| Revenue | 14.7B | 11.9B |
| Cost of Revenue | 11.1B | 6.1B |
| Operating Expenses | 686M | 3.1B |
| Gross Profit | 3.6B | 5.7B |
| EBITDA | 6.1B | 5.0B |
| EBIT | 3.1B | 2.6B |
| Interest Expense | 1.3B | 1.2B |
| Net Income | 2.0B | 1.1B |
| EPS | 3.44 | 2.47 |
| Fiscal Year | 2025 | 2024 |
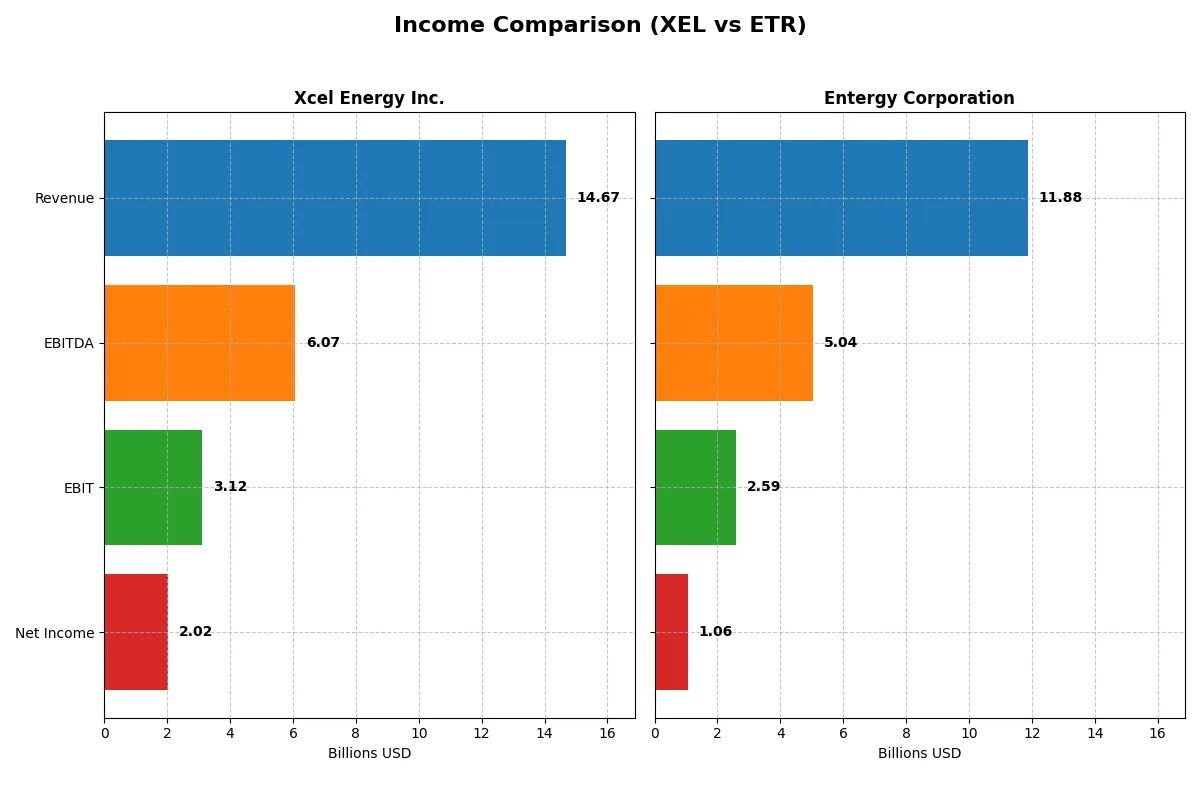
Income Statement Analysis: The Bottom-Line Duel
This income statement comparison reveals which company runs a more efficient and profitable financial engine across recent years.
Xcel Energy Inc. Analysis
Xcel Energy shows steady revenue growth, increasing from 13.4B in 2024 to 14.7B in 2025. Net income rose to 2.0B in 2025, reflecting solid bottom-line momentum. Gross margins contracted sharply in 2025 but remain healthy at 24.3%, while net margins hold at a favorable 13.8%, signaling resilient profitability despite cost pressures.
Entergy Corporation Analysis
Entergy’s revenue dipped slightly from 12.1B in 2023 to 11.9B in 2024, with net income dropping sharply to 1.06B in 2024 from 2.36B in 2023. The company sustains a robust gross margin of 48.3%, but the net margin shrank to 8.9%, reflecting significant margin compression and weaker bottom-line efficiency in the latest year.
Margin Power vs. Revenue Scale
Xcel Energy delivers superior revenue growth and improved net income over time, while Entergy boasts stronger gross margins but suffers net income declines. Xcel’s profile is more attractive for investors seeking consistent profit expansion and margin resilience amid sector headwinds.
Financial Ratios Comparison
These vital ratios act as a diagnostic tool to expose the underlying fiscal health, valuation premiums, and capital efficiency of the companies analyzed:
| Ratios | Xcel Energy Inc. (XEL) | Entergy Corporation (ETR) |
|---|---|---|
| ROE | 9.9% (2024) | 6.9% (2024) |
| ROIC | 3.6% (2024) | 3.2% (2024) |
| P/E | 19.6 (2024) | 30.6 (2024) |
| P/B | 1.95 (2024) | 2.12 (2024) |
| Current Ratio | 0.67 (2024) | 0.70 (2024) |
| Quick Ratio | 0.57 (2024) | 0.41 (2024) |
| D/E | 1.55 (2024) | 1.92 (2024) |
| Debt-to-Assets | 43.1% (2024) | 45.2% (2024) |
| Interest Coverage | 2.02 (2024) | 2.30 (2024) |
| Asset Turnover | 0.19 (2024) | 0.18 (2024) |
| Fixed Asset Turnover | 0.23 (2024) | 0.25 (2024) |
| Payout ratio | 61% (2024) | 94% (2024) |
| Dividend yield | 3.1% (2024) | 3.1% (2024) |
| Fiscal Year | 2024 | 2024 |
Efficiency & Valuation Duel: The Vital Signs
Financial ratios act as a company’s DNA, exposing hidden risks and operational strengths that shape investment decisions.
Xcel Energy Inc.
Xcel Energy posts a favorable net margin of 13.76%, indicating strong core profitability. Its P/E ratio at 21.48 sits in a neutral range, suggesting valuation is fair but not stretched. A dividend yield of 3.83% rewards shareholders steadily, offsetting weaker returns on equity and capital, reflective of a cautious capital allocation approach.
Entergy Corporation
Entergy’s net margin of 8.93% is neutral but lower than Xcel’s, while its P/E of 30.56 signals an expensive valuation. Return on equity at 6.93% and ROIC at 3.19% lag industry standards, raising concerns about operational efficiency. The dividend yield of 3.08% offers modest income, but debt metrics and asset turnover ratios are less favorable.
Premium Valuation vs. Operational Safety
Xcel Energy balances profitability and shareholder returns with a more conservative valuation and stronger margin profile. Entergy’s higher valuation risks outweigh its dividend appeal amid weaker operational metrics. Investors seeking stable income and operational safety may prefer Xcel, while those tolerating higher valuation pay a premium for Entergy’s profile.
Which one offers the Superior Shareholder Reward?
I compare Xcel Energy Inc. (XEL) and Entergy Corporation (ETR) on dividends, payout ratios, and buyback intensity. XEL yields 3.83%, with an 82% payout ratio, signaling aggressive cash return but limited free cash flow coverage. ETR offers a 3.08% yield but a 94% payout ratio, indicating higher distribution risk. Both show negative free cash flow per share, reflecting capital-intensive operations. XEL’s buyback activity appears moderate; ETR’s debt leverage suggests constrained buybacks. I see XEL’s slightly more sustainable model, balancing dividends with growth, as superior for total shareholder return in 2026.
Comparative Score Analysis: The Strategic Profile
The radar chart reveals the fundamental DNA and trade-offs of Xcel Energy Inc. and Entergy Corporation, highlighting their financial strengths and vulnerabilities:
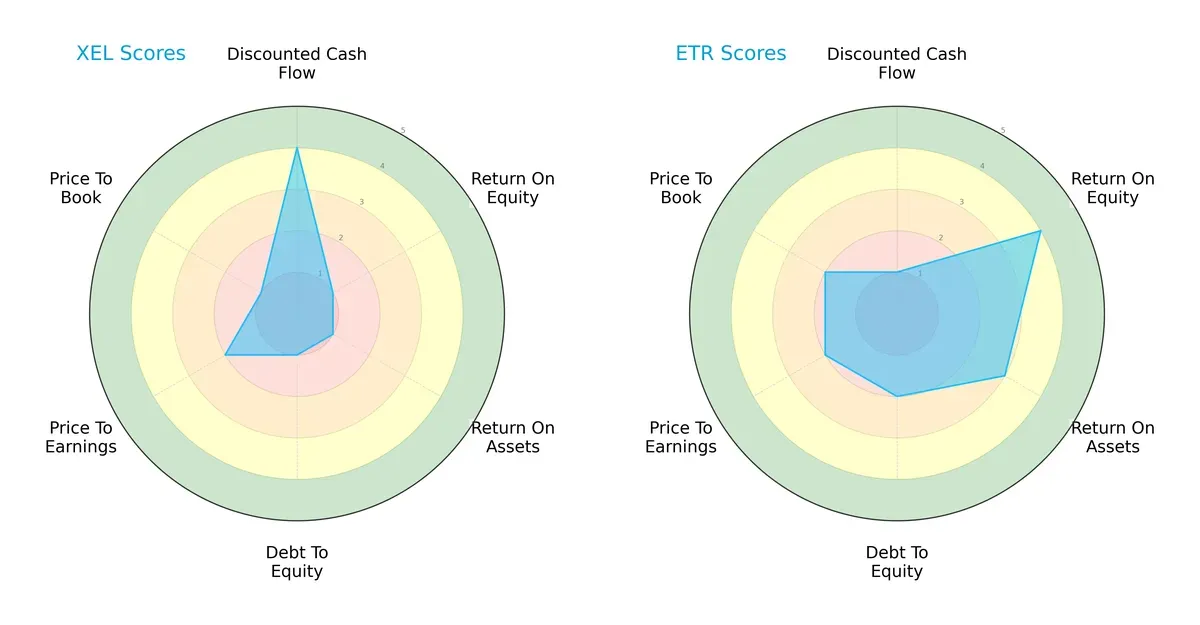
Xcel Energy excels in discounted cash flow with a strong score of 4 but suffers from very low profitability and leverage metrics (ROE, ROA, Debt/Equity all at 1). Entergy shows robust profitability (ROE 4, ROA 3) and a slightly better debt profile (2), though its DCF score is weak at 1. Xcel relies heavily on valuation appeal, while Entergy presents a more balanced operational performance but faces valuation risks. Overall, Entergy’s profile is more balanced, while Xcel depends on future cash flow optimism.
Financial Health: Quality of Operations
Both Xcel Energy and Entergy hold a Piotroski F-Score of 4, indicating average financial health. Neither firm stands out in operational quality, and both show room for improvement in profitability, leverage, and liquidity metrics:

How are the two companies positioned?
This section dissects the operational DNA of XEL and ETR by comparing their revenue distribution and internal dynamics—strengths and weaknesses. The goal is to confront their economic moats to reveal which model delivers the most resilient, sustainable competitive advantage today.
Revenue Segmentation: The Strategic Mix
This visual comparison dissects how Xcel Energy Inc. and Entergy Corporation diversify their income streams and reveals where their primary sector bets lie:
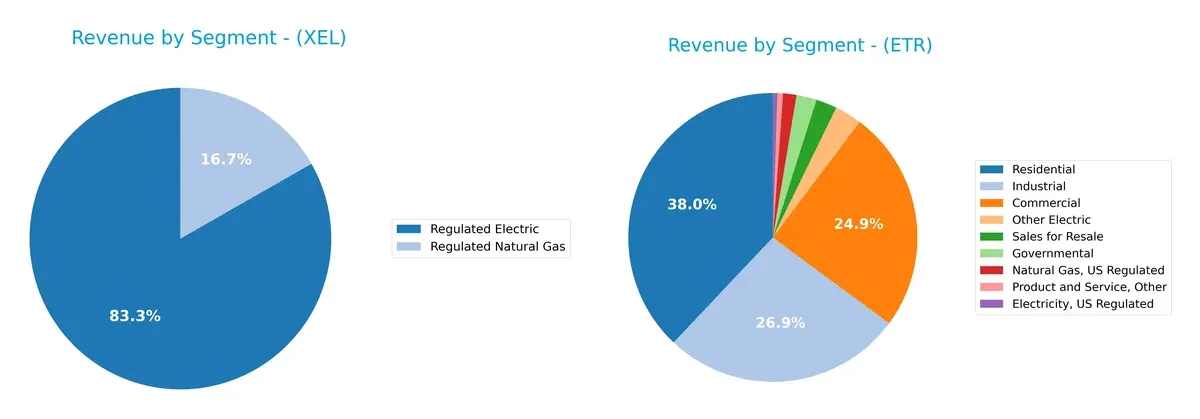
Xcel Energy leans heavily on Regulated Electric, which dwarfs its Regulated Natural Gas segment at $22.3B versus $4.5B in 2024. Entergy, by contrast, spreads revenue across Residential ($4.5B), Commercial ($3B), and Industrial ($3.2B) segments, showing a more diversified mix. Xcel’s concentration suggests strong regulatory moat but higher single-segment risk. Entergy’s spread lowers concentration risk but may dilute ecosystem dominance.
Strengths and Weaknesses Comparison
This table compares the strengths and weaknesses of Xcel Energy Inc. and Entergy Corporation:
Xcel Energy Inc. Strengths
- Strong net margin at 13.76%
- Favorable debt-to-equity and debt-to-assets ratios
- Solid dividend yield of 3.83%
- Diverse regulated electric and natural gas revenue streams totaling over 26B USD
Entergy Corporation Strengths
- Favorable WACC at 5.52% indicating efficient capital cost management
- Diversified revenue across commercial, residential, industrial, and governmental sectors
- Neutral interest coverage at 2.25
- Dividend yield of 3.08% supports income investors
Xcel Energy Inc. Weaknesses
- Zero ROE and ROIC, signaling poor capital returns
- Unavailable WACC limits cost of capital assessment
- Unfavorable liquidity ratios (current and quick ratios at 0)
- Unfavorable asset and fixed asset turnover ratios
Entergy Corporation Weaknesses
- Unfavorable ROE at 6.93% and ROIC at 3.19%
- Elevated debt-to-equity of 1.92 indicates higher leverage risk
- Unfavorable liquidity with current ratio 0.7 and quick ratio 0.41
- High P/E at 30.56 suggests overvaluation risk
- Unfavorable asset and fixed asset turnover ratios
Xcel Energy demonstrates stronger profitability metrics and lower leverage but faces liquidity and capital efficiency challenges. Entergy shows broader revenue diversification but carries higher debt and weaker profitability, affecting financial stability. Both companies exhibit asset turnover weaknesses, implying room for operational improvements.
The Moat Duel: Analyzing Competitive Defensibility
A structural moat is the only fortress shielding long-term profits from relentless competitive erosion. Let’s dissect the moats of two regulated electric utilities:
Xcel Energy Inc.: Diversified Asset Base with Regulatory Anchors
Xcel’s moat stems from its diversified energy mix and regulatory approvals, ensuring margin stability and steady returns. However, its declining ROIC signals rising capital inefficiency heading into 2026.
Entergy Corporation: Nuclear-Centric Cost Advantage
Entergy’s moat relies on its sizable nuclear fleet, providing a cost edge over peers. Yet, its negative ROIC spread and shrinking profitability warn of value destruction ahead.
Verdict: Diversification and Regulation vs. Nuclear Cost Edge
Xcel’s broader asset diversification and regulated footprint offer a structurally wider moat than Entergy’s concentrated nuclear advantage. Despite challenges, Xcel is better equipped to defend market share in an evolving energy landscape.
Which stock offers better returns?
The two stocks show strong annual gains with contrasting recent dynamics: Xcel Energy’s 46% rise slows recently, while Entergy’s 92% surge maintains modest upward momentum.

Trend Comparison
Xcel Energy Inc. gained 46% over the past year, showing a bullish trend with decelerating momentum and a high-low range between 52 and 82. Recent weeks reversed 4.7%, indicating short-term weakness.
Entergy Corporation surged 92% over the past year, also bullish but with decelerating acceleration and higher volatility. It recently gained 4.5%, sustaining a moderate upward slope.
Entergy outperformed Xcel Energy substantially in market returns over the past year, despite both stocks facing deceleration and mixed recent trading behavior.
Target Prices
Analysts present a confident upside for Xcel Energy Inc. and Entergy Corporation, reflecting solid growth prospects in the regulated electric sector.
| Company | Target Low | Target High | Consensus |
|---|---|---|---|
| Xcel Energy Inc. | 81 | 95 | 88 |
| Entergy Corporation | 91 | 112 | 102.75 |
Both stocks trade below their consensus targets, suggesting potential appreciation. Xcel Energy’s current price of 75.9 implies roughly a 16% upside, while Entergy’s 97.96 price points to about a 5% gain.

Don’t Let Luck Decide Your Entry Point
Optimize your entry points with our advanced ProRealTime indicators. You’ll get efficient buy signals with precise price targets for maximum performance. Start outperforming now!
How do institutions grade them?
Xcel Energy Inc. Grades
The following table summarizes recent institutional grades for Xcel Energy Inc.:
| Grading Company | Action | New Grade | Date |
|---|---|---|---|
| Barclays | Maintain | Overweight | 2026-01-15 |
| UBS | Maintain | Neutral | 2025-12-17 |
| Keybanc | Maintain | Overweight | 2025-12-12 |
| JP Morgan | Maintain | Overweight | 2025-12-11 |
| Barclays | Maintain | Overweight | 2025-11-05 |
| Citigroup | Maintain | Buy | 2025-11-03 |
| UBS | Maintain | Neutral | 2025-10-31 |
| Mizuho | Maintain | Outperform | 2025-10-27 |
| Jefferies | Maintain | Buy | 2025-10-16 |
| Keybanc | Maintain | Overweight | 2025-10-15 |
Entergy Corporation Grades
The following table summarizes recent institutional grades for Entergy Corporation:
| Grading Company | Action | New Grade | Date |
|---|---|---|---|
| Wells Fargo | Maintain | Overweight | 2026-01-20 |
| Barclays | Maintain | Overweight | 2026-01-15 |
| Argus Research | Maintain | Buy | 2026-01-06 |
| UBS | Maintain | Buy | 2025-12-17 |
| Keybanc | Maintain | Overweight | 2025-12-12 |
| JP Morgan | Maintain | Overweight | 2025-12-11 |
| Citigroup | Maintain | Neutral | 2025-11-18 |
| Evercore ISI Group | Maintain | In Line | 2025-10-30 |
| Mizuho | Maintain | Outperform | 2025-10-27 |
| Morgan Stanley | Maintain | Equal Weight | 2025-10-22 |
Which company has the best grades?
Both companies receive predominantly positive grades with frequent “Overweight” and “Buy” ratings. Entergy has slightly more “Buy” ratings from top firms, suggesting stronger institutional conviction. This may influence investor sentiment and portfolio positioning differently.
Risks specific to each company
The following categories identify critical pressure points and systemic threats facing both firms in the 2026 market environment:
1. Market & Competition
Xcel Energy Inc. (XEL)
- Operates in multiple states with diverse energy sources, facing moderate competitive pressure in regulated markets.
Entergy Corporation (ETR)
- Serves fewer states but operates significant nuclear capacity, facing niche competition and wholesale market risks.
2. Capital Structure & Debt
Xcel Energy Inc. (XEL)
- Favorable debt-to-equity profile; low leverage reduces financial risk.
Entergy Corporation (ETR)
- Higher debt-to-equity ratio (1.92) signals increased financial risk and pressure on liquidity.
3. Stock Volatility
Xcel Energy Inc. (XEL)
- Low beta (0.476) indicates lower volatility and defensive stock characteristics.
Entergy Corporation (ETR)
- Moderate beta (0.654) implies higher sensitivity to market swings.
4. Regulatory & Legal
Xcel Energy Inc. (XEL)
- Regulatory risks typical of a multi-state utility with renewable mandates increasing capital expenditure.
Entergy Corporation (ETR)
- Nuclear operations expose Entergy to stringent regulatory scrutiny and decommissioning liabilities.
5. Supply Chain & Operations
Xcel Energy Inc. (XEL)
- Diverse energy mix reduces supply risk but requires complex operational management.
Entergy Corporation (ETR)
- Heavy reliance on nuclear and fossil fuels increases operational vulnerability and maintenance costs.
6. ESG & Climate Transition
Xcel Energy Inc. (XEL)
- Invests in renewables and clean energy projects, aligning with climate goals.
Entergy Corporation (ETR)
- Faces challenges transitioning from nuclear and fossil fuels to cleaner sources.
7. Geopolitical Exposure
Xcel Energy Inc. (XEL)
- Primarily domestic U.S. exposure with stable regulatory environment.
Entergy Corporation (ETR)
- Similar U.S. focus but nuclear assets may face additional geopolitical risk from policy shifts.
Which company shows a better risk-adjusted profile?
Xcel Energy’s lower leverage and volatility provide a more stable risk-adjusted profile. Entergy’s significant debt and nuclear regulatory exposure heighten its risk. Xcel’s recent favorable dividend yield (3.83%) and low beta reinforce its defensive stance. Entergy’s Altman Z-score in distress zone signals financial fragility, underscoring my concern.
Final Verdict: Which stock to choose?
Xcel Energy Inc. (XEL) stands out as a resilient cash engine with steady revenue growth and solid net margins. Its ability to generate consistent earnings despite a challenging capital structure is impressive. However, its declining return on invested capital signals a point of vigilance. It suits portfolios aiming for stable income with moderate growth prospects.
Entergy Corporation (ETR) offers a strategic moat through its favorable weighted average cost of capital, underpinning efficient capital use. While it trails XEL in growth consistency, ETR provides a comparatively safer income profile bolstered by higher dividend yield and a better return on equity. This makes it attractive for investors favoring growth at a reasonable price with improved capital discipline.
If you prioritize steady revenue growth and reliable cash flow, XEL is the compelling choice due to its strong income statement performance and market resilience. However, if you seek better capital efficiency and a more defensive dividend play, ETR offers better stability despite its value-erosion challenges. Both require careful monitoring of their leverage and capital returns amid sector headwinds.
Disclaimer: Investment carries a risk of loss of initial capital. The past performance is not a reliable indicator of future results. Be sure to understand risks before making an investment decision.
Go Further
I encourage you to read the complete analyses of Xcel Energy Inc. and Entergy Corporation to enhance your investment decisions: