Entergy Corporation (ETR) and WEC Energy Group, Inc. (WEC) are two prominent players in the regulated electric utilities sector, serving millions of customers across the United States. Both companies emphasize sustainable energy production and innovation within their market territories, making them direct competitors with overlapping opportunities. In this article, I will analyze their strengths and risks to help you determine which company presents the most compelling investment case in 2026.
Table of contents
Companies Overview
I will begin the comparison between Entergy Corporation and WEC Energy Group, Inc. by providing an overview of these two companies and their main differences.
Entergy Corporation Overview
Entergy Corporation operates in the regulated electric industry, focusing on the production and retail distribution of electricity in the United States. It serves about 3M utility customers across Arkansas, Louisiana, Mississippi, and Texas. Its business segments include Utility operations and wholesale commodities, with a diverse power generation portfolio including nuclear, gas, coal, hydro, and solar sources, totaling approximately 26,000 MW of capacity.
WEC Energy Group, Inc. Overview
WEC Energy Group, Inc. provides regulated natural gas, electricity, and renewable energy services, operating through six distinct segments across several states. The company’s energy generation and distribution come from coal, natural gas, oil, hydroelectric, wind, solar, and biomass sources. It maintains an extensive infrastructure, including over 35,000 miles of overhead distribution lines and nearly 51,000 miles of natural gas mains, serving a broad customer base in the U.S.
Key similarities and differences
Both companies operate in the regulated electric industry in the U.S. and generate electricity using a mix of traditional and renewable energy sources. Entergy has a stronger focus on nuclear power and wholesale commodities, while WEC Energy emphasizes natural gas distribution and has a more segmented regional structure. WEC’s infrastructure footprint appears larger in distribution network length, whereas Entergy serves more utility customers and has greater total electric generating capacity.
Income Statement Comparison
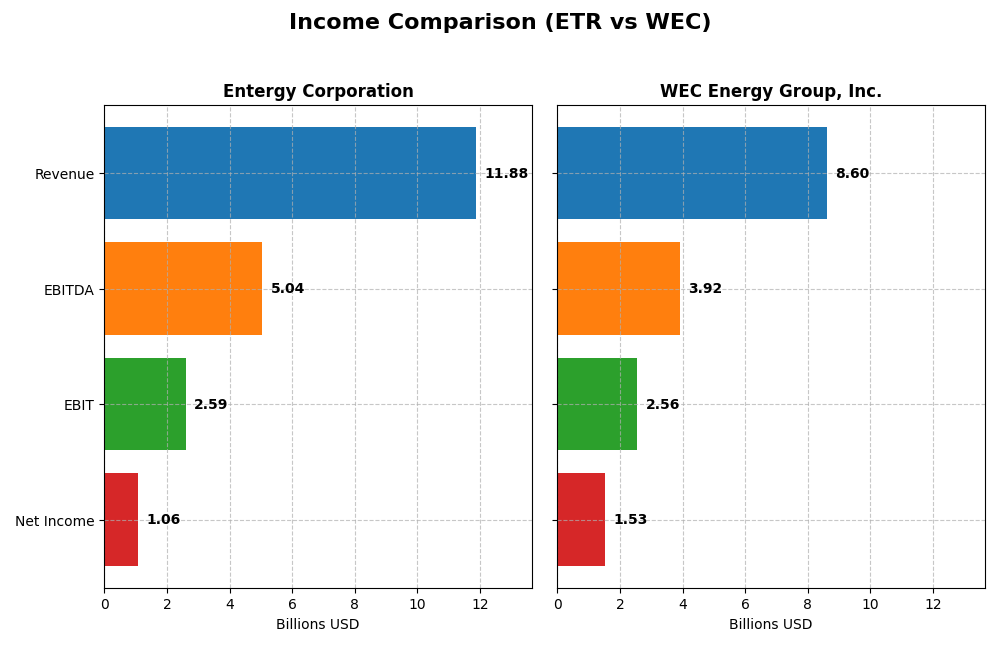
This table presents a side-by-side comparison of key income statement metrics for Entergy Corporation and WEC Energy Group, Inc. for the fiscal year 2024.
| Metric | Entergy Corporation | WEC Energy Group, Inc. |
|---|---|---|
| Market Cap | 41.8B | 33.5B |
| Revenue | 11.9B | 8.6B |
| EBITDA | 5.0B | 3.9B |
| EBIT | 2.6B | 2.6B |
| Net Income | 1.1B | 1.5B |
| EPS | 2.47 | 4.81 |
| Fiscal Year | 2024 | 2024 |
Income Statement Interpretations
Entergy Corporation
Entergy’s revenue showed a 17.46% increase from 2020 to 2024 but declined by 2.2% in 2024 alone. Net income fell by 24.56% over the period, with a sharp 54.07% drop in net margin growth in the latest year. Margins remain strong, with a gross margin of 48.3% and an EBIT margin of 21.83%, though net income and EPS suffered significant declines in 2024.
WEC Energy Group, Inc.
WEC experienced an 18.76% revenue growth overall with a slight 3.3% decline in 2024. Net income increased 27.25% across five years and improved 18.58% last year. Margins are robust, featuring a 44.02% gross margin and a higher EBIT margin of 29.79%. The company showed positive momentum in EPS and net margin growth in the most recent fiscal year.
Which one has the stronger fundamentals?
WEC Energy Group displays stronger fundamentals with consistent growth in net income, EBIT, and EPS, alongside favorable margin improvements. In contrast, Entergy Corporation’s income statement reveals declining net income and EPS despite stable gross and EBIT margins. WEC’s favorable overall income statement evaluation contrasts with Entergy’s unfavorable assessment, reflecting a more positive financial trajectory.
Financial Ratios Comparison
The table below presents a side-by-side comparison of key financial ratios for Entergy Corporation (ETR) and WEC Energy Group, Inc. (WEC) based on their most recent full fiscal year data from 2024.
| Ratios | Entergy Corporation (ETR) | WEC Energy Group, Inc. (WEC) |
|---|---|---|
| ROE | 7.0% | 12.3% |
| ROIC | 3.2% | 4.1% |
| P/E | 30.6 | 19.5 |
| P/B | 2.14 | 2.39 |
| Current Ratio | 0.72 | 0.60 |
| Quick Ratio | 0.43 | 0.43 |
| D/E (Debt-to-Equity) | 1.91 | 1.64 |
| Debt-to-Assets | 44.6% | 42.9% |
| Interest Coverage | 2.30 | 2.64 |
| Asset Turnover | 0.18 | 0.18 |
| Fixed Asset Turnover | 0.25 | 0.25 |
| Payout Ratio | 94.2% | 69.1% |
| Dividend Yield | 3.08% | 3.55% |
Interpretation of the Ratios
Entergy Corporation
Entergy Corporation shows mostly unfavorable financial ratios, including a weak return on equity (7.02%) and return on invested capital (3.2%), with a low current ratio of 0.72 indicating liquidity concerns. Its dividend yield is favorable at 3.08%, suggesting consistent shareholder returns, but investors should monitor the company’s leverage and asset turnover ratios which remain weak.
WEC Energy Group, Inc.
WEC Energy Group exhibits stronger profitability with a favorable net margin of 17.77% and a neutral return on equity of 12.3%. Although the company’s debt-to-equity and liquidity ratios are unfavorable, its dividend yield of 3.55% is slightly better than Entergy’s, supporting a stable income for shareholders. The price-to-earnings ratio is neutral, reflecting balanced valuation metrics.
Which one has the best ratios?
WEC Energy Group holds a slight edge over Entergy Corporation with a higher proportion of favorable ratios, particularly in profitability and dividend yield. However, both companies face challenges in liquidity and asset turnover, with Entergy’s financial health appearing more strained. Overall, WEC’s ratios are slightly unfavorable but comparatively stronger than Entergy’s.
Strategic Positioning
This section compares the strategic positioning of Entergy Corporation and WEC Energy Group, Inc. in terms of market position, key segments, and exposure to technological disruption:
Entergy Corporation
- Operates in regulated electric market with moderate competitive pressure in four southern US states.
- Revenue driven by Utility and Wholesale Commodities segments, serving residential, commercial, and industrial customers.
- Generates power from gas, nuclear, coal, hydro, and solar; exposure to nuclear decommissioning and renewable sources.
WEC Energy Group, Inc.
- Focused on regulated electric and natural gas markets in Midwest states with steady competition.
- Diversified across six segments including electric, natural gas, transmission, and non-utility infrastructure.
- Generates electricity and natural gas from coal, gas, oil, hydro, wind, solar, and biomass energy sources.
Entergy Corporation vs WEC Energy Group, Inc. Positioning
Entergy maintains a more concentrated geographic presence and business focus on electricity generation and wholesale commodities. WEC Energy Group shows a more diversified segment structure including natural gas and energy infrastructure, offering broader exposure across utilities.
Which has the best competitive advantage?
Both companies are currently shedding value as ROIC is below WACC; however, WEC Energy Group shows a growing ROIC trend, indicating improving profitability, whereas Entergy’s ROIC trend is declining, suggesting weakening competitive advantage.
Stock Comparison
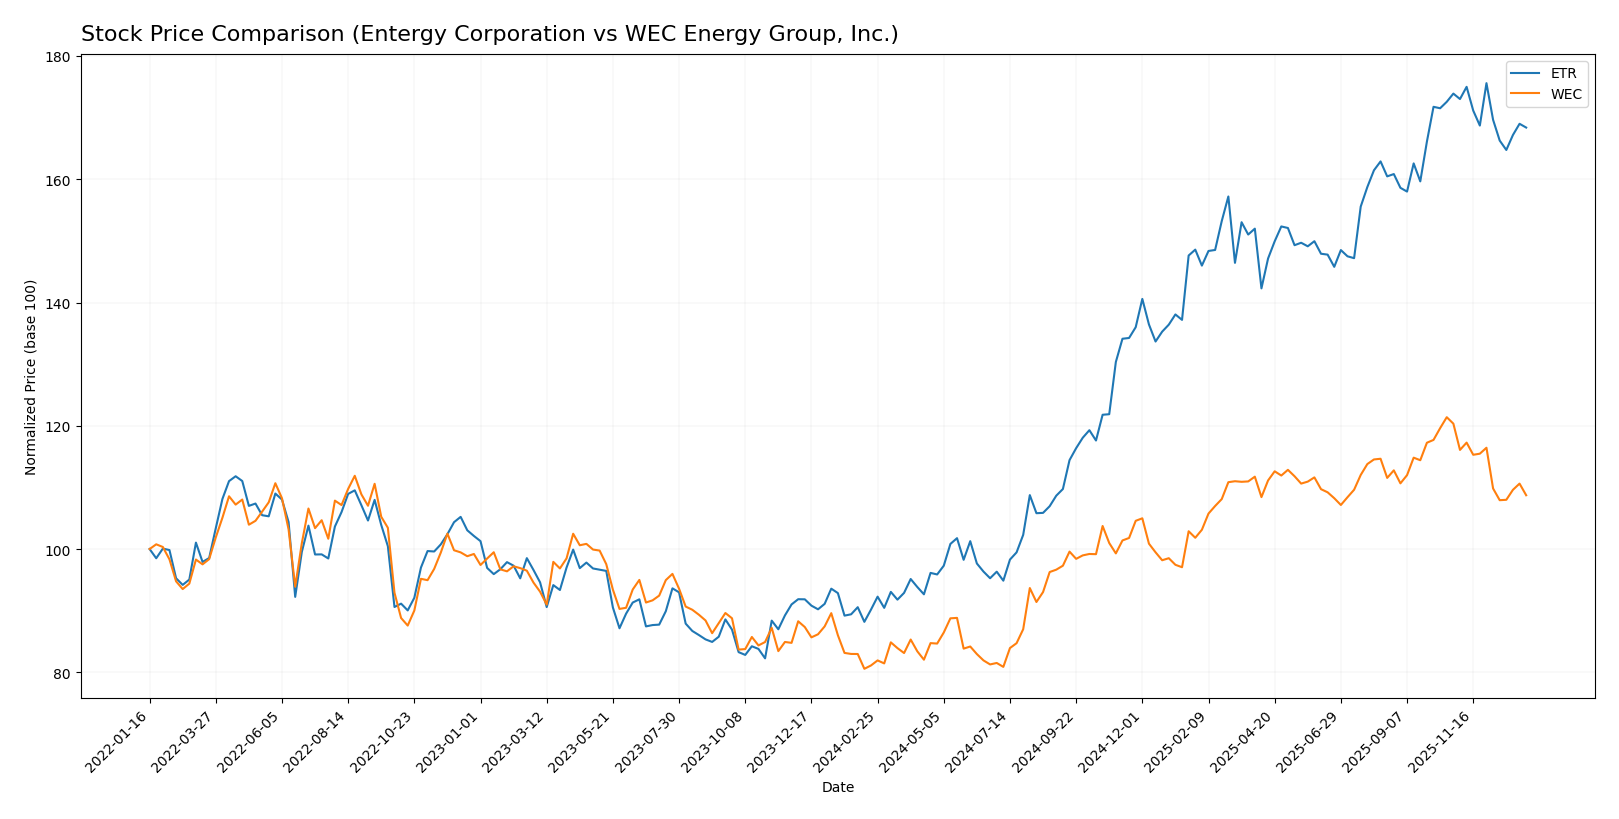
The stock price movements of Entergy Corporation (ETR) and WEC Energy Group, Inc. (WEC) over the past 12 months reveal significant bullish trends with notable deceleration in momentum and recent downward corrections.
Trend Analysis
Entergy Corporation’s stock showed a strong bullish trend over the past year with an 86.74% increase, though momentum decelerated. The price ranged from a low of 50.08 to a high of 97.52, with recent mild bearish movement of -3.17%.
WEC Energy Group’s stock also exhibited a bullish trend with a 34.05% gain over 12 months and deceleration in trend acceleration. Prices moved between 77.85 and 116.84, with a sharper recent decline of -9.65%.
Comparing both, Entergy Corporation delivered the highest market performance with a larger overall price increase despite recent correction, outperforming WEC Energy Group over the analyzed period.
Target Prices
Analysts show a positive outlook with moderate upside potential across these utilities.
| Company | Target High | Target Low | Consensus |
|---|---|---|---|
| Entergy Corporation | 115 | 91 | 103.17 |
| WEC Energy Group, Inc. | 136 | 105 | 122.67 |
The consensus target prices exceed current market prices, indicating analysts expect both stocks to appreciate moderately from present levels. Entergy’s consensus target is about 10.4% above its current price, while WEC Energy Group shows a roughly 17.3% potential increase.
Analyst Opinions Comparison
This section compares analysts’ ratings and grades for Entergy Corporation and WEC Energy Group, Inc.:
Rating Comparison
ETR Rating
- Rating: B-, classified as very favorable by analysts.
- Discounted Cash Flow Score: 1, considered very unfavorable for valuation.
- ROE Score: 4, indicating favorable profitability from shareholders’ equity.
- ROA Score: 3, a moderate indication of asset utilization efficiency.
- Debt To Equity Score: 2, reflecting a moderate level of financial risk.
- Overall Score: 2, evaluated as moderate financial standing.
WEC Rating
- Rating: B-, also classified as very favorable by analysts.
- Discounted Cash Flow Score: 1, also very unfavorable for valuation.
- ROE Score: 4, showing similarly favorable profitability from equity.
- ROA Score: 4, favorable for efficient asset utilization.
- Debt To Equity Score: 2, also indicating moderate financial risk.
- Overall Score: 3, slightly better moderate financial standing.
Which one is the best rated?
Based strictly on the provided data, WEC Energy Group holds a marginally better overall score (3) compared to Entergy’s score (2). Both share the same rating and discounted cash flow concerns, but WEC’s higher ROA score contributes to its slightly stronger rating.
Scores Comparison
The scores comparison between Entergy Corporation and WEC Energy Group, Inc. is as follows:
Entergy Corporation Scores
- Altman Z-Score: 1.04, indicating financial distress zone.
- Piotroski Score: 4, reflecting average financial strength.
WEC Energy Group, Inc. Scores
- Altman Z-Score: 1.14, indicating financial distress zone.
- Piotroski Score: 6, reflecting average financial strength.
Which company has the best scores?
Based strictly on the provided data, WEC Energy Group has slightly better scores with a higher Altman Z-Score and a superior Piotroski Score compared to Entergy Corporation, indicating relatively stronger financial health.
Grades Comparison
The following tables present the recent grades assigned to Entergy Corporation and WEC Energy Group, Inc. by reputable grading companies:
Entergy Corporation Grades
Below are recent grades from established financial institutions for Entergy Corporation:
| Grading Company | Action | New Grade | Date |
|---|---|---|---|
| Argus Research | Maintain | Buy | 2026-01-06 |
| UBS | Maintain | Buy | 2025-12-17 |
| Keybanc | Maintain | Overweight | 2025-12-12 |
| JP Morgan | Maintain | Overweight | 2025-12-11 |
| Citigroup | Maintain | Neutral | 2025-11-18 |
| Evercore ISI Group | Maintain | In Line | 2025-10-30 |
| Mizuho | Maintain | Outperform | 2025-10-27 |
| Morgan Stanley | Maintain | Equal Weight | 2025-10-22 |
| B of A Securities | Maintain | Neutral | 2025-10-16 |
| Keybanc | Maintain | Overweight | 2025-10-15 |
Entergy’s grades consistently reflect positive analyst sentiment, with multiple “Buy” and “Overweight” ratings, indicating a generally favorable outlook.
WEC Energy Group, Inc. Grades
Below are recent grades from established financial institutions for WEC Energy Group, Inc.:
| Grading Company | Action | New Grade | Date |
|---|---|---|---|
| B of A Securities | Maintain | Neutral | 2025-12-31 |
| UBS | Maintain | Neutral | 2025-12-17 |
| Barclays | Maintain | Underweight | 2025-12-16 |
| Keybanc | Maintain | Overweight | 2025-12-12 |
| JP Morgan | Maintain | Neutral | 2025-12-11 |
| Scotiabank | Maintain | Sector Outperform | 2025-10-31 |
| BMO Capital | Maintain | Market Perform | 2025-10-21 |
| Barclays | Maintain | Equal Weight | 2025-10-21 |
| Keybanc | Maintain | Overweight | 2025-10-15 |
| UBS | Maintain | Neutral | 2025-10-10 |
WEC Energy Group’s grade profile shows a mix of “Neutral,” “Overweight,” and some “Underweight” ratings, suggesting a more cautious analyst stance.
Which company has the best grades?
Entergy Corporation holds a stronger grade consensus with a higher number of “Buy” and “Overweight” ratings compared to WEC Energy Group’s more mixed and neutral outlook. This contrast may influence investors seeking more bullish analyst sentiment toward Entergy.
Strengths and Weaknesses
The table below summarizes key strengths and weaknesses of Entergy Corporation (ETR) and WEC Energy Group, Inc. (WEC) based on their diversification, profitability, innovation, global presence, and market share as of 2026.
| Criterion | Entergy Corporation (ETR) | WEC Energy Group, Inc. (WEC) |
|---|---|---|
| Diversification | Moderate diversification across electric and natural gas segments, with residential and industrial customers dominant. | Focused primarily on utility segments in Wisconsin and Illinois, with some non-utility infrastructure. |
| Profitability | Low profitability; ROIC 3.2% below WACC 5.49%, net margin 8.93%, declining ROIC trend, value destroying. | Moderate profitability; ROIC 4.14% below WACC 5.3%, net margin 17.77%, improving ROIC trend, slightly unfavorable. |
| Innovation | Limited recent innovation; traditional utility model with low asset turnover ratios. | Incremental innovation in energy infrastructure; focused on regional efficiency improvements. |
| Global presence | Primarily US regional focus, mostly southern states, limited international exposure. | Strong regional presence in Midwest US, no global operations. |
| Market Share | Significant market share in its service areas but challenged by declining returns and operational inefficiencies. | Solid market share in Wisconsin and Illinois, growing profitability suggests improving competitiveness. |
Key takeaways: Entergy struggles with profitability and operational efficiency, making it a riskier choice. WEC shows better margins and a positive ROIC trend, indicating a more stable investment, though both companies face challenges in innovation and geographic expansion.
Risk Analysis
The table below summarizes key risk factors for Entergy Corporation (ETR) and WEC Energy Group, Inc. (WEC) based on their latest financial and operational data from 2024.
| Metric | Entergy Corporation (ETR) | WEC Energy Group, Inc. (WEC) |
|---|---|---|
| Market Risk | Moderate beta 0.65, stable but sensitive to utility sector shifts | Lower beta 0.57, slightly less volatile, steady regulated market |
| Debt Level | High leverage, Debt/Equity 1.91 (unfavorable) | Elevated debt, Debt/Equity 1.64 (unfavorable) but better coverage |
| Regulatory Risk | High, due to nuclear plant operations and multi-state regulation | High, complex multi-segment state regulation, renewable focus adds complexity |
| Operational Risk | Nuclear plant decommissioning risks, asset turnover low (0.18) | Diverse generation mix, moderate operational efficiency issues |
| Environmental Risk | Exposure to nuclear waste management and fossil fuels | Transitioning towards renewables, moderate environmental liabilities |
| Geopolitical Risk | Regional US exposure, moderate risk from policy changes | Similar regional exposure, regulatory policy impacts possible |
In 2026, the most impactful and likely risks for both companies stem from their high debt levels combined with operational challenges related to asset efficiency and regulatory scrutiny. Entergy faces additional nuclear decommissioning risks, while WEC’s transition to renewables introduces operational complexity. Both show distress signals in bankruptcy risk scores, warranting cautious portfolio allocation.
Which Stock to Choose?
Entergy Corporation (ETR) shows a mixed income evolution with a 17.46% revenue growth over 2020-2024 but declining net income and EPS. Its profitability ratios are mostly unfavorable, with a 7.02% ROE and 3.2% ROIC, and it carries high debt levels. The overall rating is very favorable (B-) despite an unfavorable global ratios opinion.
WEC Energy Group, Inc. (WEC) demonstrates favorable income growth, including 18.76% revenue and 27.25% net income increase over five years. Profitability metrics are better, with a 12.3% ROE and 4.14% ROIC, though debt remains moderate. The company holds a very favorable rating (B-) with a slightly unfavorable global ratios opinion.
From an investment perspective, WEC’s favorable income growth and improving profitability might appeal to growth-focused investors, while ETR’s mixed financial ratios and declining profitability suggest caution for risk-averse profiles. Both companies have similar ratings but differ in income and ratio trends, which could imply varying suitability depending on investor risk tolerance and strategy.
Disclaimer: Investment carries a risk of loss of initial capital. The past performance is not a reliable indicator of future results. Be sure to understand risks before making an investment decision.
Go Further
I encourage you to read the complete analyses of Entergy Corporation and WEC Energy Group, Inc. to enhance your investment decisions: