The Southern Company (SO) and Entergy Corporation (ETR) are two prominent players in the regulated electric utilities sector, each serving millions of customers across different U.S. regions. Both companies emphasize innovation in clean energy and maintain diversified power generation portfolios, including nuclear and renewable sources. Given their market overlap and strategic similarities, this comparison will help investors identify which company offers the most compelling opportunity for a balanced and forward-looking utility investment.
Table of contents
Companies Overview
I will begin the comparison between The Southern Company and Entergy Corporation by providing an overview of these two companies and their main differences.
The Southern Company Overview
The Southern Company, headquartered in Atlanta, Georgia, operates in the regulated electric industry. It engages in electricity generation, transmission, and distribution, serving approximately 8.7 million electric and gas customers. Its diverse energy portfolio includes hydroelectric, fossil fuel, nuclear, solar, wind, and battery storage facilities, alongside natural gas pipeline operations and digital communications services.
Entergy Corporation Overview
Entergy Corporation, based in New Orleans, Louisiana, produces and distributes electricity primarily in Arkansas, Louisiana, Mississippi, and Texas. It operates in Utility and Wholesale Commodities segments, with power generation from gas, nuclear, coal, hydro, and solar sources. Entergy serves around 3 million utility customers and owns power plants with about 26,000 MW of capacity, including 6,000 MW of nuclear power.
Key similarities and differences
Both companies operate in the regulated electric sector in the US, focusing on electricity generation and distribution with diversified energy sources. The Southern Company serves a larger customer base and has extensive natural gas operations, while Entergy has a significant nuclear power capacity and concentrates on fewer states. Employee count and market capitalization also differ, reflecting scale and operational reach.
Income Statement Comparison
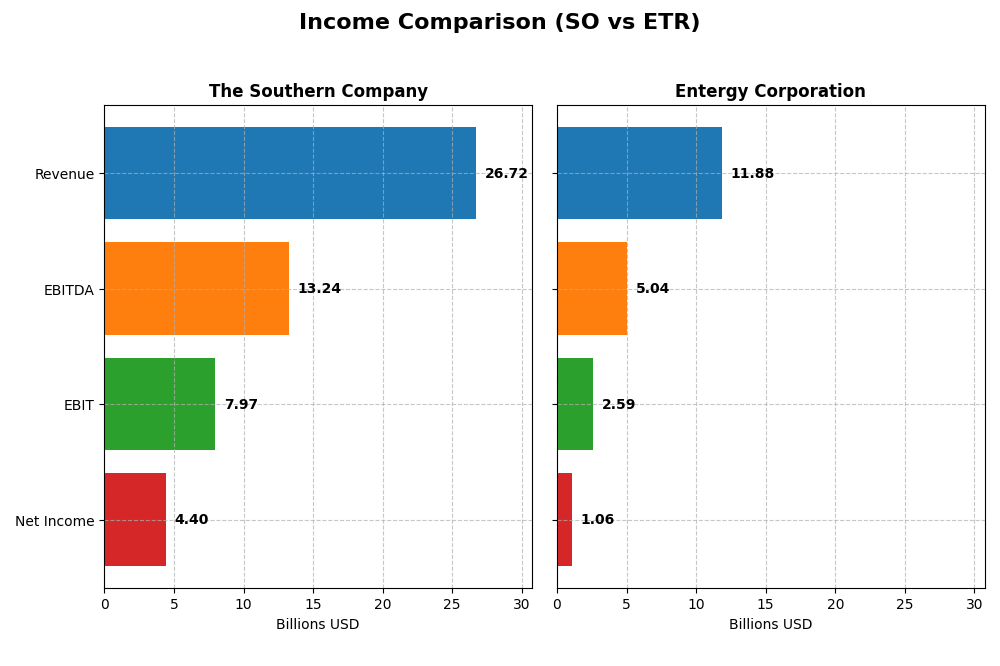
Below is a comparison of key income statement metrics for The Southern Company and Entergy Corporation for the fiscal year 2024.
| Metric | The Southern Company | Entergy Corporation |
|---|---|---|
| Market Cap | 95.7B | 41.8B |
| Revenue | 26.7B | 11.9B |
| EBITDA | 13.2B | 5.0B |
| EBIT | 7.97B | 2.59B |
| Net Income | 4.40B | 1.06B |
| EPS | 4.02 | 2.47 |
| Fiscal Year | 2024 | 2024 |
Income Statement Interpretations
The Southern Company
The Southern Company showed a favorable overall trend from 2020 to 2024, with revenue growing by 31.16% and net income rising 40.43%. Margins remained strong, with a gross margin near 50% and an EBIT margin close to 30%. In 2024, revenue increased 5.83% while net income and EPS growth were favorable, indicating improving profitability and stable margin expansion.
Entergy Corporation
Entergy Corporation experienced mixed results over the same period, with revenue growth of 17.46% but net income declining by 24.56%. Margins have been less consistent, with a gross margin around 48.3% but a lower EBIT margin near 21.8%. The 2024 fiscal year saw a revenue decline of 2.2%, alongside unfavorable net margin and EPS contractions, signaling recent operational challenges.
Which one has the stronger fundamentals?
The Southern Company demonstrates stronger fundamentals, supported by favorable margin profiles, consistent revenue and net income growth, and improving profitability metrics. Entergy faces headwinds with declining net income and weaker margin stability despite reasonable gross margins. Overall, The Southern Company’s income statement reflects a more robust financial performance across the period analyzed.
Financial Ratios Comparison
This table presents the key financial ratios for The Southern Company (SO) and Entergy Corporation (ETR) based on their latest fiscal year data ending December 31, 2024.
| Ratios | The Southern Company (SO) | Entergy Corporation (ETR) |
|---|---|---|
| ROE | 13.3% | 7.0% |
| ROIC | 4.3% | 3.2% |
| P/E | 20.5 | 30.6 |
| P/B | 2.72 | 2.14 |
| Current Ratio | 0.67 | 0.72 |
| Quick Ratio | 0.46 | 0.43 |
| D/E (Debt to Equity) | 2.00 | 1.91 |
| Debt-to-Assets | 45.7% | 44.6% |
| Interest Coverage | 2.58 | 2.30 |
| Asset Turnover | 0.18 | 0.18 |
| Fixed Asset Turnover | 0.25 | 0.25 |
| Payout Ratio | 67.1% | 94.2% |
| Dividend Yield | 3.27% | 3.08% |
Interpretation of the Ratios
The Southern Company
The Southern Company shows a mixed profile with a favorable net margin of 16.47% but an unfavorable return on invested capital of 4.25%. Its liquidity ratios are weak, with a current ratio of 0.67 and quick ratio of 0.46, signaling potential short-term liquidity concerns. The company pays dividends with a favorable 3.27% yield, supported by stable payout ratios and manageable risks.
Entergy Corporation
Entergy Corporation’s ratios appear weaker overall, with an unfavorable return on equity at 7.02% and a high price-to-earnings ratio of 30.56, indicating valuation concerns. Liquidity measures remain below 1, with a current ratio of 0.72 and quick ratio of 0.43, suggesting potential cash flow constraints. The company also pays dividends, offering a 3.08% yield despite mixed coverage and some financial strain indications.
Which one has the best ratios?
Comparing both, The Southern Company has a slightly more favorable ratio profile with a stronger net margin and lower valuation multiples. Entergy’s ratios are generally less supportive, with more unfavorable metrics and weaker returns. Both companies face liquidity challenges, but Southern’s overall financial ratios are marginally better positioned.
Strategic Positioning
This section compares the strategic positioning of The Southern Company and Entergy Corporation across Market position, Key segments, and Exposure to technological disruption:
The Southern Company
- Large market cap (~96B USD) with lower beta; faces regulated electric sector competition
- Diversified business: electricity generation, gas distribution, wholesale gas, renewables
- Owns diverse generation assets including renewables, nuclear, fossil fuels; expanding natural gas pipelines
Entergy Corporation
- Smaller market cap (~42B USD) and moderate beta; operates in regulated electric utilities
- Focus on electricity production and retail, with utility and wholesale commodity segments
- Generates electricity via gas, nuclear, coal, hydro, solar; manages nuclear plant lifecycle
The Southern Company vs Entergy Corporation Positioning
The Southern Company adopts a more diversified approach, spanning gas and electric utilities plus renewables and infrastructure. Entergy concentrates on electric power generation and distribution, emphasizing nuclear and wholesale commodities. Diversification provides Southern with multiple revenue drivers; Entergy’s focus may leverage specialized expertise but offers less segment breadth.
Which has the best competitive advantage?
The Southern Company shows a slightly unfavorable moat with growing ROIC, indicating improving profitability despite value shedding. Entergy exhibits a very unfavorable moat with declining ROIC and deteriorating profitability, reflecting weaker competitive advantage based on MOAT evaluation.
Stock Comparison
Over the past 12 months, The Southern Company and Entergy Corporation have exhibited strong bullish trends with notable deceleration, while recent months reveal a shift toward downward price movements amid seller dominance in trading volumes.
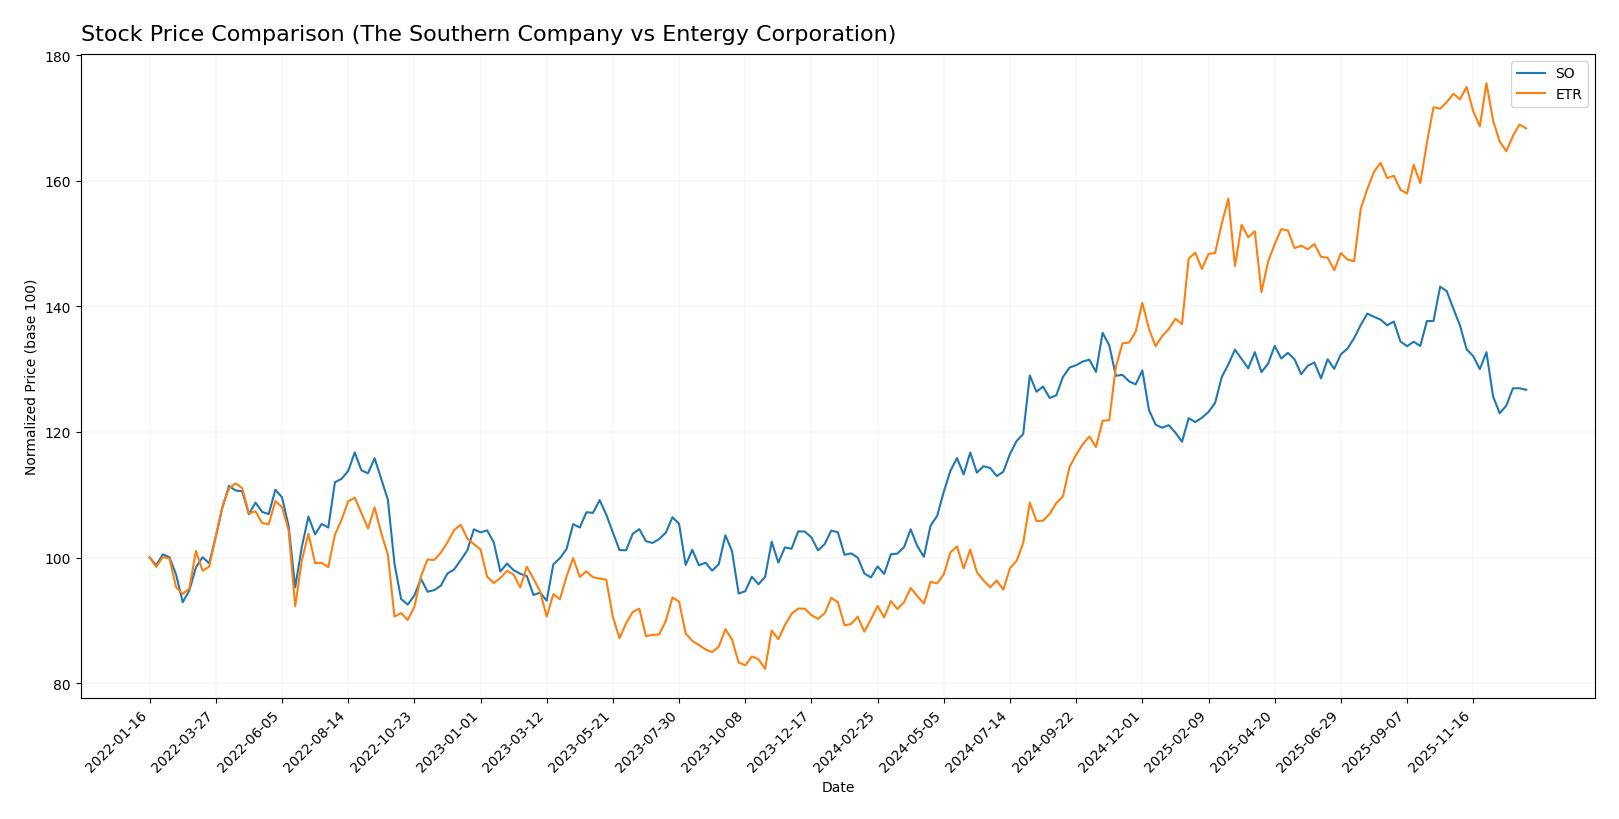
Trend Analysis
The Southern Company’s stock showed a 30.88% gain over the past year, confirming a bullish trend with deceleration. The price ranged from a low of 66.48 to a high of 98.29, with recent weeks reflecting a -9.25% decline.
Entergy Corporation recorded an 86.74% price increase over the past year, also bullish with deceleration. Its price fluctuated between 50.08 and 97.52, but recently fell by -3.17%, indicating short-term weakness.
Comparing both, Entergy Corporation outperformed The Southern Company with the highest annual price appreciation, despite similar recent downward trends and seller-dominated volume conditions.
Target Prices
The current analyst consensus for target prices shows a positive outlook for both The Southern Company and Entergy Corporation.
| Company | Target High | Target Low | Consensus |
|---|---|---|---|
| The Southern Company | 103 | 76 | 93.1 |
| Entergy Corporation | 115 | 91 | 103.17 |
Analysts expect The Southern Company’s stock to rise above its current price of $87.01, with Entergy’s consensus target also notably higher than its current $93.52 price, signaling moderate upside potential.
Analyst Opinions Comparison
This section compares analysts’ ratings and grades for The Southern Company and Entergy Corporation:
Rating Comparison
The Southern Company Rating
- Rating: Both companies have a B- rating, considered Very Favorable.
- Discounted Cash Flow Score: Southern has a moderate score of 3.
- ROE Score: Both companies share a favorable ROE score of 4.
- ROA Score: Both have a moderate ROA score of 3.
- Debt To Equity Score: Southern scores very unfavorably at 1.
- Overall Score: Southern has a moderate overall score of 3.
Entergy Corporation Rating
- Rating: Both companies have a B- rating, considered Very Favorable.
- Discounted Cash Flow Score: Entergy scores very unfavorably at 1.
- ROE Score: Both companies share a favorable ROE score of 4.
- ROA Score: Both have a moderate ROA score of 3.
- Debt To Equity Score: Entergy has a moderate score of 2.
- Overall Score: Entergy has a moderate overall score of 2.
Which one is the best rated?
Both companies share the same B- rating and favorable ROE and moderate ROA scores. Southern has a higher overall and DCF score but a weaker debt-to-equity score compared to Entergy, indicating mixed strengths and weaknesses.
Scores Comparison
Here is a comparison of the Altman Z-Score and Piotroski Score for both companies:
SO Scores
- Altman Z-Score: 0.98, indicating financial distress risk
- Piotroski Score: 6, reflecting average financial strength
ETR Scores
- Altman Z-Score: 1.04, also indicating financial distress risk
- Piotroski Score: 4, reflecting average financial strength
Which company has the best scores?
Both SO and ETR are in the distress zone for Altman Z-Score, with SO slightly lower. SO has a higher Piotroski Score (6 vs. 4), indicating comparatively stronger financial health based on the provided data.
Grades Comparison
Here is a detailed comparison of the recent grades assigned to The Southern Company and Entergy Corporation:
The Southern Company Grades
The following table summarizes recent grades from reputable analysts for The Southern Company:
| Grading Company | Action | New Grade | Date |
|---|---|---|---|
| UBS | Maintain | Neutral | 2025-12-17 |
| JP Morgan | Maintain | Neutral | 2025-12-15 |
| Jefferies | Maintain | Neutral | 2025-12-15 |
| RBC Capital | Maintain | Sector Perform | 2025-12-12 |
| Keybanc | Maintain | Underweight | 2025-12-12 |
| Mizuho | Maintain | Neutral | 2025-12-11 |
| Barclays | Maintain | Equal Weight | 2025-11-20 |
| Jefferies | Downgrade | Neutral | 2025-11-05 |
| Ladenburg Thalmann | Downgrade | Neutral | 2025-10-17 |
| Keybanc | Maintain | Underweight | 2025-10-15 |
The Southern Company’s grades mostly reflect a neutral to cautious stance, with multiple maintains and few downgrades, indicating limited upward momentum in analyst sentiment.
Entergy Corporation Grades
Below is the recent grading data for Entergy Corporation from established financial firms:
| Grading Company | Action | New Grade | Date |
|---|---|---|---|
| Argus Research | Maintain | Buy | 2026-01-06 |
| UBS | Maintain | Buy | 2025-12-17 |
| Keybanc | Maintain | Overweight | 2025-12-12 |
| JP Morgan | Maintain | Overweight | 2025-12-11 |
| Citigroup | Maintain | Neutral | 2025-11-18 |
| Evercore ISI Group | Maintain | In Line | 2025-10-30 |
| Mizuho | Maintain | Outperform | 2025-10-27 |
| Morgan Stanley | Maintain | Equal Weight | 2025-10-22 |
| B of A Securities | Maintain | Neutral | 2025-10-16 |
| Keybanc | Maintain | Overweight | 2025-10-15 |
Entergy Corporation’s grades show a stronger bias toward buying and overweight ratings, with sustained positive outlooks from multiple analysts over recent months.
Which company has the best grades?
Entergy Corporation has consistently received better grades, with multiple buy and overweight recommendations compared to The Southern Company’s predominantly neutral and underweight ratings. This difference reflects a more optimistic analyst sentiment for Entergy, which may influence investor perception of growth potential and risk differently between the two companies.
Strengths and Weaknesses
Here is a comparative overview of the strengths and weaknesses of The Southern Company (SO) and Entergy Corporation (ETR) based on their latest financial and operational data.
| Criterion | The Southern Company (SO) | Entergy Corporation (ETR) |
|---|---|---|
| Diversification | Moderate diversification with strong gas and electric segments; Southern Company Gas generates $4.46B revenue | Moderate diversification focused on electricity and natural gas with $4.51B residential sales |
| Profitability | Net margin of 16.47% (favorable); ROIC at 4.25% (unfavorable) but improving | Net margin at 8.93% (neutral); ROIC at 3.2% (unfavorable) with declining trend |
| Innovation | Limited innovation signals; traditional utility operations dominate | Limited innovation focus; steady utility operations but struggling with ROIC decline |
| Global presence | Primarily U.S.-focused utility operations with no significant international exposure | Primarily U.S.-focused with no notable international operations |
| Market Share | Strong position in gas distribution and electric utilities in the Southeast U.S. | Significant presence in electric and natural gas markets, but less dominant than SO |
Key takeaways: Both companies face challenges with value creation as indicated by unfavorable ROIC versus WACC. Southern Company shows a positive ROIC trend, suggesting improving efficiency, while Entergy struggles with declining profitability. Both have solid U.S. regional market positions but limited global reach. Caution is advised given their financial ratios and profitability trends.
Risk Analysis
Below is a comparative risk overview for The Southern Company (SO) and Entergy Corporation (ETR) based on the most recent 2024 data to help investors assess potential vulnerabilities.
| Metric | The Southern Company (SO) | Entergy Corporation (ETR) |
|---|---|---|
| Market Risk | Low beta (0.447) indicates lower volatility | Moderate beta (0.648) suggests moderate volatility |
| Debt Level | High debt-to-equity (2.0), unfavorable leverage | High debt-to-equity (1.91), unfavorable leverage |
| Regulatory Risk | Moderate, given regulated electric sector exposure | Moderate, similar regulated utilities environment |
| Operational Risk | Diverse generation assets; moderate operational complexity | Significant nuclear exposure adds operational risk |
| Environmental Risk | Transition to renewables ongoing; fossil fuel assets remain | Nuclear plant decommissioning heightens environmental focus |
| Geopolitical Risk | Low, primarily US operations | Low, US-centric operations |
The most impactful risks for both companies are their high debt levels and operational challenges related to asset diversity and nuclear facilities. Both remain vulnerable to regulatory shifts in the energy sector and environmental policies, with Southern’s fossil fuel reliance and Entergy’s nuclear decommissioning being key concerns.
Which Stock to Choose?
The Southern Company (SO) shows a favorable income evolution with 31.16% revenue growth over five years and a 40.43% net income rise. Its financial ratios are slightly unfavorable overall, with a solid net margin of 16.47% but weaknesses in liquidity and asset turnover. SO’s profitability is moderate, with a 13.25% ROE and a slightly unfavorable moat due to ROIC below WACC despite growing ROIC. Its rating is very favorable (B-), though debt metrics are a concern.
Entergy Corporation (ETR) exhibits an unfavorable income trend, with a 2.2% revenue decline last year and a 24.56% net income decrease over five years. Financial ratios are generally unfavorable, including a low 7.02% ROE and weak profitability metrics. The company’s moat is very unfavorable, with ROIC well below WACC and declining profitability. ETR holds a very favorable rating (B-), but with moderate concerns on debt and valuation scores.
Investors seeking growth might find SO more appealing, given its positive income trajectory and improving profitability despite some financial ratio weaknesses. Conversely, those with a higher risk tolerance aware of ETR’s declining income and profitability might view its valuation and recent bullish price trend as potential opportunities. The choice could depend on whether the investor prioritizes income stability and improving returns or is willing to consider companies with more financial challenges.
Disclaimer: Investment carries a risk of loss of initial capital. The past performance is not a reliable indicator of future results. Be sure to understand risks before making an investment decision.
Go Further
I encourage you to read the complete analyses of The Southern Company and Entergy Corporation to enhance your investment decisions: