Entergy Corporation (ETR) and Public Service Enterprise Group Incorporated (PEG) are two leading players in the regulated electric utility sector, serving distinct yet overlapping U.S. regions with diversified energy portfolios. Both companies emphasize innovation through renewable energy integration and infrastructure modernization. This comparison will analyze their market positions, growth strategies, and risk factors to help you decide which utility stock might be the more compelling addition to your investment portfolio.
Table of contents
Companies Overview
I will begin the comparison between Entergy Corporation and Public Service Enterprise Group Incorporated by providing an overview of these two companies and their main differences.
Entergy Overview
Entergy Corporation operates in the regulated electric industry, focusing on the production and retail distribution of electricity in the US. It serves around 3M utility customers across Arkansas, Louisiana, Mississippi, and Texas. With approximately 26,000 MW of electric generating capacity, including 6,000 MW from nuclear power, Entergy generates electricity from gas, nuclear, coal, hydro, and solar sources, operating both utility and wholesale commodity segments.
Public Service Enterprise Group Overview
Public Service Enterprise Group Incorporated is an energy company primarily operating in the Northeastern and Mid-Atlantic US regions. It serves residential, commercial, and industrial customers through its PSE&G and PSEG Power segments. The company manages extensive electric transmission and distribution infrastructure, including 25,000 circuit miles and 18,000 miles of gas mains, alongside investments in solar projects and energy efficiency programs.
Key similarities and differences
Both companies operate within the regulated electric utilities sector in the US, providing electricity and natural gas distribution services. Entergy’s operations are concentrated in southern states, while Public Service Enterprise Group focuses on the Northeast and Mid-Atlantic. Entergy emphasizes nuclear and diverse generation sources, whereas Public Service Enterprise Group has a strong infrastructure network and additional focus on gas services and solar investments. Their business models balance regulated utility operations with energy generation and service diversification.
Income Statement Comparison
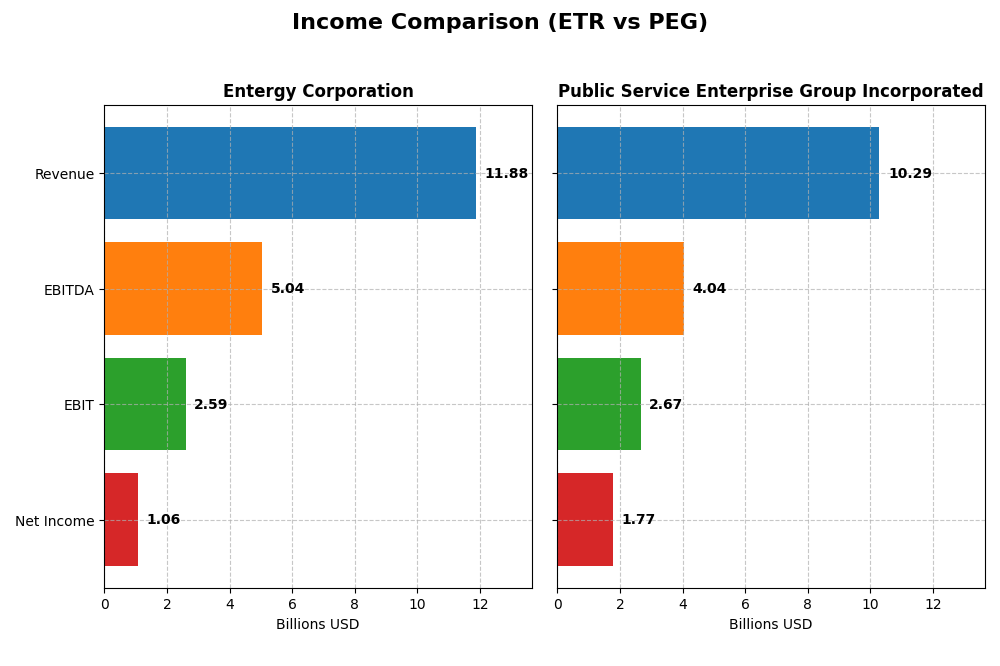
The table below provides a side-by-side comparison of key income statement metrics for Entergy Corporation and Public Service Enterprise Group Incorporated for the fiscal year 2024.
| Metric | Entergy Corporation (ETR) | Public Service Enterprise Group (PEG) |
|---|---|---|
| Market Cap | 41.8B | 39.3B |
| Revenue | 11.9B | 10.3B |
| EBITDA | 5.04B | 4.04B |
| EBIT | 2.59B | 2.67B |
| Net Income | 1.06B | 1.77B |
| EPS | 2.47 | 3.56 |
| Fiscal Year | 2024 | 2024 |
Income Statement Interpretations
Entergy Corporation
Entergy’s revenue grew 17.46% overall from 2020 to 2024 but declined 2.2% in the latest year, with net income falling 24.56% over the period and sharply down 55.86% recently. Margins show mixed trends: gross margin held favorably at 48.3%, EBIT margin at 21.83%, and net margin at 8.93%, but net margin contracted significantly last year. The 2024 performance reflects slowed revenue and earnings growth despite stable gross profitability.
Public Service Enterprise Group Incorporated
PSEG’s revenue edged up 7.15% across 2020-2024 but decreased 8.43% in 2024 alone, while net income fell 6.98% overall and dropped nearly 31% last year. Margins remain favorable, with a 34.41% gross margin, 25.91% EBIT margin, and 17.22% net margin, though all contracted in the latest year. The 2024 results indicate deteriorating profitability amid declining sales and earnings.
Which one has the stronger fundamentals?
Both companies face unfavorable overall income statement trends, with Entergy showing higher revenue growth but larger net income declines. Entergy maintains stronger gross and EBIT margins, while PSEG has a better net margin but more pronounced recent earnings deterioration. Each exhibits notable margin contraction and earnings volatility, complicating assessment of superior fundamentals based solely on income statement metrics.
Financial Ratios Comparison
The following table compares key financial ratios for Entergy Corporation (ETR) and Public Service Enterprise Group Incorporated (PEG) based on the most recent fiscal year 2024 data.
| Ratios | Entergy Corporation (ETR) | Public Service Enterprise Group (PEG) |
|---|---|---|
| ROE | 7.02% | 10.99% |
| ROIC | 3.20% | 4.40% |
| P/E | 30.56 | 23.74 |
| P/B | 2.14 | 2.61 |
| Current Ratio | 0.72 | 0.65 |
| Quick Ratio | 0.43 | 0.48 |
| D/E | 1.91 | 1.42 |
| Debt-to-Assets | 44.63% | 41.89% |
| Interest Coverage | 2.30 | 2.80 |
| Asset Turnover | 0.18 | 0.19 |
| Fixed Asset Turnover | 0.25 | 0.26 |
| Payout Ratio | 94.23% | 67.49% |
| Dividend Yield | 3.08% | 2.84% |
Interpretation of the Ratios
Entergy Corporation
Entergy Corporation shows mostly unfavorable financial ratios, including weak return on equity (7.02%) and return on invested capital (3.2%), alongside a low current ratio (0.72), indicating liquidity concerns. The company’s dividend yield is favorable at 3.08%, but caution is warranted due to a high payout relative to free cash flow and significant leverage with a debt-to-equity ratio of 1.91.
Public Service Enterprise Group Incorporated
Public Service Enterprise Group presents a mixed ratio profile with a favorable net margin of 17.22% and a dividend yield of 2.84%. While return on equity is neutral at 11% and debt levels remain high, they are somewhat lower than Entergy’s. Liquidity ratios are below 1, reflecting potential short-term constraints, yet interest coverage remains neutral at 3.17, mitigating some risk.
Which one has the best ratios?
Comparing both, Public Service Enterprise Group holds a slightly more favorable ratio profile with better profitability and more balanced leverage. Entergy’s ratios are predominantly unfavorable, particularly in returns and liquidity. However, both companies face challenges in liquidity and asset turnover, suggesting cautious analysis is needed before investment decisions.
Strategic Positioning
This section compares the strategic positioning of Entergy Corporation and Public Service Enterprise Group, focusing on market position, key segments, and exposure to technological disruption:
Entergy Corporation
- Operates in regulated electric market with moderate competitive pressure in southern US states.
- Key segments include Utility and Entergy Wholesale Commodities with diversified energy sources including nuclear, gas, coal, hydro, and solar.
- Exposure to disruption through ownership and operation of nuclear and non-nuclear power plants, plus renewable energy sources.
Public Service Enterprise Group
- Operates in regulated electric market serving Northeastern and Mid-Atlantic US regions.
- Key segments are PSE&G and PSEG Power focusing on electricity and gas distribution, transmission, and solar investments.
- Exposure includes investments in solar generation projects and energy efficiency programs alongside traditional gas and electricity services.
Entergy Corporation vs Public Service Enterprise Group Positioning
Entergy shows a diversified energy portfolio with both utility retail and wholesale nuclear power segments, while PEG concentrates on regulated electricity and gas distribution with solar investments. Entergy’s geographic focus is southern states, PEG’s is northeastern and mid-Atlantic regions, each with distinct operational scopes.
Which has the best competitive advantage?
Both companies are shedding value with ROIC below WACC; Entergy has a very unfavorable declining profitability, while PEG shows slightly unfavorable status but with a growing ROIC trend, indicating improving efficiency despite current value destruction.
Stock Comparison
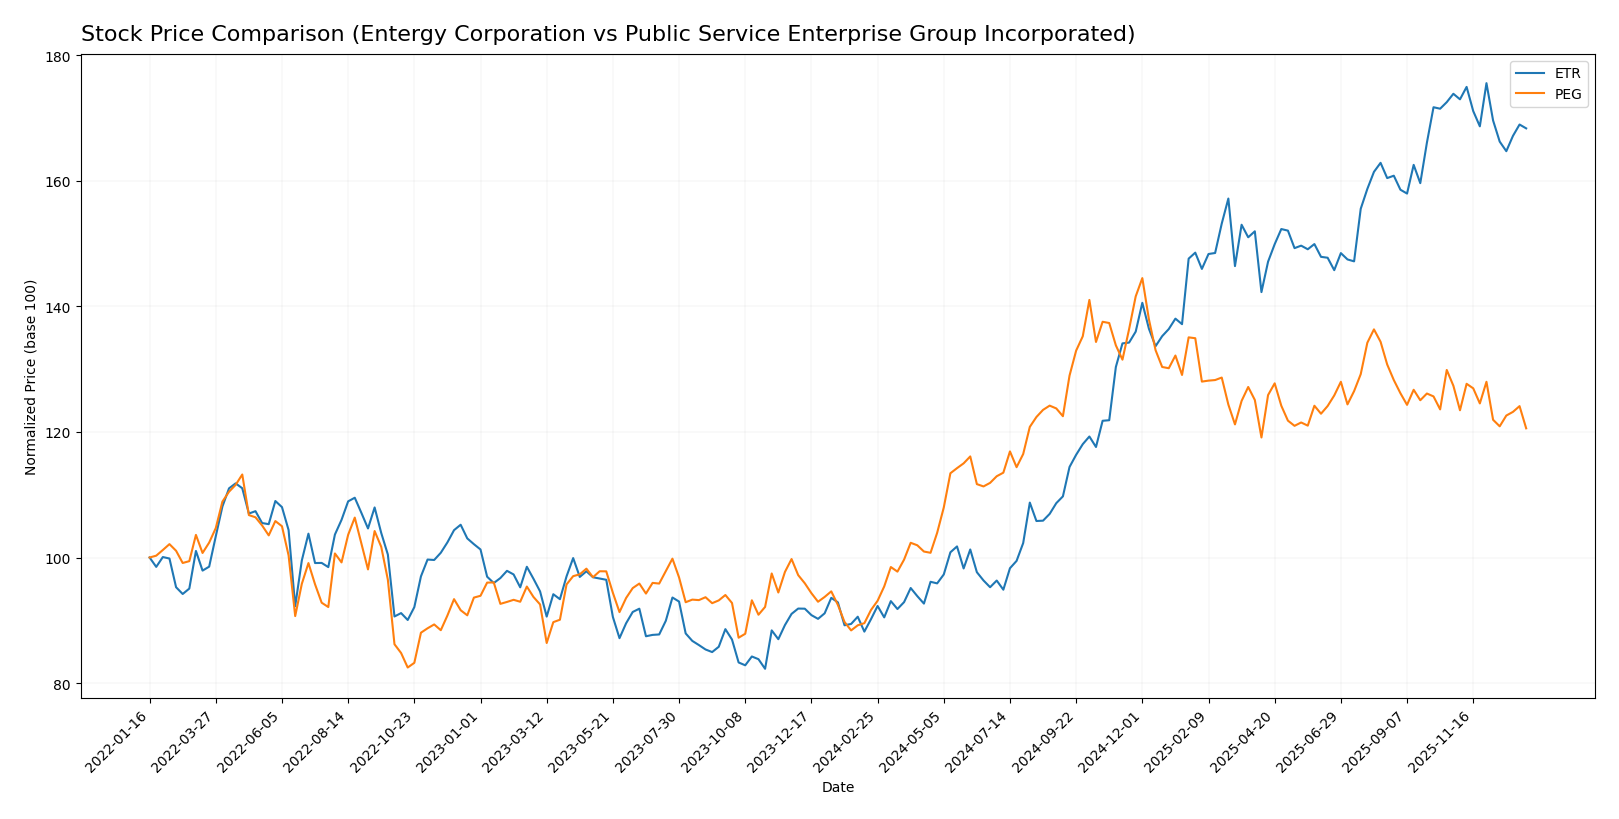
The stock price chart illustrates pronounced bullish trends for both Entergy Corporation and Public Service Enterprise Group Incorporated over the past 12 months, with notable deceleration and recent downward corrections in trading dynamics.
Trend Analysis
Entergy Corporation’s stock showed a strong bullish trend over the past year with an 86.74% price increase, though momentum has decelerated and recent weeks saw a mild bearish correction of -3.17%. Volatility remains elevated with a 15.22 standard deviation.
Public Service Enterprise Group Incorporated also experienced a bullish trend with a 31.59% gain over the past year, accompanied by deceleration and a recent price decline of -5.33%. Its volatility is lower at a 7.17 standard deviation.
Comparing both, Entergy Corporation delivered the highest market performance with a substantially larger price increase over the 12-month period despite recent weakness in both stocks.
Target Prices
The current analyst consensus indicates moderate upside potential for these utilities stocks.
| Company | Target High | Target Low | Consensus |
|---|---|---|---|
| Entergy Corporation | 115 | 91 | 103.17 |
| Public Service Enterprise Group | 98 | 83 | 89 |
Analysts expect Entergy’s price to rise moderately above its current 93.52 USD, while Public Service Enterprise Group shows potential gains from 78.68 USD, reflecting generally positive market sentiment.
Analyst Opinions Comparison
This section compares analysts’ ratings and grades for Entergy Corporation and Public Service Enterprise Group Incorporated:
Rating Comparison
Entergy Corporation Rating
- Rating: B-; status: Very Favorable
- Discounted Cash Flow Score: 1 (Very Unfavorable)
- ROE Score: 4 (Favorable)
- ROA Score: 3 (Moderate)
- Debt To Equity Score: 2 (Moderate)
- Overall Score: 2 (Moderate)
Public Service Enterprise Group Incorporated Rating
- Rating: B-; status: Very Favorable
- Discounted Cash Flow Score: 1 (Very Unfavorable)
- ROE Score: 4 (Favorable)
- ROA Score: 4 (Favorable)
- Debt To Equity Score: 2 (Moderate)
- Overall Score: 3 (Moderate)
Which one is the best rated?
Both companies share the same B- rating with very favorable status. PEG has a slightly higher overall score and better ROA score, indicating a marginally stronger financial profile based on these metrics.
Scores Comparison
Here is a comparison of Entergy Corporation (ETR) and Public Service Enterprise Group Incorporated (PEG) based on their Altman Z-Score and Piotroski Score:
ETR Scores
- Altman Z-Score: 1.04, indicating financial distress zone.
- Piotroski Score: 4, representing average financial strength.
PEG Scores
- Altman Z-Score: 1.32, also in the financial distress zone.
- Piotroski Score: 7, indicating strong financial strength.
Which company has the best scores?
PEG has higher scores overall, with a slightly better Altman Z-Score and a notably stronger Piotroski Score compared to ETR, which shows weaker financial health in both metrics.
Grades Comparison
Here is the grades comparison for Entergy Corporation and Public Service Enterprise Group Incorporated:
Entergy Corporation Grades
The following table summarizes recent grades from reputable grading companies for Entergy Corporation:
| Grading Company | Action | New Grade | Date |
|---|---|---|---|
| Argus Research | Maintain | Buy | 2026-01-06 |
| UBS | Maintain | Buy | 2025-12-17 |
| Keybanc | Maintain | Overweight | 2025-12-12 |
| JP Morgan | Maintain | Overweight | 2025-12-11 |
| Citigroup | Maintain | Neutral | 2025-11-18 |
| Evercore ISI Group | Maintain | In Line | 2025-10-30 |
| Mizuho | Maintain | Outperform | 2025-10-27 |
| Morgan Stanley | Maintain | Equal Weight | 2025-10-22 |
| B of A Securities | Maintain | Neutral | 2025-10-16 |
| Keybanc | Maintain | Overweight | 2025-10-15 |
Overall, Entergy Corporation’s grades show a consistent pattern of Buy and Overweight ratings, with no downgrades or negative actions noted.
Public Service Enterprise Group Incorporated Grades
The following table summarizes recent grades from reputable grading companies for Public Service Enterprise Group Incorporated:
| Grading Company | Action | New Grade | Date |
|---|---|---|---|
| Ladenburg Thalmann | Upgrade | Buy | 2026-01-07 |
| UBS | Maintain | Buy | 2025-12-17 |
| JP Morgan | Maintain | Overweight | 2025-12-12 |
| Jefferies | Upgrade | Buy | 2025-11-06 |
| TD Cowen | Maintain | Buy | 2025-11-05 |
| BMO Capital | Maintain | Market Perform | 2025-11-04 |
| Barclays | Maintain | Equal Weight | 2025-10-21 |
| BMO Capital | Maintain | Market Perform | 2025-10-20 |
| Morgan Stanley | Maintain | Overweight | 2025-09-25 |
| BMO Capital | Maintain | Market Perform | 2025-08-06 |
Public Service Enterprise Group shows a solid trend with multiple Buy upgrades and a majority of Buy and Overweight grades, alongside some Market Perform ratings.
Which company has the best grades?
Both Entergy Corporation and Public Service Enterprise Group have a consensus “Buy” rating, but Public Service Enterprise Group has more recent upgrades to Buy from Neutral and Hold, indicating slightly stronger momentum. This may suggest more positive analyst sentiment, potentially impacting investor confidence and valuation expectations.
Strengths and Weaknesses
Below is a comparison of Entergy Corporation (ETR) and Public Service Enterprise Group Incorporated (PEG) based on key investment criteria:
| Criterion | Entergy Corporation (ETR) | Public Service Enterprise Group (PEG) |
|---|---|---|
| Diversification | Moderate: Primarily utility-focused with electricity and natural gas segments; revenue well distributed across commercial, industrial, and residential sectors (approx. $4.5B residential, $3.2B industrial). | Moderate: Focused on electric and gas utilities with multiple contract revenues; strong in public service electric and gas ($4B+), gas distribution, and transmission segments. |
| Profitability | Weak: ROIC 3.2% below WACC 5.49%, declining trend; net margin modest at 8.9%, unfavorable ROE (7.0%) and several unfavorable liquidity and efficiency ratios. | Moderate: ROIC 4.4% also below WACC 5.37%, but with growing ROIC trend; strong net margin (17.2%), neutral ROE (11.0%), and better overall ratio profile with fewer unfavorable markers. |
| Innovation | Limited evidence of innovation; core utility services dominate with little diversification into new technologies or markets. | Similar utility focus with some contract revenues diversification; no strong indication of innovation leadership but steady operational improvements reflected in ROIC growth. |
| Global presence | Primarily U.S.-focused utility operations, limiting exposure to international markets. | Also primarily U.S.-based, focused on regional electric and gas utilities, lacking significant global diversification. |
| Market Share | Strong regional player with significant utility customer base in U.S. South and Midwest regions. | Strong presence in New Jersey and surrounding areas, with substantial market share in electric and gas distribution sectors. |
Key takeaways: Both companies operate mainly in U.S. utilities with moderate diversification and strong regional market shares. PEG shows better profitability trends and financial health despite still facing challenges, while ETR struggles with declining returns and less favorable financial ratios. Investors should weigh PEG’s improving profitability and stable business model against ETR’s value erosion risks.
Risk Analysis
Below is a comparison of key risk factors for Entergy Corporation (ETR) and Public Service Enterprise Group Incorporated (PEG) as of 2024.
| Metric | Entergy Corporation (ETR) | Public Service Enterprise Group (PEG) |
|---|---|---|
| Market Risk | Beta 0.65, moderate volatility | Beta 0.61, slightly lower volatility |
| Debt level | High debt-to-equity 1.91 (unfavorable) | High debt-to-equity 1.42 (unfavorable) |
| Regulatory Risk | Significant given nuclear and gas operations | Significant, with heavy utility regulation in Northeastern US |
| Operational Risk | Nuclear plant decommissioning and multi-source generation | Extensive transmission and distribution infrastructure complexity |
| Environmental Risk | Exposure to fossil fuels and nuclear waste management | Investments in solar and energy efficiency mitigate risks |
| Geopolitical Risk | Localized to southern US states; moderate | Focused on Northeastern US, with stable political environment |
Entergy faces notable market and operational risks tied to its nuclear assets and higher leverage, with an Altman Z-Score in distress zone indicating financial stress. PEG, while also leveraged and in distress zone, shows stronger financial health metrics and more investment in renewables, somewhat mitigating environmental and regulatory risks. Both companies exhibit moderate market risk; caution is advised, especially considering Entergy’s lower liquidity ratios and weaker profitability indicators.
Which Stock to Choose?
Entergy Corporation (ETR) shows mixed financial signals with a declining income trend and unfavorable profitability ratios like ROE at 7.02% and ROIC at 3.2%, below its WACC of 5.49%, indicating value destruction. Its rating is very favorable (B-), but with mostly unfavorable ratios and a distress-level Altman Z-Score.
Public Service Enterprise Group Incorporated (PEG) similarly faces income declines but maintains stronger profitability metrics, including a 17.22% net margin and ROE of 11.0%. Although its ROIC is slightly below WACC, it trends upward. PEG holds a very favorable rating (B-) with a more balanced ratio profile and a stronger Piotroski score despite a distress-zone Altman Z-Score.
For investors prioritizing growth potential, PEG’s improving profitability and stronger financial scores may appear more attractive, while those focused on dividend yield or value might interpret ETR’s current valuation and rating as presenting different considerations. Both stocks show risks tied to profitability and financial health trends.
Disclaimer: Investment carries a risk of loss of initial capital. The past performance is not a reliable indicator of future results. Be sure to understand risks before making an investment decision.
Go Further
I encourage you to read the complete analyses of Entergy Corporation and Public Service Enterprise Group Incorporated to enhance your investment decisions: