Entergy Corporation and PPL Corporation are two prominent players in the regulated electric utility sector, each with a strong presence in the U.S. energy market. Both companies focus on electricity generation and distribution, leveraging diverse energy sources and innovation strategies to meet growing demand. This comparison explores their market positioning, operational strengths, and growth potential to help you decide which stock could be the most compelling addition to your investment portfolio.

Table of contents
Companies Overview
I will begin the comparison between Entergy Corporation and PPL Corporation by providing an overview of these two companies and their main differences.
Entergy Corporation Overview
Entergy Corporation operates as a regulated electric utility in the United States, focusing on electricity production and retail distribution. The company’s Utility segment serves about 3M customers across Arkansas, Louisiana, Mississippi, and Texas, while its Wholesale Commodities segment owns and manages nuclear and non-nuclear power plants. Entergy’s generation capacity totals approximately 26,000 MW, including 6,000 MW from nuclear sources. Founded in 1913, it is headquartered in New Orleans, Louisiana.
PPL Corporation Overview
PPL Corporation is a utility holding company delivering electricity and natural gas in the US and the UK. It operates through Kentucky Regulated and Pennsylvania Regulated segments, serving over 2.7M customers in those regions. PPL generates power from coal, gas, hydro, and solar sources, and wholesales electricity to municipalities. Established in 1920, the company is headquartered in Allentown, Pennsylvania, with a focus on regulated utility services.
Key similarities and differences
Both Entergy and PPL operate in the regulated electric utility industry, providing electricity generation and distribution with additional natural gas services. Entergy has a broader geographic footprint and larger generation capacity, including significant nuclear power assets, while PPL has a notable presence in both the US and UK markets with a focus on regulated regional segments. Workforce size and market capitalization also differ, reflecting their scale and operational scope.
Income Statement Comparison
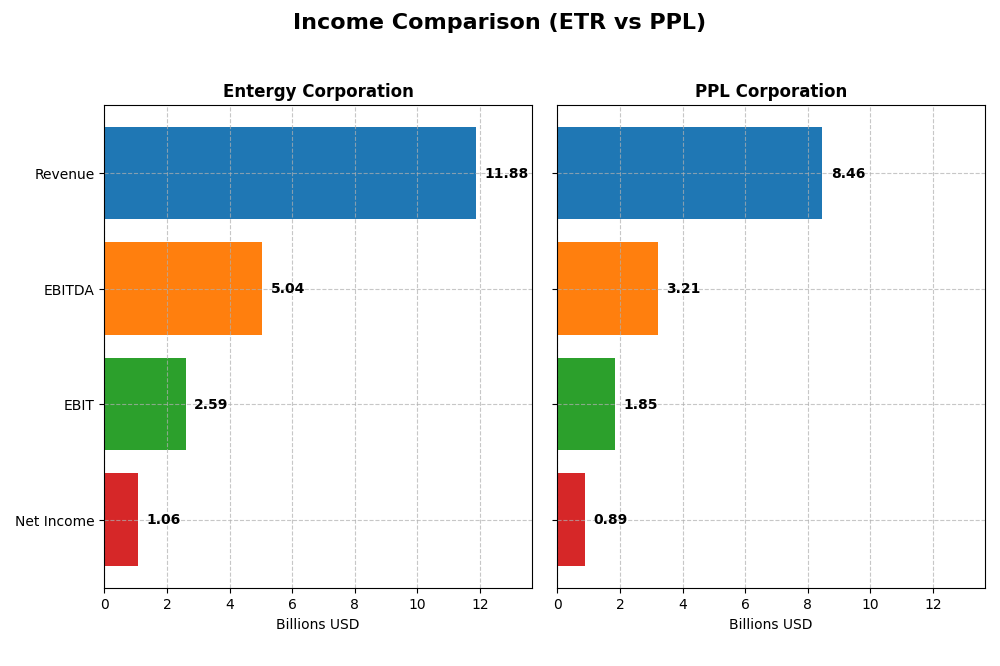
Below is a side-by-side comparison of key income statement metrics for Entergy Corporation and PPL Corporation for the fiscal year 2024.
| Metric | Entergy Corporation | PPL Corporation |
|---|---|---|
| Market Cap | 41.8B | 25.6B |
| Revenue | 11.9B | 8.5B |
| EBITDA | 5.0B | 3.2B |
| EBIT | 2.6B | 1.9B |
| Net Income | 1.1B | 888M |
| EPS | 2.47 | 1.20 |
| Fiscal Year | 2024 | 2024 |
Income Statement Interpretations
Entergy Corporation
Entergy’s revenue showed a 17.46% increase over 2020-2024 but declined slightly by 2.2% in 2024. Net income decreased overall by 24.56%, with a sharp 54.07% drop in net margin last year. Margins remain favorable for gross (48.3%) and EBIT (21.83%), but net margin fell to 8.93%. The 2024 decline highlights pressure on profitability despite stable operational efficiency.
PPL Corporation
PPL’s revenue grew steadily by 54.59% across the period and 1.8% in 2024, with net income declining 39.55% overall but showing a 17.87% net margin improvement last year to 10.49%. EBIT margin is similarly strong at 21.91%. Recent gains in EBIT and EPS, up 16.6% and 20.0% respectively, reflect enhanced operational leverage and margin recovery in 2024.
Which one has the stronger fundamentals?
PPL demonstrates stronger recent income statement fundamentals, with favorable growth in EBIT, net margin, and EPS in 2024, alongside a higher net margin than Entergy. Entergy’s revenue growth over the longer term is positive, but recent net income and margin declines and an unfavorable overall income evaluation weigh against it. PPL’s combination of margin improvements and earnings growth supports a more favorable income profile.
Financial Ratios Comparison
Below is a comparison of key financial ratios for Entergy Corporation (ETR) and PPL Corporation (PPL) based on the most recent full year data from 2024.
| Ratios | Entergy Corporation (ETR) | PPL Corporation (PPL) |
|---|---|---|
| ROE | 7.02% | 6.31% |
| ROIC | 3.20% | 3.59% |
| P/E | 30.56 | 26.97 |
| P/B | 2.14 | 1.70 |
| Current Ratio | 0.72 | 0.86 |
| Quick Ratio | 0.43 | 0.71 |
| D/E (Debt-to-Equity) | 1.91 | 1.19 |
| Debt-to-Assets | 44.6% | 40.9% |
| Interest Coverage | 2.30 | 2.36 |
| Asset Turnover | 0.18 | 0.21 |
| Fixed Asset Turnover | 0.25 | 0.26 |
| Payout Ratio | 94.2% | 84.1% |
| Dividend Yield | 3.08% | 3.12% |
Interpretation of the Ratios
Entergy Corporation
Entergy’s financial ratios show several weaknesses, with unfavorable returns on equity (7.02%) and invested capital (3.2%), alongside a low current ratio of 0.72 indicating liquidity concerns. Its dividend yield is relatively favorable at 3.08%, suggesting consistent shareholder returns, but elevated debt levels and weak asset turnover ratios pose risks to financial stability and efficiency.
PPL Corporation
PPL exhibits a slightly stronger net margin (10.49%) but shares similar weaknesses with Entergy, including unfavorable returns on equity (6.31%) and invested capital (3.59%). Its current ratio of 0.86 is better but still below ideal levels. The dividend yield stands at 3.12%, supporting steady returns, though debt and asset turnover metrics remain areas of caution for investors.
Which one has the best ratios?
Both Entergy and PPL have unfavorable overall ratio evaluations, with a majority of metrics indicating weaknesses, especially in returns and liquidity. PPL shows a marginally higher proportion of favorable ratios and a slightly better net margin, but neither company demonstrates a clearly superior financial position, as both carry significant risks in key areas.
Strategic Positioning
This section compares the strategic positioning of Entergy Corporation and PPL Corporation, including market position, key segments, and exposure to technological disruption:
Entergy Corporation
- Large US utility with 26,000 MW capacity; faces regulated electric market competition
- Diverse segments: Utility serving 3M customers and wholesale commodities including nuclear and gas
- Generates electricity from gas, nuclear, coal, hydro, and solar; includes nuclear plant decommissioning
PPL Corporation
- Mid-sized US utility with regulated electric and gas segments in Kentucky, Pennsylvania, and UK
- Focused on regional regulated markets: Kentucky, Pennsylvania, Rhode Island; electric and gas delivery
- Generates power from coal, gas, hydro, and solar; no mention of nuclear or wholesale commodity exposure
Entergy Corporation vs PPL Corporation Positioning
Entergy operates a more diversified portfolio with both retail utility and wholesale commodities, including nuclear power. PPL has a more concentrated focus on regulated electric and gas markets across specific US states and the UK, emphasizing regional stability over diversification.
Which has the best competitive advantage?
Both companies are shedding value as ROIC is below WACC, but PPL shows a growing ROIC trend, suggesting improving profitability, while Entergy exhibits declining ROIC, indicating worsening value destruction.
Stock Comparison
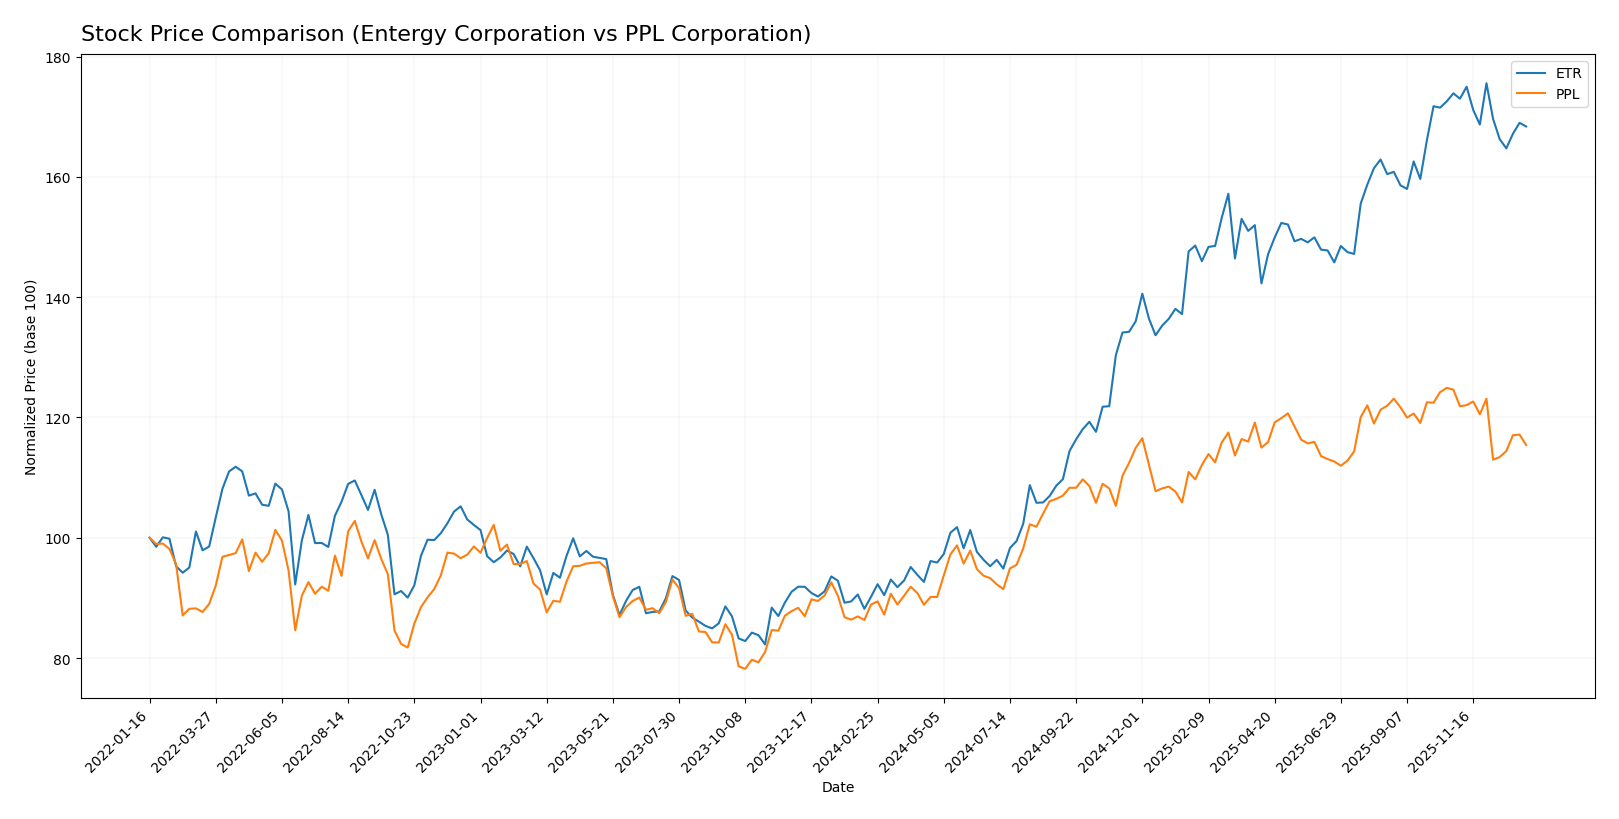
The stock prices of Entergy Corporation and PPL Corporation have shown significant bullish trends over the past 12 months, with notable price gains and recent decelerations in upward momentum.
Trend Analysis
Entergy Corporation’s stock exhibited a strong bullish trend with an 86.74% price increase over the past year, although the momentum has decelerated recently, showing a slight 3.17% decline from late October 2025 to mid-January 2026. Volatility remains high with a standard deviation of 15.22.
PPL Corporation’s stock also followed a bullish trend with a 29.84% price rise over the same period, but its upward momentum has slowed, reflected in a recent 7.39% drop. The stock shows lower volatility, with a standard deviation of 3.24.
Comparing both, Entergy Corporation outperformed PPL Corporation in market performance over the last year, despite both experiencing recent short-term downward corrections.
Target Prices
Analyst consensus target prices for Entergy Corporation and PPL Corporation indicate moderate upside potential.
| Company | Target High | Target Low | Consensus |
|---|---|---|---|
| Entergy Corporation | 115 | 91 | 103.17 |
| PPL Corporation | 45 | 36 | 41.29 |
Entergy’s consensus target of 103.17 suggests a potential price increase from the current 93.52 USD, while PPL’s consensus target of 41.29 indicates upside from its current 34.59 USD share price.
Analyst Opinions Comparison
This section compares analysts’ ratings and grades for Entergy Corporation and PPL Corporation:
Rating Comparison
Entergy Corporation Rating
- Rated B- with a “Very Favorable” status indicating solid financial standing.
- Discounted Cash Flow Score is 1, marked as “Very Unfavorable,” suggesting valuation concerns.
- Return on Equity Score is 4, “Favorable,” showing strong profit generation from equity.
- Return on Assets Score is 3, “Moderate,” indicating average asset utilization efficiency.
- Debt to Equity Score is 2, “Moderate,” implying moderate financial risk from leverage.
- Overall Score is 2, “Moderate,” summarizing the company’s financial standing.
PPL Corporation Rating
- Rated C+ with a “Very Favorable” status reflecting a generally positive evaluation.
- Discounted Cash Flow Score is 1, also “Very Unfavorable,” indicating similar valuation risk.
- Return on Equity Score is 3, “Moderate,” reflecting average profitability from equity.
- Return on Assets Score is 3, “Moderate,” indicating similar asset utilization efficiency.
- Debt to Equity Score is 2, “Moderate,” showing comparable financial risk from debt levels.
- Overall Score is 2, “Moderate,” similarly summarizing PPL’s financial status.
Which one is the best rated?
Based strictly on the data, Entergy holds a higher Return on Equity Score (4 vs. 3), indicating better profit generation efficiency, while both companies share equal overall and discounted cash flow scores. Entergy is moderately better rated due to stronger equity returns.
Scores Comparison
Here is a comparison of the Altman Z-Score and Piotroski Score for Entergy Corporation and PPL Corporation:
Entergy Corporation Scores
- Altman Z-Score: 1.04, in distress zone indicating high bankruptcy risk.
- Piotroski Score: 4, average financial strength and value.
PPL Corporation Scores
- Altman Z-Score: 0.97, in distress zone with high bankruptcy risk.
- Piotroski Score: 6, average financial strength and value.
Which company has the best scores?
Based strictly on the data, PPL Corporation has a slightly better Piotroski Score, indicating stronger financial health, while both companies are in the Altman Z-Score distress zone signaling high bankruptcy risk.
Grades Comparison
The comparison of grades for Entergy Corporation and PPL Corporation from leading grading companies is as follows:
Entergy Corporation Grades
The table below displays recent grades assigned by recognized financial institutions to Entergy Corporation:
| Grading Company | Action | New Grade | Date |
|---|---|---|---|
| Argus Research | Maintain | Buy | 2026-01-06 |
| UBS | Maintain | Buy | 2025-12-17 |
| Keybanc | Maintain | Overweight | 2025-12-12 |
| JP Morgan | Maintain | Overweight | 2025-12-11 |
| Citigroup | Maintain | Neutral | 2025-11-18 |
| Evercore ISI Group | Maintain | In Line | 2025-10-30 |
| Mizuho | Maintain | Outperform | 2025-10-27 |
| Morgan Stanley | Maintain | Equal Weight | 2025-10-22 |
| B of A Securities | Maintain | Neutral | 2025-10-16 |
| Keybanc | Maintain | Overweight | 2025-10-15 |
Entergy’s grades consistently suggest a favorable outlook with multiple “Buy” and “Overweight” ratings, reflecting stable confidence from analysts.
PPL Corporation Grades
The table below shows recent grades assigned by reputable grading firms to PPL Corporation:
| Grading Company | Action | New Grade | Date |
|---|---|---|---|
| UBS | Maintain | Neutral | 2025-12-17 |
| Wells Fargo | Maintain | Overweight | 2025-12-12 |
| JP Morgan | Maintain | Overweight | 2025-12-11 |
| BMO Capital | Maintain | Outperform | 2025-10-21 |
| B of A Securities | Maintain | Buy | 2025-10-16 |
| Barclays | Maintain | Equal Weight | 2025-10-14 |
| UBS | Maintain | Neutral | 2025-10-10 |
| Morgan Stanley | Maintain | Overweight | 2025-09-25 |
| Barclays | Maintain | Equal Weight | 2025-07-01 |
| Morgan Stanley | Maintain | Overweight | 2025-06-18 |
PPL’s grades also indicate a positive consensus, with a mix of “Buy,” “Overweight,” and “Outperform” ratings, signaling generally optimistic analyst sentiment.
Which company has the best grades?
Both Entergy Corporation and PPL Corporation have received predominantly positive grades, with consensus ratings at “Buy.” Entergy shows a slightly higher concentration of consistent “Buy” and “Overweight” ratings, while PPL presents a broader variety of positive grades including “Outperform.” This suggests both companies maintain analyst confidence, which may positively influence investor perceptions and portfolio considerations.
Strengths and Weaknesses
The table below summarizes the key strengths and weaknesses of Entergy Corporation (ETR) and PPL Corporation (PPL) based on their latest financial and operational data.
| Criterion | Entergy Corporation (ETR) | PPL Corporation (PPL) |
|---|---|---|
| Diversification | Moderate diversification across commercial, industrial, residential, and regulated natural gas sectors | More concentrated in regulated electricity markets (Kentucky, Pennsylvania, Rhode Island) |
| Profitability | Net margin 8.93% (neutral), ROIC 3.2% (unfavorable), declining ROIC trend, value destroying | Net margin 10.49% (favorable), ROIC 3.59% (unfavorable), growing ROIC, slightly unfavorable moat |
| Innovation | Limited evidence of strong innovation, focus on traditional utilities | Similar limited innovation focus, steady operational improvements |
| Global presence | Primarily US-focused operations with regulated utilities | Mainly US with past UK exposure, now more US-centric |
| Market Share | Significant presence in US regulated utility markets with revenues ~11B USD | Strong regional market share in key US states with revenues ~8B USD |
Key takeaways: Both companies operate mainly in regulated utility sectors with relatively stable revenue streams. Entergy shows a declining profitability trend and value destruction, while PPL exhibits improving returns despite also not creating excess value. Diversification is broader at Entergy, but PPL benefits from focused regional strength. Caution is advised due to overall unfavorable financial ratios and limited innovation momentum.
Risk Analysis
Below is a comparison table highlighting key risks faced by Entergy Corporation (ETR) and PPL Corporation (PPL) as of 2024:
| Metric | Entergy Corporation (ETR) | PPL Corporation (PPL) |
|---|---|---|
| Market Risk | Moderate (Beta 0.65) | Moderate (Beta 0.72) |
| Debt Level | High (D/E 1.91, Neutral) | Moderate (D/E 1.19, Neutral) |
| Regulatory Risk | Elevated (Utility sector) | Elevated (Utility sector) |
| Operational Risk | Moderate (Diverse energy mix) | Moderate (Regional focus) |
| Environmental Risk | Significant (Nuclear + fossil fuel exposure) | Moderate (Coal, gas, hydro) |
| Geopolitical Risk | Moderate (US regional exposure) | Moderate (US and UK markets) |
The most impactful risks for both companies stem from their significant debt levels paired with regulatory challenges inherent in the utility sector. Entergy’s exposure to nuclear power and fossil fuels adds environmental risk concerns, while PPL’s international presence introduces some geopolitical complexity. Both companies are in the financial distress zone based on Altman Z-Scores, signaling moderate bankruptcy risk that warrants cautious portfolio allocation.
Which Stock to Choose?
Entergy Corporation (ETR) shows mixed financial performance with declining income growth and profitability over recent years. Its 2024 ratios reveal many unfavorable metrics, including a low current ratio and high debt levels, despite a favorable dividend yield and WACC. The company’s rating is moderate overall but benefits from a favorable ROE score, though it suffers from a very unfavorable discounted cash flow score. Its economic moat is very unfavorable, reflecting value destruction and declining profitability.
PPL Corporation (PPL) presents a more favorable income statement with positive recent growth in EBIT and net margin, alongside a higher net margin than ETR in 2024. Financial ratios share similar challenges with ETR’s, such as moderate to unfavorable leverage and liquidity ratios, but PPL has a slightly better dividend yield and a moderately favorable rating overall. Its economic moat is slightly unfavorable, indicating value destruction but with improving profitability, and its financial distress risk remains in the distress zone.
For investors, the choice could depend on their risk tolerance and investment style. Those focused on potential income growth and improving profitability might find PPL’s recent positive income trends and improving ROIC more appealing. Conversely, investors prioritizing higher dividend yield and stable returns might view ETR’s consistent dividend yield and moderate rating as suggestive of more income stability, despite its value destruction signals.
Disclaimer: Investment carries a risk of loss of initial capital. The past performance is not a reliable indicator of future results. Be sure to understand risks before making an investment decision.
Go Further
I encourage you to read the complete analyses of Entergy Corporation and PPL Corporation to enhance your investment decisions: