Entergy Corporation and Pinnacle West Capital Corporation both operate in the regulated electric utilities sector, providing essential energy services across different U.S. regions. Entergy’s broad generation mix and large customer base contrast with Pinnacle West’s focused service area and substantial regulated capacity. This comparison highlights their market strategies and innovation in energy production. Join me as we analyze which company presents the most compelling investment opportunity today.
Table of contents
Companies Overview
I will begin the comparison between Entergy Corporation and Pinnacle West Capital Corporation by providing an overview of these two companies and their main differences.
Entergy Corporation Overview
Entergy Corporation operates in the regulated electric industry, focusing on electricity production and retail distribution in the US. It serves approximately 3 million utility customers across Arkansas, Louisiana, Mississippi, and Texas. The company generates power from gas, nuclear, coal, hydro, and solar sources, with a total capacity of about 26,000 MW, including 6,000 MW of nuclear power. Founded in 1913, Entergy is headquartered in New Orleans.
Pinnacle West Capital Corporation Overview
Pinnacle West Capital Corporation provides retail and wholesale electric services mainly in Arizona through its subsidiary Arizona Public Service Company. It generates electricity using coal, nuclear, gas, oil, and solar facilities, with a regulated generation capacity of roughly 6,323 MW. The company operates extensive transmission and distribution infrastructure and serves around 1.3 million customers. Incorporated in 1985, Pinnacle West is headquartered in Phoenix, Arizona.
Key similarities and differences
Both companies operate in the regulated electric utility sector, generating, transmitting, and distributing electricity using diverse energy sources including nuclear and solar power. Entergy serves a larger customer base with a significantly higher generation capacity, while Pinnacle West focuses primarily on Arizona with a smaller scale of operations. Entergy’s business includes wholesale power sales and nuclear plant operations, whereas Pinnacle West emphasizes retail services and infrastructure maintenance.
Income Statement Comparison
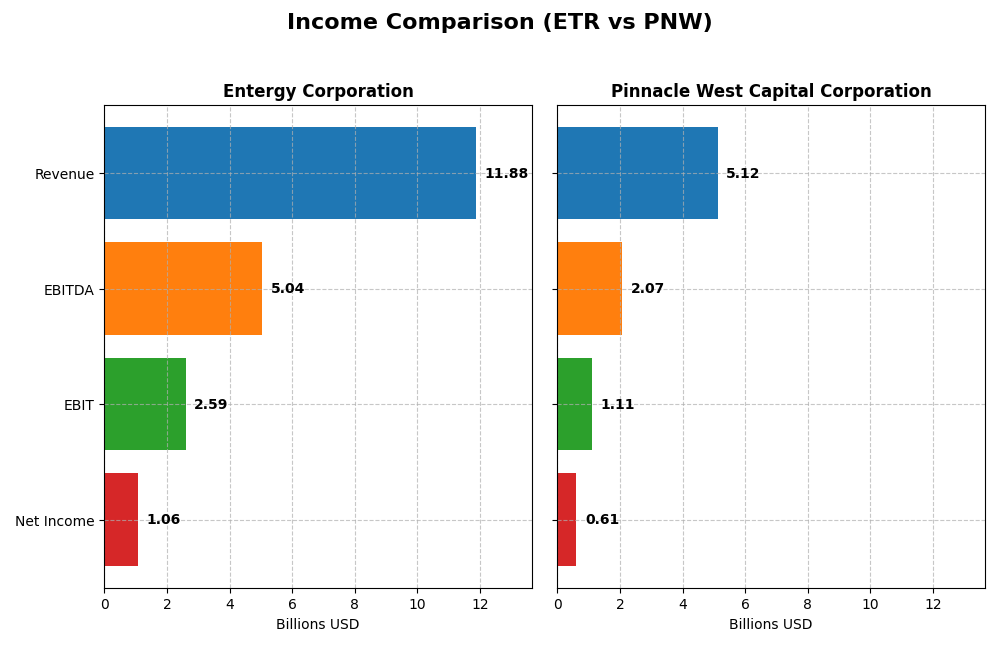
This table compares the most recent fiscal year income statement figures for Entergy Corporation and Pinnacle West Capital Corporation, highlighting key financial metrics for 2024.
| Metric | Entergy Corporation | Pinnacle West Capital Corporation |
|---|---|---|
| Market Cap | 41.8B | 10.7B |
| Revenue | 11.9B | 5.1B |
| EBITDA | 5.0B | 2.1B |
| EBIT | 2.6B | 1.1B |
| Net Income | 1.1B | 609M |
| EPS | 2.47 | 5.35 |
| Fiscal Year | 2024 | 2024 |
Income Statement Interpretations
Entergy Corporation
Entergy’s revenue showed a 17.46% growth over 2020-2024 but declined by 2.2% in 2024, with net income decreasing overall by 24.56%. Margins remain stable with a favorable gross margin of 48.3% and an EBIT margin of 21.83%. However, net margin and EPS fell sharply in 2024, indicating reduced profitability despite gross profit growth.
Pinnacle West Capital Corporation
Pinnacle West’s revenue increased consistently, rising 42.88% over 2020-2024 and 9.13% in 2024 alone. Net income grew by 10.58% overall, with a favorable net margin of 11.88%. EBIT margin was steady at 21.74%. The company showed strong earnings growth and margin improvement in the latest year, signaling solid operational performance.
Which one has the stronger fundamentals?
Pinnacle West displays stronger fundamentals with more consistent revenue and net income growth, higher net margin, and a favorable overall income statement evaluation of 78.57%. Entergy, despite solid gross margins, faces declining net income and EPS, resulting in a less favorable financial outlook of 35.71%. Pinnacle West’s recent profitability and growth metrics are comparatively more robust.
Financial Ratios Comparison
The table below compares key financial ratios for Entergy Corporation (ETR) and Pinnacle West Capital Corporation (PNW) based on the most recent fiscal year data available for 2024.
| Ratios | Entergy Corporation (ETR) | Pinnacle West Capital Corporation (PNW) |
|---|---|---|
| ROE | 7.02% | 9.01% |
| ROIC | 3.20% | 3.48% |
| P/E | 30.56 | 15.85 |
| P/B | 2.14 | 1.43 |
| Current Ratio | 0.72 | 0.59 |
| Quick Ratio | 0.43 | 0.42 |
| D/E (Debt-to-Equity) | 1.91 | 1.64 |
| Debt-to-Assets | 44.6% | 42.3% |
| Interest Coverage | 2.30 | 2.68 |
| Asset Turnover | 0.18 | 0.20 |
| Fixed Asset Turnover | 0.25 | 0.25 |
| Payout Ratio | 94.2% | 64.8% |
| Dividend Yield | 3.08% | 4.09% |
Interpretation of the Ratios
Entergy Corporation
Entergy shows a mixed financial profile with several unfavorable ratios, including a low return on equity at 7.02% and weak asset turnover at 0.18. While the dividend yield is favorable at 3.08%, concerns arise from a low current ratio of 0.72 and high debt-to-equity ratio of 1.91. The company maintains regular dividend payments, but coverage by free cash flow is negative, indicating potential sustainability risks.
Pinnacle West Capital Corporation
Pinnacle West’s ratios are somewhat stronger, with a favorable net margin of 11.88% and a dividend yield of 4.09%. However, the return on equity remains modest at 9.01%, and the company faces challenges with liquidity, reflected by a current ratio of 0.59. Debt levels and asset turnover are comparable to peers, suggesting balanced but cautious financial management alongside consistent dividend distributions.
Which one has the best ratios?
Pinnacle West Capital Corporation holds a slight edge with a greater proportion of favorable ratios, including better net margin and dividend yield, despite some liquidity weaknesses. Entergy Corporation exhibits more unfavorable ratios, particularly in profitability and liquidity metrics. Overall, Pinnacle West’s ratio profile appears less unfavorable, but both companies face notable challenges in key financial areas.
Strategic Positioning
This section compares the strategic positioning of Entergy Corporation and Pinnacle West Capital Corporation, focusing on Market position, Key segments, and Exposure to technological disruption:
Entergy Corporation
- Large market cap of 41.8B; operates in multiple southern US states with moderate competitive pressure.
- Diverse business segments: Utility and Wholesale Commodities; generates power from gas, nuclear, coal, hydro, and solar.
- Exposure includes nuclear and multiple power sources; no explicit mention of disruption but operates regulated assets.
Pinnacle West Capital Corporation
- Smaller market cap of 10.7B; primarily serves Arizona with less geographic diversification.
- Focused on retail and wholesale electric services in Arizona; generation includes coal, nuclear, gas, oil, and solar.
- Uses regulated generation with varied sources; no explicit data on technological disruption exposure.
Entergy Corporation vs Pinnacle West Capital Corporation Positioning
Entergy has a diversified geographic and segment presence, balancing utility and wholesale commodities, with broad fuel sources. Pinnacle West is more concentrated regionally in Arizona, focusing on regulated electric services with a narrower operational scope.
Which has the best competitive advantage?
Both companies have very unfavorable MOAT evaluations with declining ROIC trends below WACC, indicating value destruction and weakening competitive advantages over 2020-2024. Neither currently demonstrates a sustainable competitive advantage.
Stock Comparison
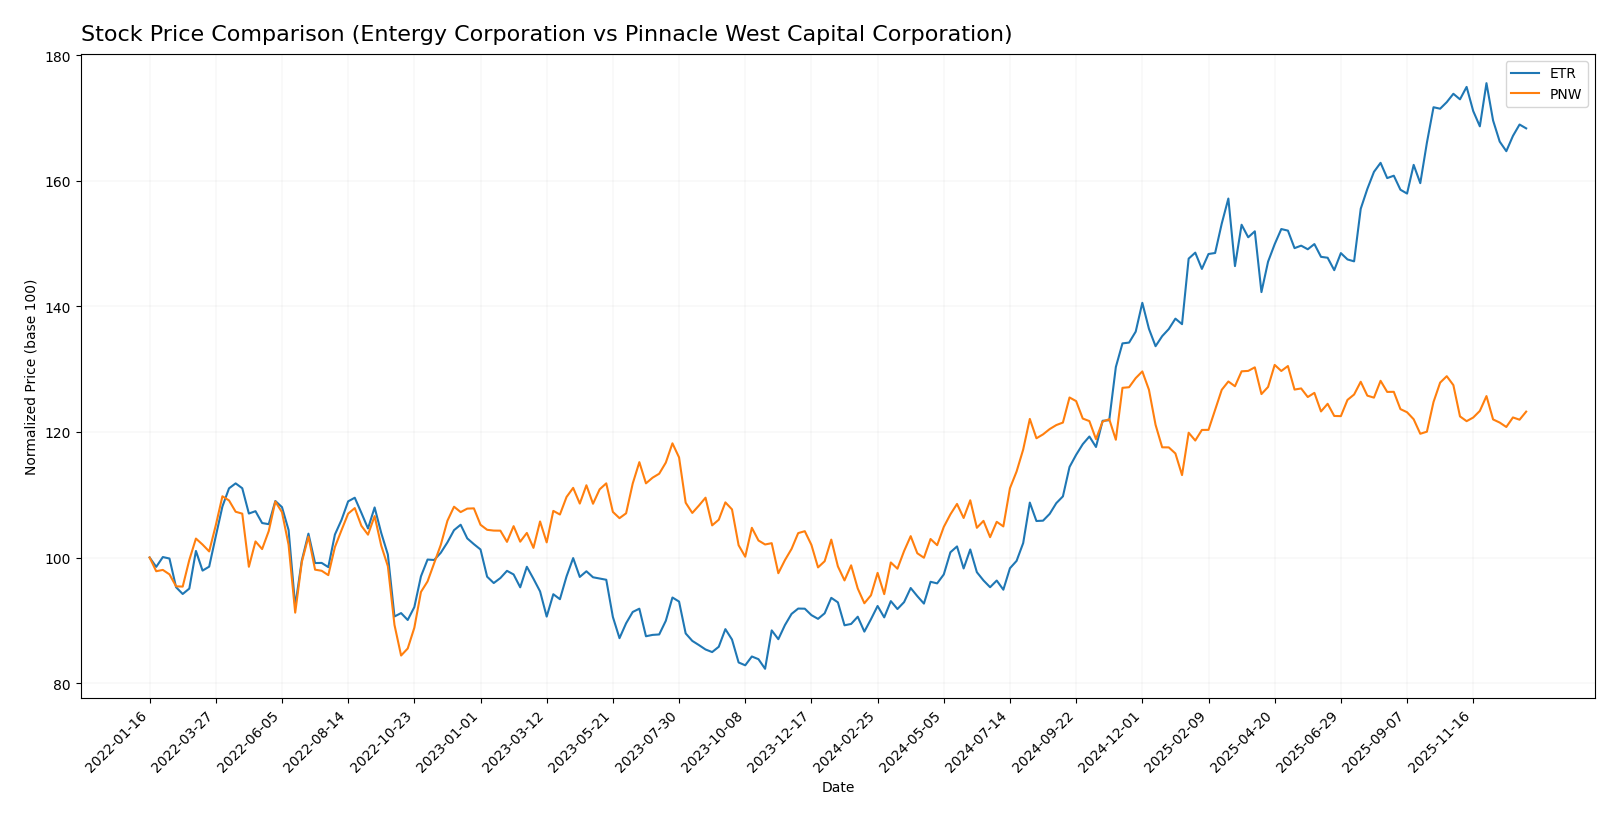
The stock prices of Entergy Corporation (ETR) and Pinnacle West Capital Corporation (PNW) exhibited significant bullish momentum over the past 12 months, with both showing deceleration in their upward trends and recent slight declines in price.
Trend Analysis
Entergy Corporation (ETR) recorded an overall bullish trend with an 86.74% price increase over the past year, marked by a deceleration in momentum and high volatility (std dev 15.22). Recently, the stock declined by 3.17%, indicating a short-term bearish dip.
Pinnacle West Capital Corporation (PNW) also showed a bullish trend with a 31.14% price rise in the last 12 months, alongside decelerating gains and moderate volatility (std dev 6.87). The recent trend shows a 3.31% price decline, reflecting a mild bearish movement.
Comparing both, Entergy (ETR) outperformed Pinnacle West (PNW) in market performance over the past year, despite recent downward corrections in their stock prices.
Target Prices
The consensus target prices for these utilities stocks indicate moderate upside potential.
| Company | Target High | Target Low | Consensus |
|---|---|---|---|
| Entergy Corporation | 115 | 91 | 103.17 |
| Pinnacle West Capital Corporation | 115 | 85 | 96.33 |
Analysts expect Entergy’s price to rise modestly above its current $93.52, while Pinnacle West shows a slightly lower upside from its $89.07 price. Both suggest stable growth in regulated electric utilities.
Analyst Opinions Comparison
This section compares analysts’ ratings and grades for Entergy Corporation and Pinnacle West Capital Corporation:
Rating Comparison
Entergy Corporation Rating
- Rating: B-, considered very favorable overall.
- Discounted Cash Flow Score: 1, indicating very unfavorable valuation based on future cash flows.
- ROE Score: 4, a favorable sign of efficient profit generation from equity.
- ROA Score: 3, moderate effectiveness in asset utilization.
- Debt To Equity Score: 2, moderate financial risk.
- Overall Score: 2, reflecting a moderate overall financial standing.
Pinnacle West Capital Corporation Rating
- Rating: C+, also considered very favorable overall.
- Discounted Cash Flow Score: 1, also very unfavorable.
- ROE Score: 3, moderate efficiency in generating profit from equity.
- ROA Score: 3, similarly moderate asset utilization.
- Debt To Equity Score: 1, indicating very unfavorable financial risk.
- Overall Score: 2, also reflecting moderate financial standing.
Which one is the best rated?
Based strictly on the provided data, Entergy holds a better rating with a B- compared to Pinnacle West’s C+. Entergy also scores higher in return on equity and has a moderately lower financial risk. Both companies share similar overall and discounted cash flow scores.
Scores Comparison
Here is a comparison of the Altman Z-Score and Piotroski Score for Entergy Corporation and Pinnacle West Capital Corporation:
ETR Scores
- Altman Z-Score: 1.04, indicating financial distress zone.
- Piotroski Score: 4, showing average financial strength.
PNW Scores
- Altman Z-Score: 0.73, also in financial distress zone.
- Piotroski Score: 4, showing average financial strength.
Which company has the best scores?
Both Entergy and Pinnacle West Capital are in the distress zone for Altman Z-Score and share an average Piotroski Score of 4. Neither shows a clear advantage based on the provided scores.
Grades Comparison
Here is a detailed comparison of the latest grades and ratings for Entergy Corporation and Pinnacle West Capital Corporation:
Entergy Corporation Grades
The following table summarizes recent grades issued by reputable grading companies for Entergy Corporation:
| Grading Company | Action | New Grade | Date |
|---|---|---|---|
| Argus Research | Maintain | Buy | 2026-01-06 |
| UBS | Maintain | Buy | 2025-12-17 |
| Keybanc | Maintain | Overweight | 2025-12-12 |
| JP Morgan | Maintain | Overweight | 2025-12-11 |
| Citigroup | Maintain | Neutral | 2025-11-18 |
| Evercore ISI Group | Maintain | In Line | 2025-10-30 |
| Mizuho | Maintain | Outperform | 2025-10-27 |
| Morgan Stanley | Maintain | Equal Weight | 2025-10-22 |
| B of A Securities | Maintain | Neutral | 2025-10-16 |
| Keybanc | Maintain | Overweight | 2025-10-15 |
The overall trend for Entergy Corporation shows predominantly positive grades, with multiple “Buy” and “Overweight” ratings, indicating a generally favorable outlook among analysts.
Pinnacle West Capital Corporation Grades
The following table summarizes recent grades issued by reputable grading companies for Pinnacle West Capital Corporation:
| Grading Company | Action | New Grade | Date |
|---|---|---|---|
| UBS | Maintain | Neutral | 2025-12-17 |
| Keybanc | Downgrade | Sector Weight | 2025-12-12 |
| Keybanc | Maintain | Overweight | 2025-10-15 |
| UBS | Maintain | Neutral | 2025-10-10 |
| Barclays | Maintain | Equal Weight | 2025-10-07 |
| Argus Research | Maintain | Buy | 2025-09-30 |
| Morgan Stanley | Maintain | Equal Weight | 2025-09-25 |
| UBS | Maintain | Neutral | 2025-09-12 |
| Mizuho | Downgrade | Neutral | 2025-09-09 |
| Barclays | Maintain | Equal Weight | 2025-08-13 |
Grades for Pinnacle West Capital Corporation reveal a more mixed picture, with multiple “Neutral” and “Equal Weight” ratings and some downgrades, reflecting a cautious stance by analysts.
Which company has the best grades?
Entergy Corporation has received stronger and more consistent positive grades, mainly “Buy” and “Overweight,” compared to Pinnacle West Capital Corporation’s more neutral and downgraded ratings. This difference could influence investors seeking stocks with higher analyst confidence.
Strengths and Weaknesses
Below is a comparison table of Entergy Corporation (ETR) and Pinnacle West Capital Corporation (PNW) based on key investment criteria using the most recent data available.
| Criterion | Entergy Corporation (ETR) | Pinnacle West Capital Corporation (PNW) |
|---|---|---|
| Diversification | Moderate: Revenues mainly from electric (residential, industrial) and natural gas segments, with some sales for resale. | Limited: Primarily electric service with minor transmission and wholesale energy segments. |
| Profitability | Low: ROIC at 3.2%, net margin 8.93%, but ROIC below WACC and declining, indicating value destruction. | Moderate: ROIC at 3.48%, net margin 11.88%, but also ROIC below WACC and declining, signaling value erosion. |
| Innovation | Average: No strong indicators of innovation leadership; focused on regulated utilities. | Average: Similar regulated utility focus with no clear innovation edge. |
| Global presence | Limited: Operations mainly in the US with regional utility service. | Limited: Regional US utility focus, no significant global footprint. |
| Market Share | Strong in regional electricity and gas markets with diverse customer base. | Strong regional player but smaller scale than ETR in terms of revenue. |
Key takeaways: Both companies operate primarily in regulated utility markets with limited diversification and global reach. Profitability trends are concerning as both show declining ROIC below their cost of capital, indicating value destruction. Pinnacle West exhibits slightly better margins and valuation metrics but still faces challenges. Investors should approach cautiously and consider the regulatory and market risks.
Risk Analysis
Below is a comparative table highlighting key risks for Entergy Corporation (ETR) and Pinnacle West Capital Corporation (PNW) based on the most recent financial data from 2024.
| Metric | Entergy Corporation (ETR) | Pinnacle West Capital Corporation (PNW) |
|---|---|---|
| Market Risk | Beta 0.65 (low volatility) | Beta 0.54 (lower volatility) |
| Debt Level | Debt/Equity 1.91 (high) | Debt/Equity 1.64 (high) |
| Regulatory Risk | High (regulated electric sector) | High (regulated electric sector) |
| Operational Risk | Moderate (diverse energy sources) | Moderate (coal, nuclear, gas, solar mix) |
| Environmental Risk | Elevated (nuclear, coal assets) | Elevated (coal and nuclear facilities) |
| Geopolitical Risk | Moderate (US regional exposure) | Moderate (US regional exposure) |
The most impactful risks for both companies center on their elevated debt levels and regulatory exposure inherent in the regulated electric utilities sector. Additionally, environmental risks remain material due to reliance on nuclear and coal power, which face increasing regulatory and societal scrutiny. Both firms exhibit moderate operational and geopolitical risks tied to their US regional footprints and energy portfolios. Caution is warranted, particularly given their Altman Z-Scores indicating distress zone status, suggesting financial vulnerability.
Which Stock to Choose?
Entergy Corporation (ETR) shows a mixed income evolution with a 17.46% revenue growth over 2020-2024 but declining net income and EPS. Its financial ratios reveal mostly unfavorable metrics, including a high net debt to EBITDA of 5.57 and low liquidity ratios. Profitability is modest with a 7.02% ROE, and the company carries substantial debt. Despite this, Entergy holds a very favorable rating of B- but displays a very unfavorable economic moat with declining ROIC below WACC.
Pinnacle West Capital Corporation (PNW) demonstrates favorable income growth, including a 42.88% revenue increase and positive net income growth over the period. Its financial ratios are slightly better, with a favorable net margin of 11.88% and moderate debt levels (net debt to EBITDA 5.33), though liquidity ratios remain low. Profitability metrics such as a 9.01% ROE are slightly better than Entergy’s. PNW also has a very favorable rating of C+ but shares a very unfavorable moat status due to declining ROIC under WACC.
For investors, Pinnacle West could appear more favorable given its stronger income growth and higher net margin, while Entergy might appeal to those more focused on dividend yield and rating strength despite weaker profitability and debt concerns. Both companies exhibit value-destroying economic moats, suggesting caution. Thus, the choice might depend on whether the investor prioritizes growth metrics or dividend and rating considerations.
Disclaimer: Investment carries a risk of loss of initial capital. The past performance is not a reliable indicator of future results. Be sure to understand risks before making an investment decision.
Go Further
I encourage you to read the complete analyses of Entergy Corporation and Pinnacle West Capital Corporation to enhance your investment decisions: