Entergy Corporation and Pacific Gas & Electric Co. are two prominent players in the regulated electric utility sector, serving distinct yet overlapping U.S. regions with diverse energy portfolios. Both companies focus on innovation, integrating nuclear, renewable, and traditional power sources to meet evolving market demands. This comparison explores their strategic approaches and financial health to help you identify which company holds the most promise for your investment portfolio.

Table of contents
Companies Overview
I will begin the comparison between Entergy Corporation and Pacific Gas & Electric Co. by providing an overview of these two companies and their main differences.
Entergy Corporation Overview
Entergy Corporation operates in the regulated electric industry, focusing on electricity production and retail distribution in parts of Arkansas, Louisiana, Mississippi, and Texas. The company manages both utility operations and wholesale commodities, including nuclear and non-nuclear power plants, with a total generating capacity of approximately 26,000 MW. Founded in 1913 and headquartered in New Orleans, Entergy serves around 3 million utility customers.
Pacific Gas & Electric Co. Overview
Pacific Gas & Electric Co. provides electricity and natural gas services in northern and central California. It generates power from diverse sources, including nuclear, hydroelectric, fossil fuels, and photovoltaic systems. The company also develops smart grid technologies such as a microgrid backup power device. Incorporated in 1905 and based in San Francisco, PG&E serves residential, commercial, industrial, and agricultural customers as a subsidiary of PG&E Corporation.
Key similarities and differences
Both Entergy and PG&E operate in the regulated electric sector, generating and distributing electricity through diverse power sources including nuclear and renewables. Entergy focuses on a multi-state regional presence in the southern U.S., while PG&E serves California’s northern and central regions. PG&E has a larger workforce and emphasizes smart grid innovation, whereas Entergy combines utility and wholesale commodity operations with significant nuclear capacity.
Income Statement Comparison
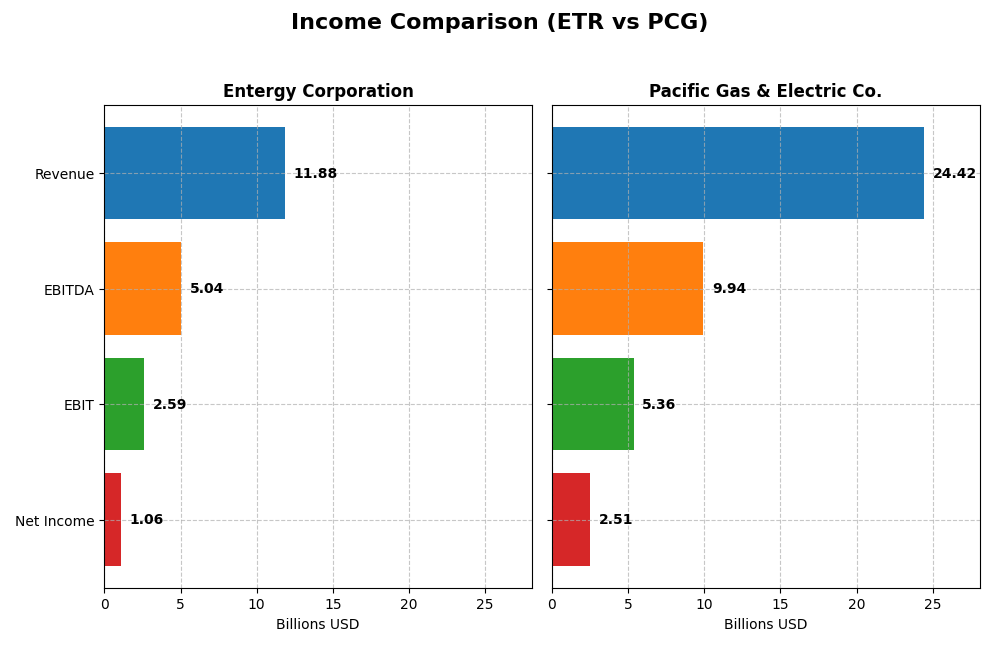
Below is a side-by-side comparison of key income statement metrics for Entergy Corporation and Pacific Gas & Electric Co. for the fiscal year 2024.
| Metric | Entergy Corporation | Pacific Gas & Electric Co. |
|---|---|---|
| Market Cap | 41.8B | 34.8B |
| Revenue | 11.9B | 24.4B |
| EBITDA | 5.04B | 9.94B |
| EBIT | 2.59B | 5.36B |
| Net Income | 1.06B | 2.51B |
| EPS | 2.47 | 1.16 |
| Fiscal Year | 2024 | 2024 |
Income Statement Interpretations
Entergy Corporation
Entergy Corporation’s revenue showed a 17.46% growth over 2020-2024 but declined by 2.2% in 2024. Net income decreased overall by 24.56%, with a sharp 54.07% drop in net margin in 2024. Gross and EBIT margins remain favorable at 48.3% and 21.83%, respectively, yet the latest year saw reduced profitability and EPS, signaling margin pressure.
Pacific Gas & Electric Co.
Pacific Gas & Electric Co. experienced a 32.22% revenue increase over the period but had a slight 0.04% revenue decline in 2024. Net income and margins improved significantly, with net income growth of 292.64% overall and a 11.39% net margin increase in 2024. Gross margin stands at 37.5%, EBIT margin at 21.96%, and net margin at 10.29%, reflecting solid operational gains.
Which one has the stronger fundamentals?
Pacific Gas & Electric shows stronger fundamentals given its favorable trends in revenue growth, net income, and margin expansion, particularly its robust improvement in 2024. Entergy’s margins are healthy but overshadowed by declining net income and EPS. PCG’s overall positive income statement evaluation contrasts with ETR’s predominantly unfavorable assessment.
Financial Ratios Comparison
The table below presents a side-by-side comparison of key financial ratios for Entergy Corporation (ETR) and Pacific Gas & Electric Co. (PCG) based on their most recent fiscal year data (2024).
| Ratios | Entergy Corporation (ETR) | Pacific Gas & Electric Co. (PCG) |
|---|---|---|
| ROE | 7.02% | 8.33% |
| ROIC | 3.20% | 3.98% |
| P/E | 30.56 | 17.20 |
| P/B | 2.14 | 1.43 |
| Current Ratio | 0.72 | 1.05 |
| Quick Ratio | 0.43 | 1.00 |
| D/E (Debt-to-Equity) | 1.91 | 1.94 |
| Debt-to-Assets | 44.63% | 43.65% |
| Interest Coverage | 2.30 | 1.46 |
| Asset Turnover | 0.18 | 0.18 |
| Fixed Asset Turnover | 0.25 | 0.28 |
| Payout ratio | 94.23% | 3.42% |
| Dividend yield | 3.08% | 0.20% |
Interpretation of the Ratios
Entergy Corporation
Entergy’s ratios reveal several weaknesses, including unfavorable returns on equity (7.02%) and invested capital (3.2%), along with a low current ratio of 0.72, indicating liquidity concerns. Its price-to-earnings ratio at 30.56 is high, suggesting potential overvaluation. The dividend yield stands at a favorable 3.08%, supported by consistent dividend payments, though free cash flow coverage is negative, which may raise sustainability concerns.
Pacific Gas & Electric Co.
Pacific Gas & Electric shows a mix of strengths and weaknesses, with a favorable net margin of 10.29% and solid liquidity ratios, including a current ratio of 1.05 and quick ratio of 1.0. However, its return on equity is moderate at 8.33%, and interest coverage is unfavorable at 1.76. The dividend yield is low at 0.2%, indicating limited shareholder returns through dividends, possibly reflecting cautious capital allocation or reinvestment priorities.
Which one has the best ratios?
Comparing both, Pacific Gas & Electric offers a more balanced financial profile with higher liquidity and better net margin, despite some weaknesses in returns and interest coverage. Entergy, however, faces greater challenges with several unfavorable ratios and liquidity issues but offers a higher dividend yield. Overall, Pacific Gas & Electric’s ratios appear slightly more favorable, reflecting a somewhat stronger financial position.
Strategic Positioning
This section compares the strategic positioning of Entergy Corporation and Pacific Gas & Electric Co., including their market position, key segments, and exposure to technological disruption:
Entergy Corporation
- Operates in regulated electric markets in Arkansas, Louisiana, Mississippi, and Texas; faces moderate competition.
- Key segments include Utility (electricity and natural gas distribution) and Entergy Wholesale Commodities (nuclear and non-nuclear power).
- Generates electricity from gas, nuclear, coal, hydro, and solar; limited info on specific technological disruption strategies.
Pacific Gas & Electric Co.
- Regulated electric and natural gas markets in northern and central California; competitive but stable market.
- Focuses on electricity and natural gas distribution, serving residential, commercial, industrial, and agricultural customers.
- Utilizes nuclear, hydroelectric, fossil fuel, photovoltaic sources; develops personal microgrid backup devices integrated with SmartMeter.
Entergy Corporation vs Pacific Gas & Electric Co. Positioning
Entergy’s approach is diversified across multiple states and power generation types, while PCG concentrates on California with a focus on integrated electricity and gas services. Entergy’s wholesale commodities add complexity; PCG emphasizes smart grid innovations. Both face regulatory market pressures.
Which has the best competitive advantage?
Both companies are shedding value with ROIC below WACC, but PCG shows a growing ROIC trend indicating improving profitability, while Entergy’s ROIC is declining, reflecting deteriorating value creation. PCG’s slightly unfavorable moat suggests a somewhat stronger competitive advantage.
Stock Comparison
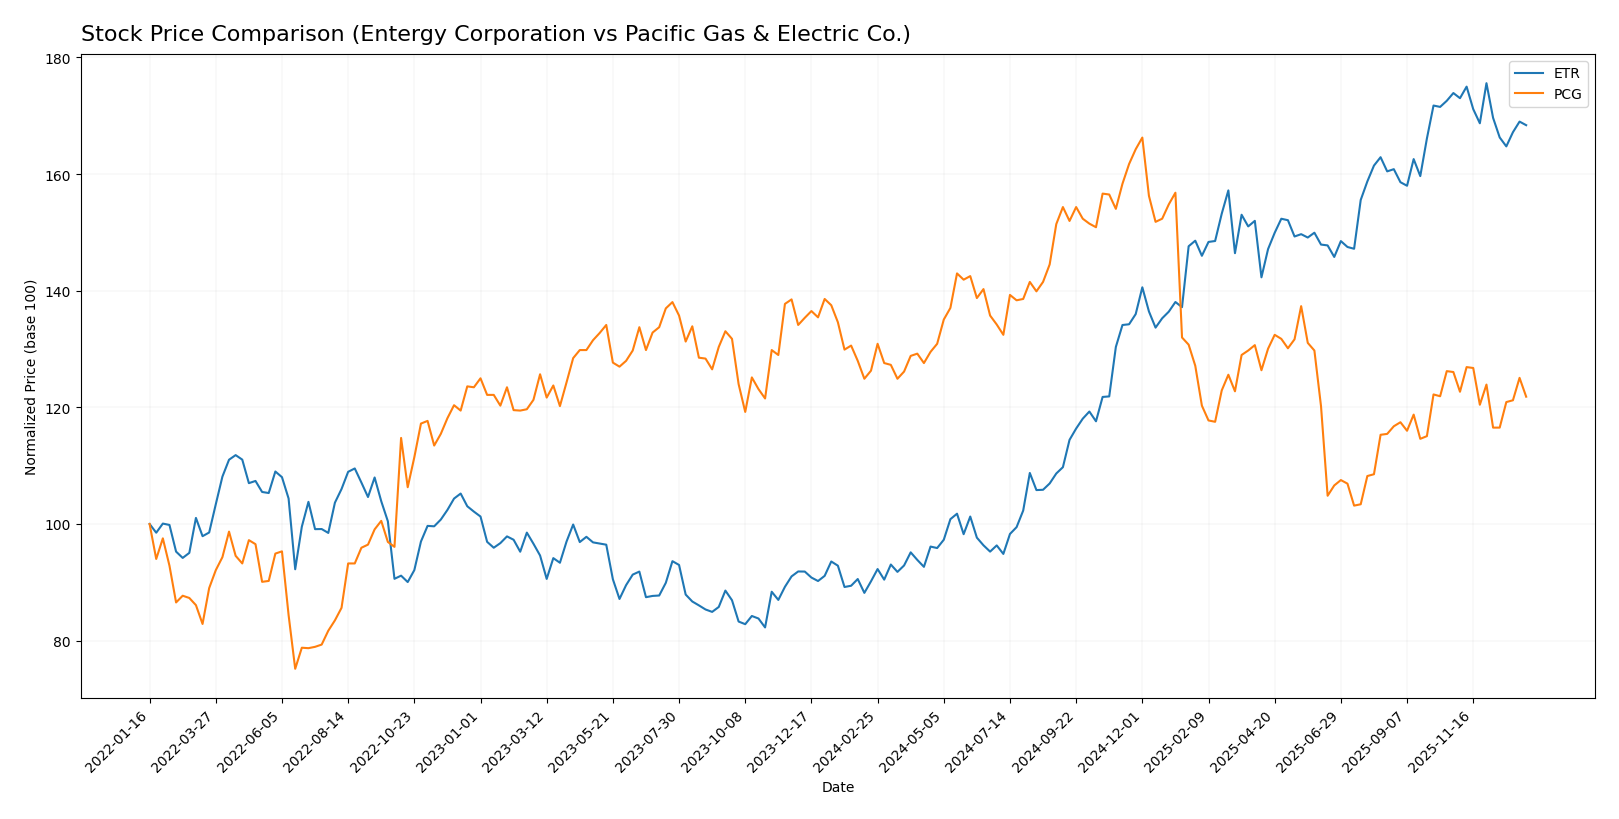
The stock price chart highlights Entergy Corporation’s strong bullish momentum over the past 12 months with significant gains, while Pacific Gas & Electric Co. exhibits a modest bearish trend marked by deceleration in price movement.
Trend Analysis
Entergy Corporation’s stock shows an overall bullish trend with an 86.74% increase over the past 12 months, despite recent deceleration and a slight 3.17% decline in the last quarter. Volatility remains elevated with a 15.22 std deviation.
Pacific Gas & Electric Co. experienced a 3.53% price decrease over the same period, confirming a bearish trend with decelerating momentum and low volatility (1.93 std deviation). Recent performance continues to decline slightly by 3.35%.
Comparing the two, Entergy Corporation delivered the highest market performance with a robust 86.74% gain versus Pacific Gas & Electric’s 3.53% loss over the last year.
Target Prices
The target price consensus for Entergy Corporation and Pacific Gas & Electric Co. reflects moderate upside potential.
| Company | Target High | Target Low | Consensus |
|---|---|---|---|
| Entergy Corporation | 115 | 91 | 103.17 |
| Pacific Gas & Electric Co. | 25 | 18 | 21.5 |
Analysts expect Entergy’s stock to trade above its current price of 93.52 USD, indicating moderate growth potential. Pacific Gas & Electric’s consensus target of 21.5 USD also suggests upside from the current 15.85 USD price.
Analyst Opinions Comparison
This section compares analysts’ ratings and grades for Entergy Corporation and Pacific Gas & Electric Co.:
Rating Comparison
ETR Rating
- Rating: B-, classified as Very Favorable
- Discounted Cash Flow Score: 1, rated Very Unfavorable
- Return on Equity Score: 4, rated Favorable
- Return on Assets Score: 3, rated Moderate
- Debt To Equity Score: 2, rated Moderate
- Overall Score: 2, rated Moderate
PCG Rating
- Rating: B-, classified as Very Favorable
- Discounted Cash Flow Score: 1, rated Very Unfavorable
- Return on Equity Score: 3, rated Moderate
- Return on Assets Score: 3, rated Moderate
- Debt To Equity Score: 1, rated Very Unfavorable
- Overall Score: 3, rated Moderate
Which one is the best rated?
Both companies share the same overall rating of B-, considered Very Favorable. ETR scores higher on return on equity and debt-to-equity metrics, while PCG has a better overall score but a weaker debt-to-equity rating.
Scores Comparison
Here is a comparison of the Altman Z-Score and Piotroski Score for both companies:
Entergy Corporation Scores
- Altman Z-Score: 1.04, in distress zone indicating high bankruptcy risk.
- Piotroski Score: 4, average financial strength rating.
Pacific Gas & Electric Co. Scores
- Altman Z-Score: 0.48, in distress zone indicating very high bankruptcy risk.
- Piotroski Score: 5, average financial strength rating.
Which company has the best scores?
Based strictly on the provided data, Pacific Gas & Electric Co. has a slightly higher Piotroski Score (5 vs. 4), indicating marginally stronger financial health. However, Entergy Corporation has a better Altman Z-Score (1.04 vs. 0.48), suggesting a comparatively lower bankruptcy risk.
Grades Comparison
Here is a detailed comparison of the recent grades assigned to Entergy Corporation and Pacific Gas & Electric Co.:
Entergy Corporation Grades
The following table summarizes recent grades and recommendations from recognized grading companies for Entergy Corporation:
| Grading Company | Action | New Grade | Date |
|---|---|---|---|
| Argus Research | Maintain | Buy | 2026-01-06 |
| UBS | Maintain | Buy | 2025-12-17 |
| Keybanc | Maintain | Overweight | 2025-12-12 |
| JP Morgan | Maintain | Overweight | 2025-12-11 |
| Citigroup | Maintain | Neutral | 2025-11-18 |
| Evercore ISI Group | Maintain | In Line | 2025-10-30 |
| Mizuho | Maintain | Outperform | 2025-10-27 |
| Morgan Stanley | Maintain | Equal Weight | 2025-10-22 |
| B of A Securities | Maintain | Neutral | 2025-10-16 |
| Keybanc | Maintain | Overweight | 2025-10-15 |
Grades for Entergy Corporation generally reflect a positive outlook with most firms maintaining Buy or Overweight recommendations, indicating moderate confidence in the stock’s performance.
Pacific Gas & Electric Co. Grades
The following table presents recent grades and recommendations from established grading companies for Pacific Gas & Electric Co.:
| Grading Company | Action | New Grade | Date |
|---|---|---|---|
| JP Morgan | Maintain | Overweight | 2025-12-12 |
| UBS | Maintain | Neutral | 2025-10-24 |
| Jefferies | Maintain | Buy | 2025-10-22 |
| BMO Capital | Maintain | Outperform | 2025-10-14 |
| Jefferies | Maintain | Buy | 2025-10-03 |
| Barclays | Maintain | Overweight | 2025-10-01 |
| Morgan Stanley | Maintain | Equal Weight | 2025-09-25 |
| Morgan Stanley | Upgrade | Equal Weight | 2025-09-18 |
| UBS | Maintain | Neutral | 2025-09-18 |
| Barclays | Maintain | Overweight | 2025-07-22 |
Pacific Gas & Electric Co. exhibits a generally favorable rating trend with multiple Buy and Overweight grades, reflecting analysts’ sustained confidence in the company’s prospects.
Which company has the best grades?
Both Entergy Corporation and Pacific Gas & Electric Co. have received predominantly positive grades, with consensus ratings of “Buy” and a majority of Buy or Overweight recommendations. Entergy shows a slightly higher number of Buy ratings, while Pacific Gas & Electric has a mix including Outperform and upgraded Equal Weight ratings. These grading patterns suggest moderate optimism for both, potentially influencing investor sentiment and portfolio positioning.
Strengths and Weaknesses
Below is a comparison of key strengths and weaknesses for Entergy Corporation (ETR) and Pacific Gas & Electric Co. (PCG) based on the most recent data from 2024.
| Criterion | Entergy Corporation (ETR) | Pacific Gas & Electric Co. (PCG) |
|---|---|---|
| Diversification | Moderate: Revenue spread across commercial, industrial, residential, and governmental sectors, with some reliance on electricity and natural gas segments. | High: Strong focus on electricity and natural gas, with significant natural gas regulated revenue providing balance. |
| Profitability | Low: ROIC at 3.2% below WACC (5.49%), net margin neutral at 8.93%, overall value destruction and declining profitability. | Moderate: ROIC at 3.98% below WACC (4.68%), net margin favorable at 10.29%, improving profitability trend but still shedding value. |
| Innovation | Limited visible innovation metrics; stable but declining ROIC suggests challenges in capital efficiency. | Some improvement: Growing ROIC trend indicates potential operational improvements and innovation in efficiency. |
| Global presence | Primarily US-focused utility with limited international exposure. | Primarily US-focused utility, similarly limited global footprint. |
| Market Share | Moderate in its regional utility markets, with revenue around $11B. | Larger market share in California with revenues exceeding $25B, reflecting a stronger regional dominance. |
Key takeaway: Entergy shows challenges with declining profitability and inefficient capital use, while Pacific Gas & Electric, despite still shedding value, demonstrates improving profitability and stronger market presence. Investors should weigh Entergy’s financial weaknesses against PCG’s gradual recovery and larger scale.
Risk Analysis
Below is a comparison of key risks for Entergy Corporation (ETR) and Pacific Gas & Electric Co. (PCG) based on the most recent data from 2024 and 2026:
| Metric | Entergy Corporation (ETR) | Pacific Gas & Electric Co. (PCG) |
|---|---|---|
| Market Risk | Beta 0.65, moderate volatility, stable utility sector exposure | Beta 0.38, lower volatility, but highly sensitive to California market conditions |
| Debt level | Debt-to-Equity 1.91, moderate leverage with neutral debt-to-asset ratio (44.6%) | Debt-to-Equity 1.94, similar leverage but less favorable interest coverage |
| Regulatory Risk | High, due to nuclear and fossil fuel generation and multi-state regulation | Very high, ongoing scrutiny after wildfire liabilities and California regulatory challenges |
| Operational Risk | Moderate, diversified generation mix including nuclear, gas, and renewables | Elevated, with past operational disruptions and infrastructure modernization needs |
| Environmental Risk | Moderate, nuclear decommissioning and emissions concerns | High, wildfire risk and fossil fuel emissions under strict regulation |
| Geopolitical Risk | Low, primarily US regional exposure | Low, focused on California but less exposed internationally |
In synthesis, Pacific Gas & Electric faces the most impactful risks due to regulatory and environmental challenges linked to wildfire liabilities and operational disruptions, despite a lower market volatility. Entergy shows moderate financial and operational risks but benefits from a more diversified asset base and better dividend stability. Both companies carry notable debt levels and fall into financial distress zones per Altman Z-scores, signaling caution. Investors should weigh regulatory and environmental risks heavily while considering these utilities for portfolios.
Which Stock to Choose?
Entergy Corporation (ETR) shows mixed income evolution with revenue growth over the period but declining net income and EPS. Its financial ratios reveal mostly unfavorable signals, including low returns and liquidity concerns, despite a favorable dividend yield. The company carries significant debt and holds a very favorable B- rating.
Pacific Gas & Electric Co. (PCG) presents a favorable income evolution with strong growth in net income and margins. Its financial ratios are slightly more balanced, featuring favorable net margin and liquidity ratios but some unfavorable debt and interest coverage metrics. PCG holds a very favorable B- rating as well.
Investors with a risk-averse profile focused on income stability might find PCG’s improving profitability and liquidity ratios more appealing, while those seeking dividend yield and accepting higher financial risk could interpret Entergy’s profile as fitting. Both companies show signs of value destruction, but PCG’s improving ROIC trend might signal better future efficiency.
Disclaimer: Investment carries a risk of loss of initial capital. The past performance is not a reliable indicator of future results. Be sure to understand risks before making an investment decision.
Go Further
I encourage you to read the complete analyses of Entergy Corporation and Pacific Gas & Electric Co. to enhance your investment decisions: