Entergy Corporation and Oklo Inc. are two influential players in the regulated electric utilities sector, yet they represent contrasting stages and approaches in energy production. Entergy, with a century-long legacy, operates a diverse mix of power sources across several U.S. states, while Oklo is a rising innovator focused on advanced fission technology and nuclear fuel recycling. This article will help investors understand which company offers the most compelling opportunity in today’s evolving energy landscape.
Table of contents
Companies Overview
I will begin the comparison between Entergy Corporation and Oklo Inc. by providing an overview of these two companies and their main differences.
Entergy Corporation Overview
Entergy Corporation operates in the regulated electric utility sector, providing electricity production and retail distribution in parts of Arkansas, Louisiana, Mississippi, and Texas. The company generates power from diverse sources including gas, nuclear, coal, hydro, and solar, serving about 3M utility customers. Founded in 1913 and headquartered in New Orleans, it holds approximately 26,000 MW of electric generating capacity, including 6,000 MW from nuclear power.
Oklo Inc. Overview
Oklo Inc. specializes in designing and developing fission power plants to deliver reliable, commercial-scale energy within the United States. Founded in 2013 and based in Santa Clara, California, Oklo also offers used nuclear fuel recycling services. The company operates in the regulated electric industry with a focus on next-generation nuclear technology, employing around 120 people and having gone public in 2021.
Key similarities and differences
Both Entergy and Oklo operate in the regulated electric utilities sector in the US, with a focus on nuclear energy as part of their power generation mix. However, Entergy is a long-established utility with a broad energy portfolio and a large customer base, while Oklo is a younger company concentrating on innovative nuclear power plant design and fuel recycling. Entergy’s scale and generation capacity far exceed those of Oklo, which remains more specialized and smaller in workforce and market capitalization.
Income Statement Comparison
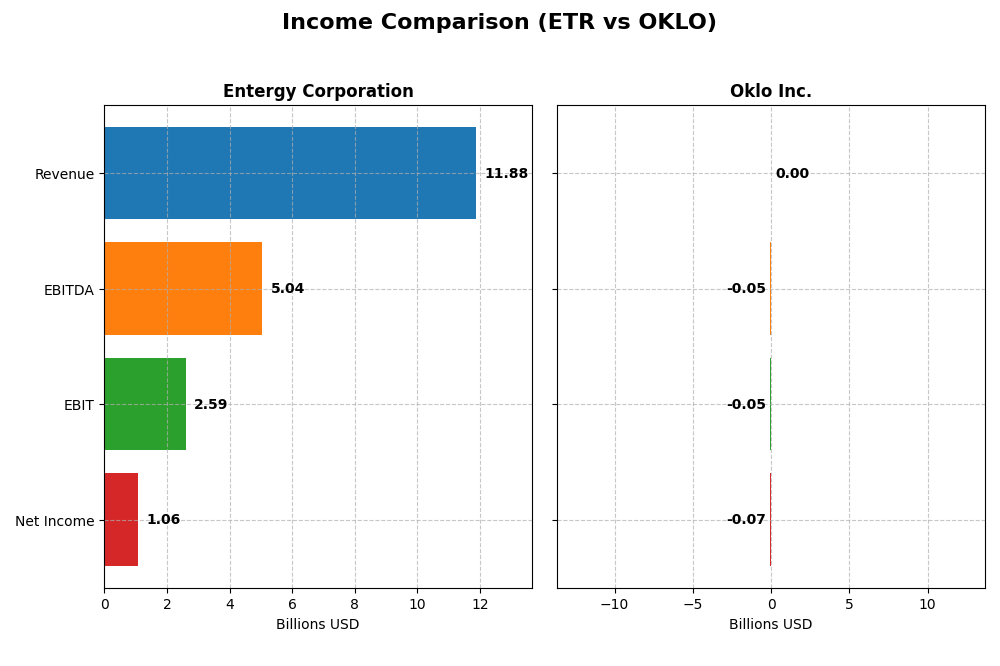
Below is a side-by-side comparison of Entergy Corporation and Oklo Inc. income statement metrics for the fiscal year 2024.
| Metric | Entergy Corporation | Oklo Inc. |
|---|---|---|
| Market Cap | 41.8B | 16.5B |
| Revenue | 11.9B | 0 |
| EBITDA | 5.04B | -52.5M |
| EBIT | 2.59B | -52.8M |
| Net Income | 1.06B | -73.6M |
| EPS | 2.47 | -0.74 |
| Fiscal Year | 2024 | 2024 |
Income Statement Interpretations
Entergy Corporation
Entergy’s revenue showed a 17.46% growth over 2020-2024 but declined by 2.2% in 2024. Net income decreased overall by 24.56%, with a sharp 54.07% dip in net margin in 2024. Margins remain generally favorable, with a 48.3% gross margin and 21.83% EBIT margin in 2024, though the recent year saw slower growth and margin contraction.
Oklo Inc.
Oklo recorded zero revenue consistently from 2021 to 2024, reflecting its early-stage status. Net income was negative throughout, with a worsening EPS decline of 59.38% in 2024 and overall net income growth down over 1300%. The company’s margins are unfavorable, with no gross or EBIT margin and continued operating losses, indicating ongoing investment phases.
Which one has the stronger fundamentals?
Comparing both, Entergy exhibits stronger fundamentals with positive revenue, albeit slightly declining recently, and stable margins despite net income pressure. Oklo’s lack of revenue and persistent net losses indicate weaker income fundamentals reflective of a developmental stage. Both face unfavorable income growth trends, but Entergy’s scale and profitability metrics provide a more solid income foundation.
Financial Ratios Comparison
Below is a comparison of key financial ratios for Entergy Corporation (ETR) and Oklo Inc. (OKLO) based on their most recent fiscal year data for 2024.
| Ratios | Entergy Corporation (ETR) | Oklo Inc. (OKLO) |
|---|---|---|
| ROE | 7.02% | -29.35% |
| ROIC | 3.20% | -19.23% |
| P/E | 30.56 | -28.52 |
| P/B | 2.14 | 8.37 |
| Current Ratio | 0.72 | 43.47 |
| Quick Ratio | 0.43 | 43.47 |
| D/E (Debt-to-Equity) | 1.91 | 0.0051 |
| Debt-to-Assets | 44.63% | 0.46% |
| Interest Coverage | 2.30 | 0 |
| Asset Turnover | 0.18 | 0 |
| Fixed Asset Turnover | 0.25 | 0 |
| Payout Ratio | 94.23% | 0 |
| Dividend Yield | 3.08% | 0 |
Interpretation of the Ratios
Entergy Corporation
Entergy’s ratios reveal several weaknesses, including unfavorable returns on equity (7.02%) and invested capital (3.2%), a low current ratio (0.72), and high debt-to-equity (1.91). Its price-to-earnings ratio of 30.56 is also unfavorable, suggesting valuation concerns. The company offers a stable dividend yield of 3.08%, supported by a payout ratio that appears sustainable despite some cash flow challenges.
Oklo Inc.
Oklo’s financial ratios reflect significant challenges, including negative returns on equity (-29.35%) and invested capital (-19.23%) and a net margin of 0%. The extremely high current ratio (43.47) contrasts with poor asset turnover metrics, indicating inefficiency. Oklo does not pay dividends, consistent with its negative earnings and focus on reinvestment and development in early growth stages.
Which one has the best ratios?
Both companies display unfavorable overall ratio profiles, but Entergy shows more stability with some favorable metrics like dividend yield and weighted average cost of capital. Oklo’s highly negative profitability ratios and lack of dividends reflect its early growth status and operational challenges. Neither company currently presents a clearly superior ratio set.
Strategic Positioning
This section compares the strategic positioning of Entergy Corporation and Oklo Inc., focusing on Market position, Key segments, and Exposure to technological disruption:
Entergy Corporation
- Large established utility with 26,000 MW capacity; faces regulated market pressures
- Diverse energy generation: gas, nuclear, coal, hydro, solar; serves 3M utility customers across multiple states
- Operates traditional and nuclear power plants, with some exposure to nuclear technology disruption
Oklo Inc.
- Smaller, newer designer of fission power plants with emerging market presence
- Concentrated on nuclear fission plant design and nuclear fuel recycling services
- Focused on innovative nuclear technology with potential disruption in power generation
Entergy Corporation vs Oklo Inc. Positioning
Entergy has a diversified utility business across multiple states with broad energy sources, offering stable revenues but regulated competitive pressures. Oklo is concentrated on advanced nuclear technology, with potential growth but limited scale and higher market uncertainty.
Which has the best competitive advantage?
Both companies currently show very unfavorable MOAT evaluations with declining ROIC below WACC, indicating value destruction and weak competitive advantages based on their recent financial performance.
Stock Comparison
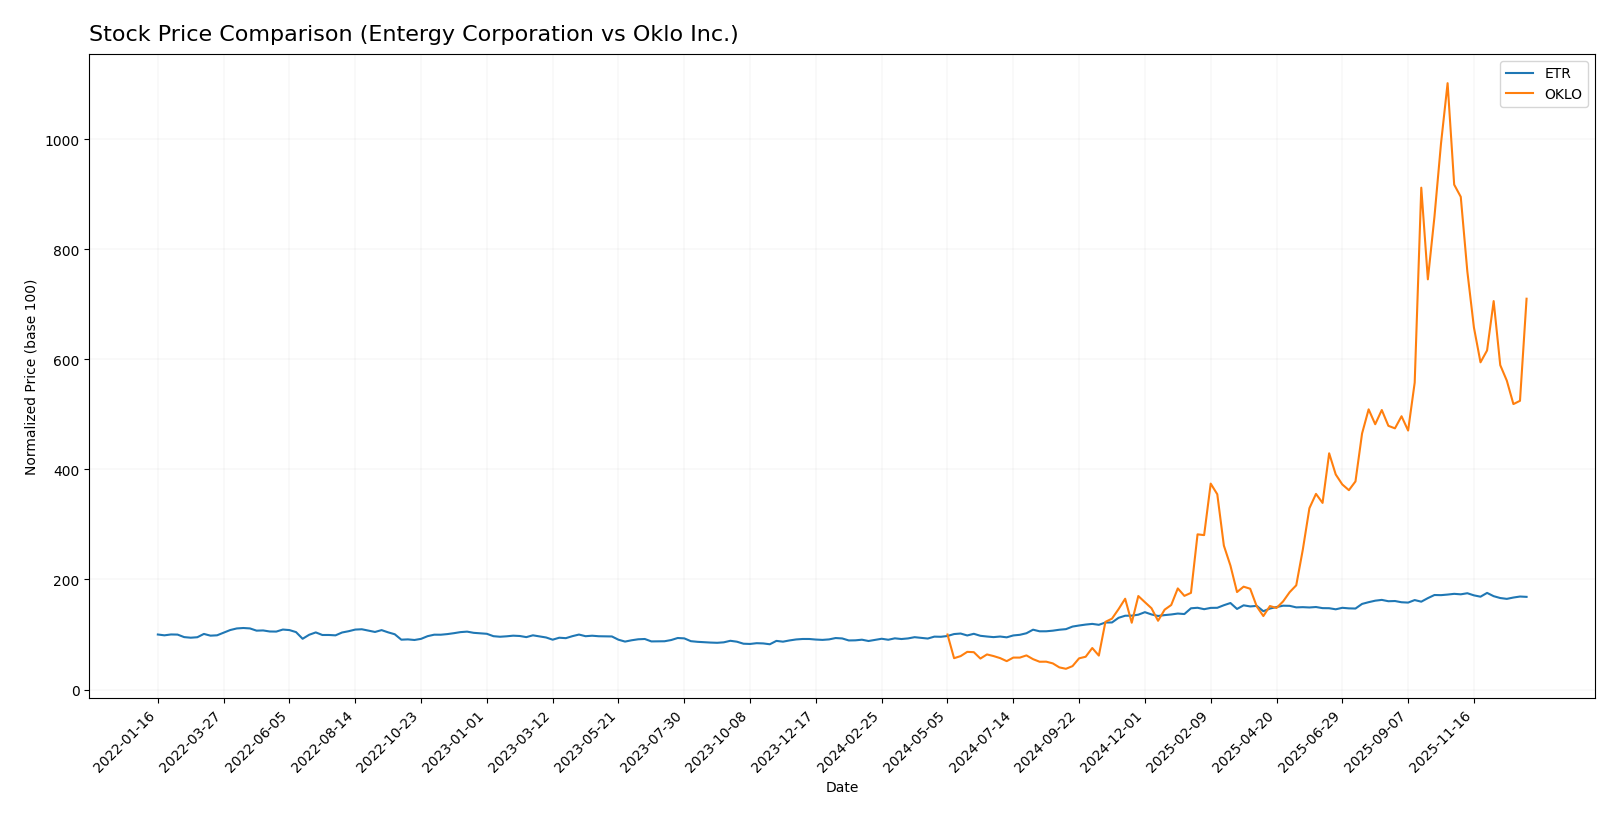
The stock price movements of Entergy Corporation (ETR) and Oklo Inc. (OKLO) over the past 12 months reveal strong bullish trends with significant gains, though both have recently experienced downward pressure in trading dynamics.
Trend Analysis
Entergy Corporation’s stock showed an 86.74% increase over the past year with a bullish trend but recent data reveal a slight -3.17% decline and decelerating momentum, supported by moderate volatility at 15.22.
Oklo Inc.’s stock surged by 610.11% over the same period, reflecting a bullish but decelerating trend. Recent performance shows a sharper -22.59% drop, with higher volatility measured at 39.02.
Comparing both, Oklo Inc. delivered substantially higher market returns despite recent steeper declines, outperforming Entergy Corporation in overall stock price appreciation.
Target Prices
Here is the consensus target price overview based on reliable analyst data for Entergy Corporation and Oklo Inc.
| Company | Target High | Target Low | Consensus |
|---|---|---|---|
| Entergy Corporation | 115 | 91 | 103.17 |
| Oklo Inc. | 150 | 95 | 125.67 |
Analysts expect Entergy’s stock to appreciate modestly from its current price of 93.52 USD toward the consensus target of 103.17 USD. Oklo’s consensus target of 125.67 USD suggests upside potential from the current 105.31 USD price.
Analyst Opinions Comparison
This section compares analysts’ ratings and grades for Entergy Corporation and Oklo Inc.:
Rating Comparison
Entergy Corporation Rating
- Rating: B-, considered very favorable overall.
- Discounted Cash Flow Score: 1, indicating a very unfavorable DCF.
- ROE Score: 4, favorable efficiency in generating profit.
- ROA Score: 3, moderate asset utilization effectiveness.
- Debt To Equity Score: 2, moderate financial risk.
- Overall Score: 2, moderate overall financial standing.
Oklo Inc. Rating
- Rating: C+, also considered very favorable overall.
- Discounted Cash Flow Score: 3, moderate valuation outlook.
- ROE Score: 1, very unfavorable profit efficiency.
- ROA Score: 1, very unfavorable asset utilization.
- Debt To Equity Score: 5, very favorable low financial risk.
- Overall Score: 2, moderate overall financial standing.
Which one is the best rated?
Entergy holds a better rating (B-) with stronger ROE and ROA scores despite a weak DCF score. Oklo’s higher DCF and debt scores contrast with weaker profitability metrics, making Entergy better rated overall based on the data.
Scores Comparison
Here is a comparison of the Altman Z-Score and Piotroski Score for Entergy Corporation and Oklo Inc.:
Entergy Corporation Scores
- Altman Z-Score: 1.04, in distress zone, indicating high bankruptcy risk.
- Piotroski Score: 4, average financial strength.
Oklo Inc. Scores
- Altman Z-Score: 339.43, in safe zone, indicating very low bankruptcy risk.
- Piotroski Score: 2, very weak financial strength.
Which company has the best scores?
Oklo has a much stronger Altman Z-Score, signaling financial safety, but a weaker Piotroski Score than Entergy. Entergy shows moderate financial strength but faces bankruptcy risk per Altman.
Grades Comparison
Here is a detailed comparison of the latest reliable grades for Entergy Corporation and Oklo Inc.:
Entergy Corporation Grades
The following table summarizes recent grades issued by reputable financial institutions for Entergy Corporation:
| Grading Company | Action | New Grade | Date |
|---|---|---|---|
| Argus Research | Maintain | Buy | 2026-01-06 |
| UBS | Maintain | Buy | 2025-12-17 |
| Keybanc | Maintain | Overweight | 2025-12-12 |
| JP Morgan | Maintain | Overweight | 2025-12-11 |
| Citigroup | Maintain | Neutral | 2025-11-18 |
| Evercore ISI Group | Maintain | In Line | 2025-10-30 |
| Mizuho | Maintain | Outperform | 2025-10-27 |
| Morgan Stanley | Maintain | Equal Weight | 2025-10-22 |
| B of A Securities | Maintain | Neutral | 2025-10-16 |
| Keybanc | Maintain | Overweight | 2025-10-15 |
Overall, Entergy Corporation’s grades predominantly indicate a positive outlook with consistent “Buy” and “Overweight” ratings maintained by multiple leading institutions.
Oklo Inc. Grades
Below is the table presenting recent grades from recognized grading firms for Oklo Inc.:
| Grading Company | Action | New Grade | Date |
|---|---|---|---|
| Seaport Global | Upgrade | Buy | 2025-12-08 |
| UBS | Maintain | Neutral | 2025-12-03 |
| B of A Securities | Maintain | Neutral | 2025-11-12 |
| B. Riley Securities | Maintain | Buy | 2025-11-12 |
| Wedbush | Maintain | Outperform | 2025-11-12 |
| B of A Securities | Downgrade | Neutral | 2025-09-30 |
| Seaport Global | Downgrade | Neutral | 2025-09-23 |
| Wedbush | Maintain | Outperform | 2025-09-22 |
| Wedbush | Maintain | Outperform | 2025-08-14 |
| Wedbush | Maintain | Outperform | 2025-08-12 |
The grades for Oklo Inc. show a mix of “Buy,” “Neutral,” and “Outperform” ratings with some recent upgrades and downgrades, reflecting a more varied analyst stance.
Which company has the best grades?
Entergy Corporation has consistently received stronger and more stable grades, mainly “Buy” and “Overweight,” compared to Oklo Inc.’s mixed ratings with some downgrades and neutral standings. This pattern suggests that Entergy’s outlook is viewed more favorably by analysts, potentially implying lower risk and steadier performance expectations for investors.
Strengths and Weaknesses
Below is a comparative table highlighting the main strengths and weaknesses of Entergy Corporation (ETR) and Oklo Inc. (OKLO) based on their latest financial and operational data.
| Criterion | Entergy Corporation (ETR) | Oklo Inc. (OKLO) |
|---|---|---|
| Diversification | Broad revenue base across Commercial (2.95B), Industrial (3.2B), Residential (4.5B), and Governmental segments with regulated electricity and natural gas | Limited diversification, primarily focused on nuclear technology development, no revenue segmentation reported |
| Profitability | Moderate net margin (8.93%), but declining ROIC (3.2%) below WACC (5.49%), indicating value destruction | Negative profitability with net margin 0%, ROIC -19.23%, and steeply declining profitability |
| Innovation | Traditional utility model with limited innovation indicators; stable but no growth moat | Innovative nuclear energy solutions but currently value destroying with very unfavorable moat metrics |
| Global presence | Primarily US-based utility operations with solid regional footprint | Early-stage company, no significant global presence yet |
| Market Share | Established player in US regulated utilities with steady revenue streams | Emerging player, market share negligible due to early development stage |
Key takeaways: Entergy shows steady revenue diversification but struggles with profitability and capital efficiency, reflecting value erosion. Oklo, while innovative, is still in early phases with significant losses and no proven market presence. Both carry high investment risks requiring cautious consideration.
Risk Analysis
Below is a comparative table of key risks for Entergy Corporation (ETR) and Oklo Inc. (OKLO) based on the latest 2024 data:
| Metric | Entergy Corporation (ETR) | Oklo Inc. (OKLO) |
|---|---|---|
| Market Risk | Moderate (Beta 0.65) | Moderate (Beta 0.77) |
| Debt level | High (D/E 1.91, 44.6% assets) | Very Low (D/E 0.01, 0.46% assets) |
| Regulatory Risk | Elevated (Nuclear/Environmental regulations) | Elevated (Nuclear licensing and recycling regulations) |
| Operational Risk | Medium (Ageing assets & nuclear decommissioning) | High (Early-stage technology and scale-up risks) |
| Environmental Risk | Moderate (Mixed energy sources including fossil fuels) | Moderate (Nuclear fuel recycling and waste concerns) |
| Geopolitical Risk | Low (US regional utility focus) | Low (US domestic operations) |
Entergy faces significant debt and regulatory challenges from its nuclear assets, with financial distress signals from its Altman Z-score. Oklo shows strong balance sheet health but is exposed to high operational and regulatory risks inherent to its innovative nuclear technology and low profitability. Investors should weigh Entergy’s financial strain against Oklo’s developmental risks carefully.
Which Stock to Choose?
Entergy Corporation (ETR) shows mixed income evolution with a 17.5% revenue growth over 2020-2024 but declining net margin and EPS. Its financial ratios are mostly unfavorable, including low ROE (7.02%) and high debt (D/E 1.91). Profitability is moderate with an 8.93% net margin, while debt levels and liquidity ratios are weak. Ratings are very favorable (B-), though the company is in the distress zone for bankruptcy risk and has a very unfavorable moat due to declining ROIC below WACC.
Oklo Inc. (OKLO) exhibits unfavorable income trends with no revenue growth and large net income declines. Financial ratios reveal significant challenges, including negative ROE (-29.35%) and low profitability, despite low debt and very high current ratio. The company holds a very favorable rating (C+), a safe zone Altman Z-score indicating low bankruptcy risk, but a very unfavorable moat with sharply declining ROIC far below WACC.
For investors, Entergy’s more established position with moderate profitability and very favorable ratings might appear more stable despite some financial weaknesses, while Oklo’s sharp losses and negative returns suggest higher risk but potentially appeal to those tolerant of volatility and seeking growth opportunities in earlier-stage firms. The choice could depend on whether an investor prioritizes relative stability or is willing to accept higher risk for possible growth.
Disclaimer: Investment carries a risk of loss of initial capital. The past performance is not a reliable indicator of future results. Be sure to understand risks before making an investment decision.
Go Further
I encourage you to read the complete analyses of Entergy Corporation and Oklo Inc. to enhance your investment decisions: