Home > Comparison > Utilities > NEE vs ETR
The strategic rivalry between NextEra Energy, Inc. and Entergy Corporation shapes the utilities sector’s future. NextEra operates as a capital-intensive leader in regulated electric power, heavily invested in renewable energy assets. In contrast, Entergy blends traditional nuclear and gas generation with regional utility services. This analysis explores which company’s operational model offers a superior risk-adjusted return, guiding investors seeking resilient exposure in a transitioning energy landscape.
Table of contents
Companies Overview
NextEra Energy and Entergy Corporation dominate the regulated electric utility landscape with strong regional footprints and diverse generation assets.
NextEra Energy, Inc.: Clean Energy Powerhouse
NextEra Energy leads as a major North American electric power generator. It earns revenue by producing and selling electricity through wind, solar, nuclear, coal, and natural gas plants. Its 2021 focus centers on expanding clean energy solutions, including renewable generation, battery storage, and electric transmission, serving 11 million people across Florida’s east and west coasts.
Entergy Corporation: Regional Utility with Nuclear Strength
Entergy Corporation operates as a regional electricity producer and retailer in the southern U.S. It generates income from utility services and wholesale power sales, leveraging gas, nuclear, coal, hydro, and solar plants. In 2021, Entergy emphasized nuclear plant operations and wholesale market participation while delivering power to 3 million customers in Arkansas, Louisiana, Mississippi, and Texas.
Strategic Collision: Similarities & Divergences
Both companies excel in regulated electric utilities with diversified generation portfolios. NextEra pursues a clean energy transition aggressively, while Entergy leans on its nuclear generation and regional utility dominance. The core battleground lies in renewable capacity expansion versus stable nuclear operations. These contrasting strategies reflect distinct risk profiles and growth trajectories in the evolving energy market.
Income Statement Comparison
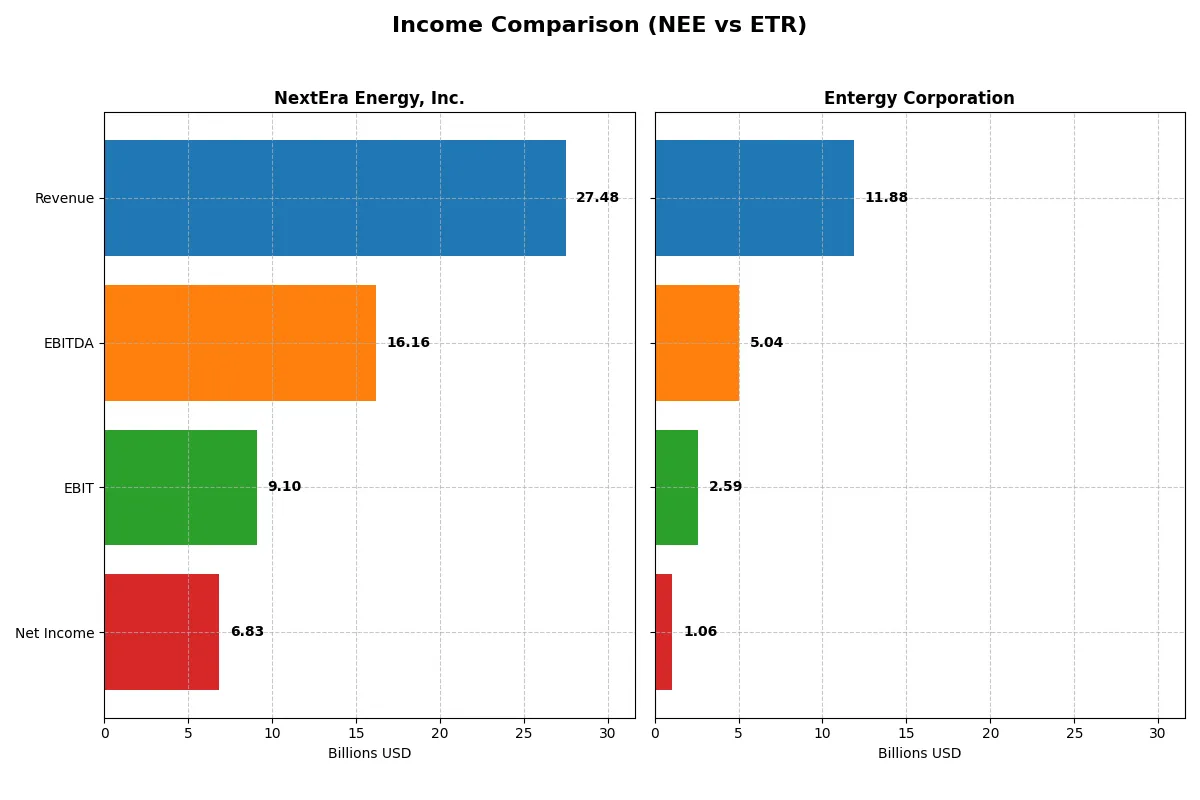
This data dissects the core profitability and scalability of both corporate engines to reveal who dominates the bottom line:
| Metric | NextEra Energy, Inc. (NEE) | Entergy Corporation (ETR) |
|---|---|---|
| Revenue | 27.5B | 11.9B |
| Cost of Revenue | 10.2B | 6.1B |
| Operating Expenses | 8.98B | 3.09B |
| Gross Profit | 17.3B | 5.7B |
| EBITDA | 16.2B | 5.0B |
| EBIT | 9.1B | 2.6B |
| Interest Expense | 4.57B | 1.15B |
| Net Income | 6.83B | 1.06B |
| EPS | 3.31 | 2.47 |
| Fiscal Year | 2025 | 2024 |
Income Statement Analysis: The Bottom-Line Duel
This income statement comparison reveals which company runs a more efficient and profitable business engine over recent years.
NextEra Energy, Inc. Analysis
NextEra Energy grows revenue steadily, reaching $27.5B in 2025, up 11% from 2024. Net income shows strong momentum despite a slight dip in 2025 to $6.8B. Gross margin holds a robust 62.8%, while net margin remains healthy at 24.9%. Despite rising interest expenses, EBIT margin stays favorable at 33.1%, signaling efficient cost control and solid profitability.
Entergy Corporation Analysis
Entergy’s revenue declined 2.2% to $11.9B in 2024 from the previous year, with net income falling sharply to $1.06B. Gross margin at 48.3% and EBIT margin of 21.8% are moderate but show some resilience. However, net margin dropped to 8.9%. Declining revenue and net income, combined with negative earnings per share growth, reflect weakening operational momentum and margin pressure.
Margin Strength vs. Revenue Growth
NextEra Energy clearly outperforms Entergy with superior revenue growth and healthier margins over the period. NextEra’s ability to expand net income by over 90% since 2021 contrasts sharply with Entergy’s net income decline of nearly 25%. For investors prioritizing scalable profitability and margin expansion, NextEra presents a more compelling fundamental profile.
Financial Ratios Comparison
These vital ratios act as a diagnostic tool to expose the underlying fiscal health, valuation premiums, and capital efficiency of the companies compared below:
| Ratios | NextEra Energy, Inc. (NEE) | Entergy Corporation (ETR) |
|---|---|---|
| ROE | 13.86% | 6.93% |
| ROIC | 4.04% | 3.19% |
| P/E | 21.23 | 30.56 |
| P/B | 2.94 | 2.12 |
| Current Ratio | 0.47 | 0.70 |
| Quick Ratio | 0.38 | 0.41 |
| D/E (Debt-to-Equity) | 1.64 | 1.92 |
| Debt-to-Assets | 43.3% | 45.2% |
| Interest Coverage | 3.35 | 2.30 |
| Asset Turnover | 0.13 | 0.18 |
| Fixed Asset Turnover | 0.18 | 0.25 |
| Payout ratio | 60.97% | 94.23% |
| Dividend yield | 2.87% | 3.08% |
| Fiscal Year | 2024 | 2024 |
Efficiency & Valuation Duel: The Vital Signs
Financial ratios serve as a company’s DNA, exposing hidden risks and operational strengths that guide investors’ decisions.
NextEra Energy, Inc.
NextEra Energy posts a neutral 13.9% ROE and a robust 28.1% net margin, signaling solid profitability. Its P/E ratio of 21.2 suggests fair valuation, neither stretched nor cheap. The firm rewards shareholders with a favorable 2.87% dividend yield, reflecting a balanced capital allocation between returns and reinvestment.
Entergy Corporation
Entergy displays a weaker 6.9% ROE and modest 8.9% net margin, indicating less operational efficiency. Its P/E ratio of 30.6 marks the stock as expensive relative to peers. Despite this, Entergy maintains a slightly higher dividend yield at 3.08%, showing commitment to shareholder income amid subdued profitability.
Profitability and Valuation: Balanced Strength vs. Premium Pricing
NextEra Energy offers a better blend of profitability and reasonable valuation, while Entergy’s premium multiple weighs against its weaker returns. Investors prioritizing steady operational efficiency may lean toward NextEra, whereas those seeking income at a higher price might consider Entergy’s profile.
Which one offers the Superior Shareholder Reward?
I see NextEra Energy (NEE) and Entergy Corporation (ETR) both pay dividends, but their approaches differ sharply. NEE yields about 2.87% with a payout ratio near 61%, signaling a balanced dividend supported by 104% of free cash flow coverage. Its buyback program is moderate but consistent, enhancing shareholder value sustainably. ETR offers a higher yield of 3.08% but with a payout ratio exceeding 94%, a red flag for dividend sustainability, especially since its free cash flow coverage is below 65%, reflecting stress. ETR maintains aggressive buybacks, yet its weaker cash flow and higher leverage undermine long-term distribution safety. Historically, I’ve observed that utilities with balanced dividend payout and solid buybacks like NEE outperform during market cycles. For 2026, NEE’s disciplined capital allocation and sustainable yield offer a superior total return profile compared to ETR’s riskier payout and cash flow dynamics.
Comparative Score Analysis: The Strategic Profile
The radar chart reveals the fundamental DNA and strategic trade-offs of NextEra Energy, Inc. and Entergy Corporation:
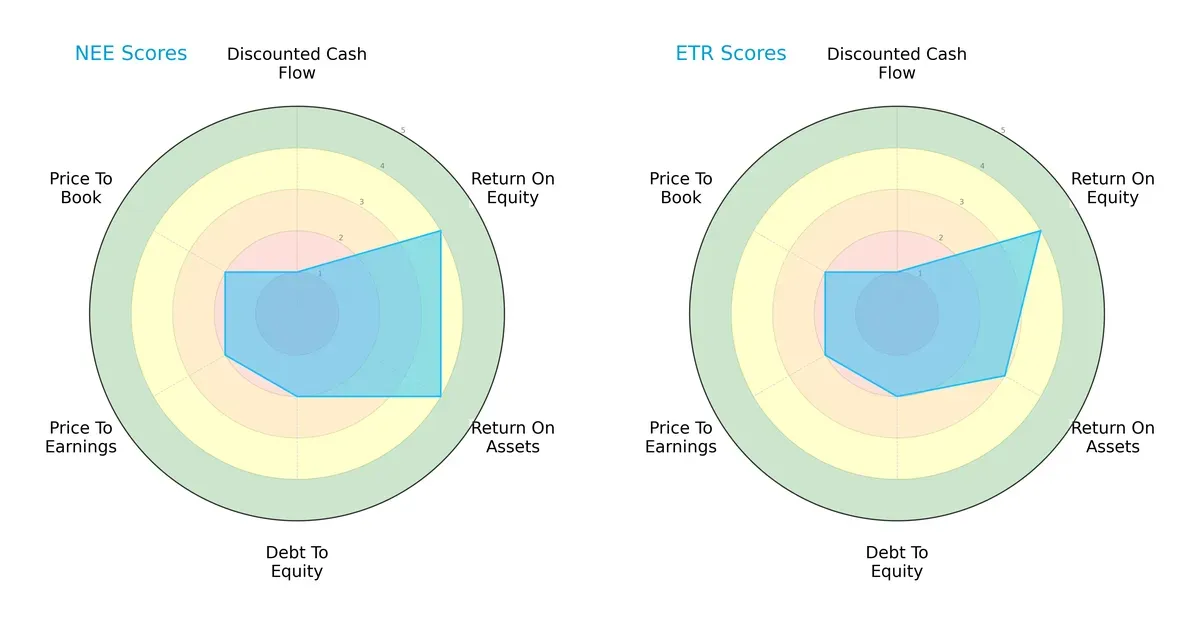
NextEra Energy shows a stronger balance in profitability metrics, scoring 4 in ROE and ROA, compared to Entergy’s 4 and 3, respectively. Both firms struggle with discounted cash flow valuation, scoring low at 1. Debt-to-equity and valuation metrics remain moderate and similar for both, but NextEra edges out with a slightly more balanced overall score of 3 versus Entergy’s 2. Entergy relies more on its ROE strength, while NextEra maintains consistent operational efficiency.
Bankruptcy Risk: Solvency Showdown
The Altman Z-Score comparison reveals both NextEra and Entergy are in the distress zone, indicating elevated bankruptcy risk in this cycle:
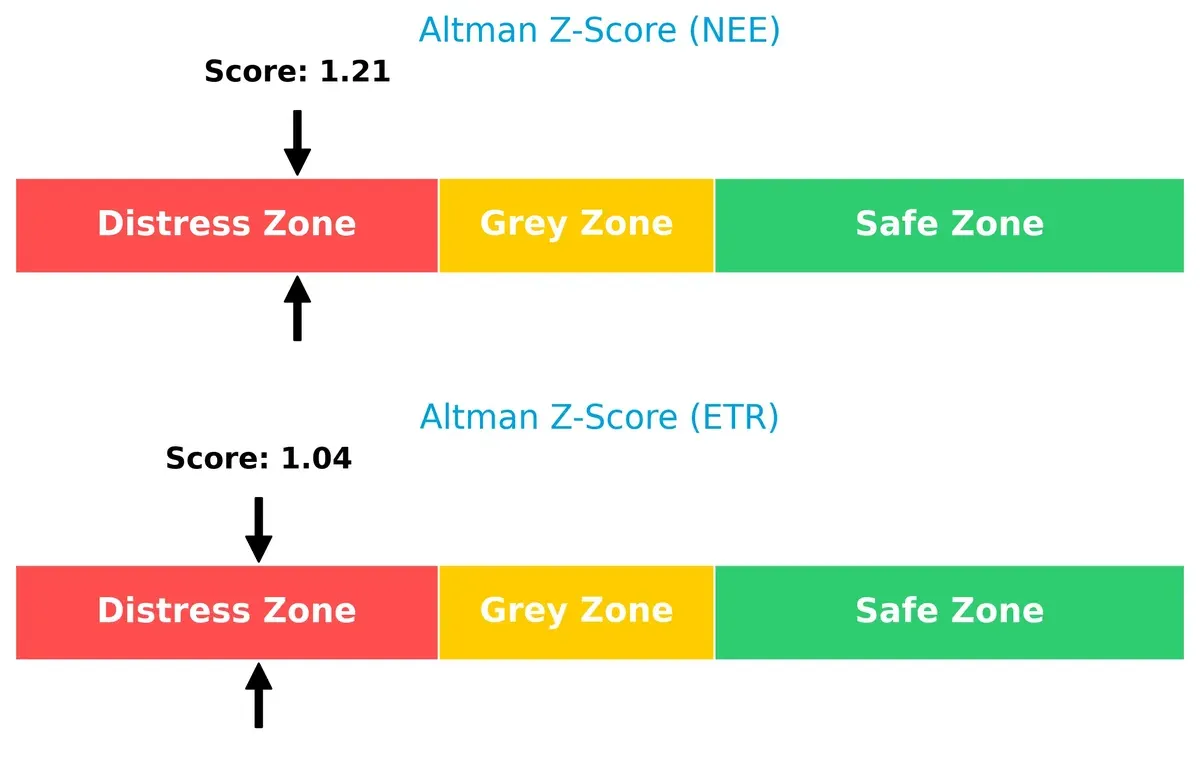
NextEra’s score of 1.21 marginally surpasses Entergy’s 1.04, but both remain below the 1.8 distress threshold. This suggests neither company is currently financially robust enough to confidently weather prolonged stress without strategic adjustments.
Financial Health: Quality of Operations
NextEra demonstrates stronger operational health with a Piotroski F-Score of 6, whereas Entergy trails at 4, both categorized as average:
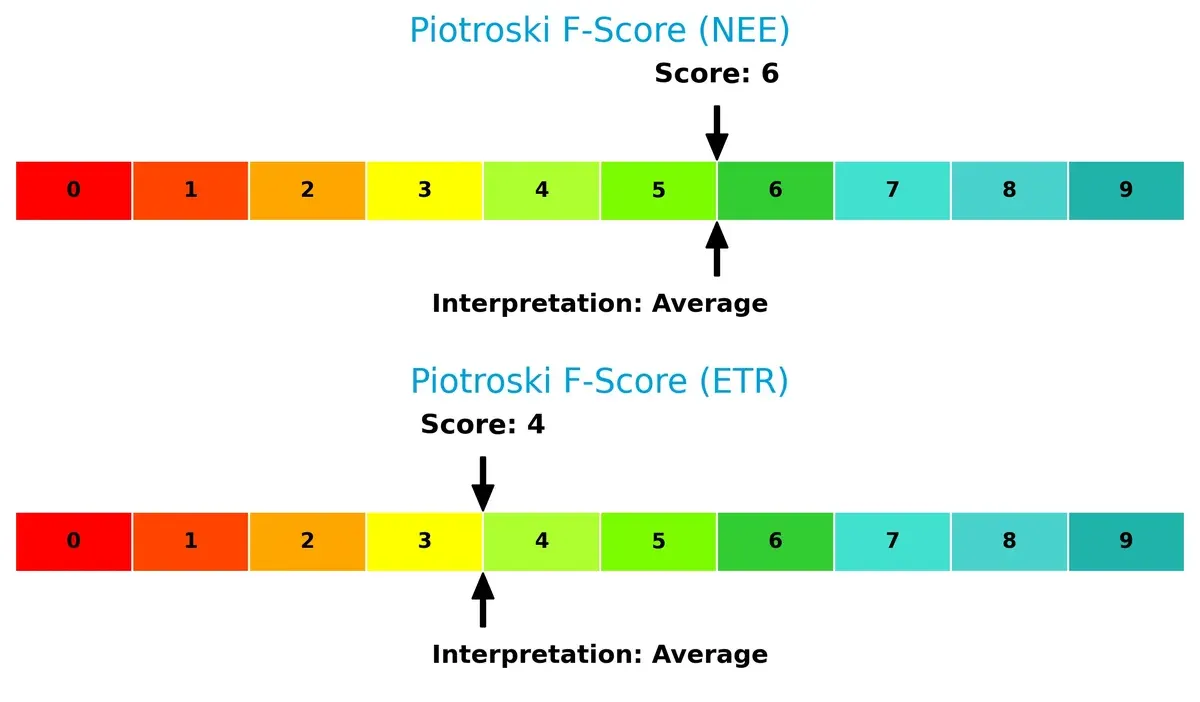
NextEra’s higher F-Score reflects better profitability, liquidity, and efficiency metrics, signaling fewer internal red flags. Entergy’s lower score highlights potential concerns in internal financial controls and asset management, warranting cautious monitoring.
How are the two companies positioned?
This section dissects the operational DNA of NextEra Energy and Entergy by comparing their revenue distribution by segment and internal dynamics. The goal is to confront their economic moats, identifying which model offers the most resilient competitive advantage today.
Revenue Segmentation: The Strategic Mix
This visual comparison dissects how NextEra Energy and Entergy diversify their income streams and reveals their primary sector bets for 2024:
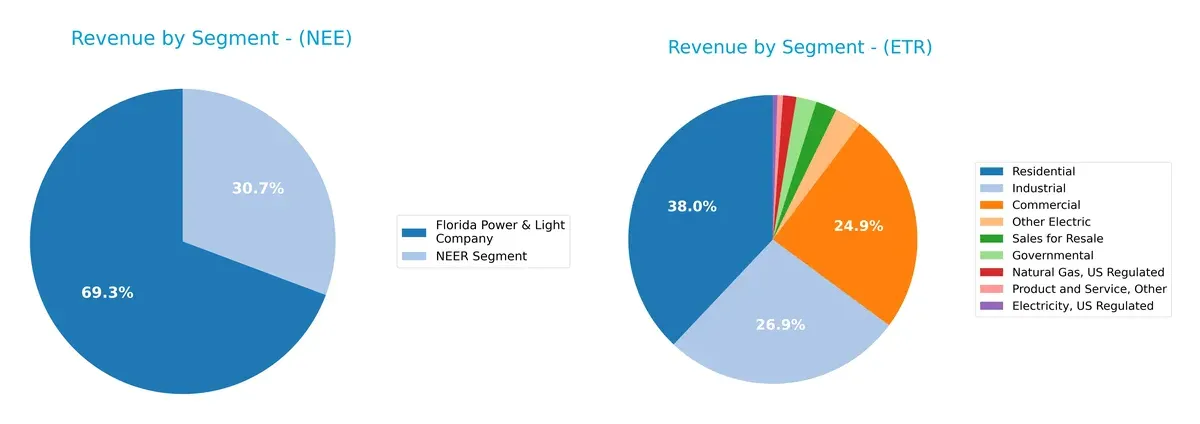
NextEra Energy anchors its revenue in two major segments: Florida Power & Light at $17B and NEER at $7.5B, showing some diversification but with heavy reliance on its flagship utility. Entergy, by contrast, splits revenue more evenly across Residential ($4.5B), Industrial ($3.2B), and Commercial ($3B) segments, reflecting a broader customer base. NextEra’s concentrated structure signals infrastructure dominance, while Entergy’s mix reduces concentration risk but may limit ecosystem lock-in.
Strengths and Weaknesses Comparison
This table compares the Strengths and Weaknesses of NextEra Energy and Entergy Corporation:
NextEra Energy Strengths
- Strong net margin at 28.06%
- Favorable WACC at 6.4%
- Consistent dividend yield near 2.87%
- Large, diversified revenue streams across power segments
- Neutral ROE and valuation metrics
Entergy Corporation Strengths
- Favorable WACC at 5.5%
- Stable dividend yield at 3.08%
- Neutral interest coverage ratio
- Diversified commercial, residential, and industrial revenues
- Neutral PB ratio
NextEra Energy Weaknesses
- Unfavorable ROIC below WACC at 4.04%
- Low current and quick ratios below 0.5
- High debt-to-equity at 1.64
- Weak asset and fixed asset turnover
- Interest coverage under 2
Entergy Corporation Weaknesses
- Unfavorable ROE at 6.93%
- Higher debt-to-equity at 1.92
- Elevated P/E ratio of 30.56
- Low current and quick ratios below 1
- Unfavorable asset turnover
NextEra Energy excels in profitability and dividend consistency but faces liquidity and asset efficiency challenges. Entergy shows strengths in cost of capital and revenue diversification but struggles with profitability and leverage. Both companies must balance capital structure and operational efficiency to enhance their competitive positioning.
The Moat Duel: Analyzing Competitive Defensibility
A structural moat is the only reliable shield protecting long-term profits from relentless competition erosion. Let’s dissect two utilities’ moats:
NextEra Energy, Inc.: Innovation-Driven Renewable Moat
NextEra leverages intangible assets and scale in renewables, reflected in strong gross (63%) and EBIT margins (33%). However, declining ROIC signals value destruction, risking moat erosion despite growth in clean energy projects in 2026.
Entergy Corporation: Nuclear and Regional Utility Moat
Entergy’s moat rests on nuclear assets and regional utility dominance, with stable margins but weaker growth. Its ROIC also declines, indicating inefficiencies. Expansion opportunities in wholesale commodities remain limited compared to NextEra’s innovation pipeline.
Innovation Scale vs. Asset Stability: Who Holds the Deeper Moat?
Both firms currently destroy value with declining ROICs, a red flag in utilities where capital efficiency is crucial. NextEra’s higher margins and growth in renewables suggest a wider moat, but its value destruction tempers optimism. Entergy’s stable but lower margins and shrinking earnings reveal a shallower moat. NextEra is better positioned to defend market share if it reverses profitability trends.
Which stock offers better returns?
NextEra Energy and Entergy Corporation both exhibit strong price growth over the past year, with notable highs and changing trading dynamics shaping their trajectories.
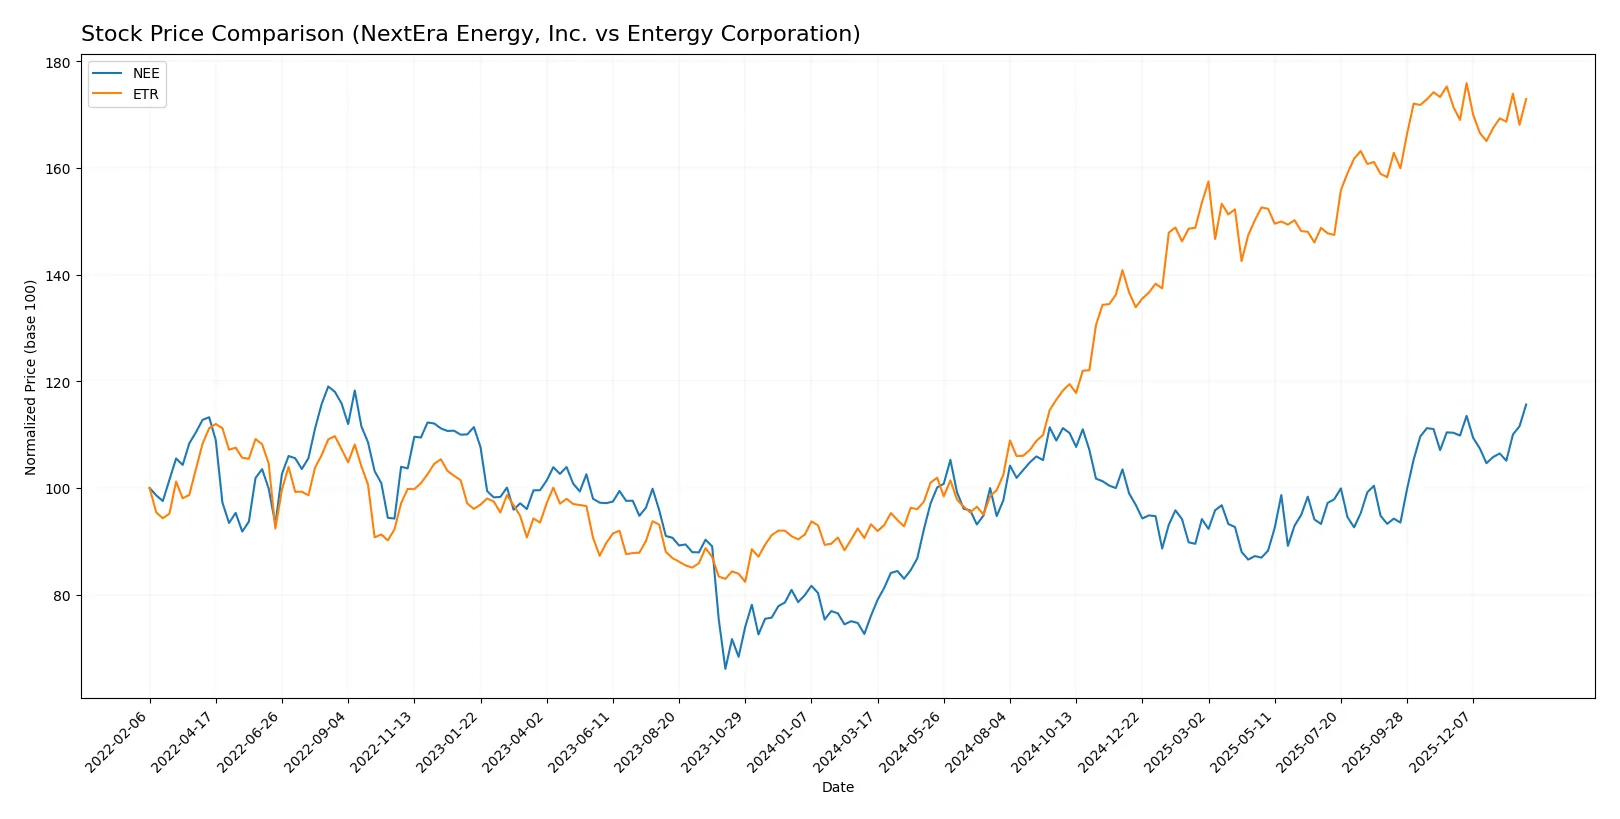
Trend Comparison
NextEra Energy’s stock rose 52.05% over the past 12 months, showing a bullish trend with decelerating momentum. It reached a high of 87.9 and a low of 57.81, with moderate volatility (6.42%).
Entergy Corporation’s stock gained 85.55% over the same period, also bullish but with decelerating acceleration. It recorded a high of 97.52 and a low of 50.98, exhibiting higher volatility (14.98%).
Entergy outperformed NextEra in total price appreciation, despite higher volatility and a recent trend near neutral, compared to NextEra’s modest positive slope.
Target Prices
Analyst consensus reveals moderate upside potential for both NextEra Energy and Entergy Corporation.
| Company | Target Low | Target High | Consensus |
|---|---|---|---|
| NextEra Energy, Inc. | 84 | 104 | 93.09 |
| Entergy Corporation | 91 | 112 | 102.75 |
NextEra Energy’s consensus target of 93.09 suggests slight appreciation from its current 87.9 price. Entergy’s 102.75 target indicates a stronger expected upside versus its 95.89 stock price. Both show analyst confidence in regulated utilities’ steady growth.

Don’t Let Luck Decide Your Entry Point
Optimize your entry points with our advanced ProRealTime indicators. You’ll get efficient buy signals with precise price targets for maximum performance. Start outperforming now!
How do institutions grade them?
NextEra Energy, Inc. Grades
Here are the latest institutional grades for NextEra Energy, Inc.:
| Grading Company | Action | New Grade | Date |
|---|---|---|---|
| Mizuho | Maintain | Neutral | 2026-01-28 |
| Argus Research | Maintain | Buy | 2026-01-28 |
| BMO Capital | Maintain | Outperform | 2026-01-27 |
| Wells Fargo | Maintain | Overweight | 2026-01-20 |
| Barclays | Maintain | Equal Weight | 2026-01-15 |
| Jefferies | Maintain | Hold | 2025-12-31 |
| UBS | Maintain | Buy | 2025-12-17 |
| JP Morgan | Maintain | Overweight | 2025-12-11 |
| BMO Capital | Maintain | Outperform | 2025-12-10 |
| UBS | Maintain | Buy | 2025-12-10 |
Entergy Corporation Grades
Here are the latest institutional grades for Entergy Corporation:
| Grading Company | Action | New Grade | Date |
|---|---|---|---|
| Wells Fargo | Maintain | Overweight | 2026-01-20 |
| Barclays | Maintain | Overweight | 2026-01-15 |
| Argus Research | Maintain | Buy | 2026-01-06 |
| UBS | Maintain | Buy | 2025-12-17 |
| Keybanc | Maintain | Overweight | 2025-12-12 |
| JP Morgan | Maintain | Overweight | 2025-12-11 |
| Citigroup | Maintain | Neutral | 2025-11-18 |
| Evercore ISI Group | Maintain | In Line | 2025-10-30 |
| Mizuho | Maintain | Outperform | 2025-10-27 |
| Morgan Stanley | Maintain | Equal Weight | 2025-10-22 |
Which company has the best grades?
NextEra Energy holds mostly “Buy,” “Outperform,” and “Overweight” grades, indicating strong institutional confidence. Entergy also shows solid support, with several “Overweight” and “Buy” ratings but fewer top-tier grades. Investors may view NextEra’s consistently higher grades as a signal of stronger analyst endorsement.
Risks specific to each company
The following categories identify critical pressure points and systemic threats facing both firms in the 2026 market environment:
1. Market & Competition
NextEra Energy, Inc. (NEE)
- Faces intense competition in renewable energy markets; maintains scale advantage with 28,564 MW capacity.
Entergy Corporation (ETR)
- Operates regionally with 26,000 MW capacity; nuclear segment adds complexity amid shifting market dynamics.
2. Capital Structure & Debt
NextEra Energy, Inc. (NEE)
- High debt-to-equity ratio (1.64) and weak interest coverage (1.99) raise financial risk concerns.
Entergy Corporation (ETR)
- Higher leverage (1.92 D/E) with moderate interest coverage (2.25); balance sheet remains pressured but slightly steadier.
3. Stock Volatility
NextEra Energy, Inc. (NEE)
- Beta of 0.73 indicates moderate volatility; stock ranges between $61.72 and $89.19.
Entergy Corporation (ETR)
- Lower beta at 0.65 suggests less volatility; trading range tighter between $75.57 and $98.58.
4. Regulatory & Legal
NextEra Energy, Inc. (NEE)
- Faces evolving renewable energy regulations; nuclear licensing risks are limited.
Entergy Corporation (ETR)
- Nuclear operations expose company to stricter regulatory scrutiny and decommissioning liabilities.
5. Supply Chain & Operations
NextEra Energy, Inc. (NEE)
- Operates extensive transmission network (77,000 circuit miles) with reliance on clean tech supply chains.
Entergy Corporation (ETR)
- Regional operations face potential supply constraints; nuclear plant upkeep demands specialized supply chains.
6. ESG & Climate Transition
NextEra Energy, Inc. (NEE)
- Strong ESG positioning via renewable projects and battery storage investments; climate transition aligned.
Entergy Corporation (ETR)
- Climate risk heightened by nuclear and fossil fuel plants; slower pivot to renewables impacts ESG credentials.
7. Geopolitical Exposure
NextEra Energy, Inc. (NEE)
- Primarily US-focused with operations concentrated in Florida; limited geopolitical risks.
Entergy Corporation (ETR)
- Operates in four southern states; regional weather events and policy shifts pose moderate geopolitical challenges.
Which company shows a better risk-adjusted profile?
NextEra Energy’s greatest risk is its stretched capital structure and weak liquidity ratios, raising financial distress concerns. Entergy’s main vulnerability lies in regulatory and operational risks tied to its nuclear assets. Despite both firms showing financial stress signals (Altman Z-scores in distress zones), NextEra’s scale and superior ESG stance offer a more balanced risk profile. Notably, NextEra’s interest coverage below 2 signals urgent attention is needed to manage debt service amid market pressures.
Final Verdict: Which stock to choose?
NextEra Energy’s superpower lies in its robust revenue growth and strong income quality, positioning it as a cash-generating engine despite some pressure on capital returns. The company’s low liquidity ratios signal a point of vigilance for risk-sensitive investors. It suits an aggressive growth portfolio willing to tolerate short-term operational challenges.
Entergy Corporation’s strategic moat is its consistent dividend yield combined with a solid income quality profile, offering a safer harbor relative to NextEra. While growth has slowed and profitability pressures persist, its defensive characteristics appeal to investors favoring income stability. It fits well in a GARP portfolio balancing growth with reasonable risk.
If you prioritize dynamic growth supported by strong income momentum, NextEra outshines due to its superior scale and market presence. However, if you seek better stability with an emphasis on income and capital preservation, Entergy offers a more conservative profile. Both face profitability headwinds, making risk management critical for either choice.
Disclaimer: Investment carries a risk of loss of initial capital. The past performance is not a reliable indicator of future results. Be sure to understand risks before making an investment decision.
Go Further
I encourage you to read the complete analyses of NextEra Energy, Inc. and Entergy Corporation to enhance your investment decisions: