Entergy Corporation (ETR) and FirstEnergy Corp. (FE) are two key players in the regulated electric utilities sector, each with substantial market presence and diverse energy portfolios. Both companies focus on generating and distributing electricity through a mix of traditional and renewable sources, serving millions of customers across different U.S. regions. By comparing their market strategies and operational strengths, I will help you identify which stock might be the better fit for your investment portfolio.
Table of contents
Companies Overview
I will begin the comparison between Entergy Corporation and FirstEnergy Corp. by providing an overview of these two companies and their main differences.
Entergy Overview
Entergy Corporation operates in the regulated electric industry, focusing on the production and retail distribution of electricity in the U.S. It serves 3 million utility customers across Arkansas, Louisiana, Mississippi, and Texas. Entergy generates power through gas, nuclear, coal, hydro, and solar sources, with approximately 26,000 MW of generation capacity, including 6,000 MW from nuclear plants. The company was founded in 1913 and is headquartered in New Orleans.
FirstEnergy Overview
FirstEnergy Corp. is a U.S.-based utility company serving around 6 million customers in Ohio, Pennsylvania, West Virginia, Maryland, New Jersey, and New York. It operates coal-fired, nuclear, hydroelectric, natural gas, wind, and solar power plants, alongside extensive transmission and distribution networks totaling over 297,000 miles. Founded in 1996 and headquartered in Akron, Ohio, FirstEnergy focuses on regulated distribution and transmission segments.
Key similarities and differences
Both Entergy and FirstEnergy operate in the regulated electric industry, generating electricity from diverse sources including nuclear and renewables. Each company manages significant transmission and distribution infrastructure. Their key difference lies in geographic focus and customer base size: Entergy serves 3 million customers in the South Central U.S., while FirstEnergy reaches 6 million customers in the Mid-Atlantic and Northeast. Their generation capacities and operational segments also reflect regional market demands.
Income Statement Comparison
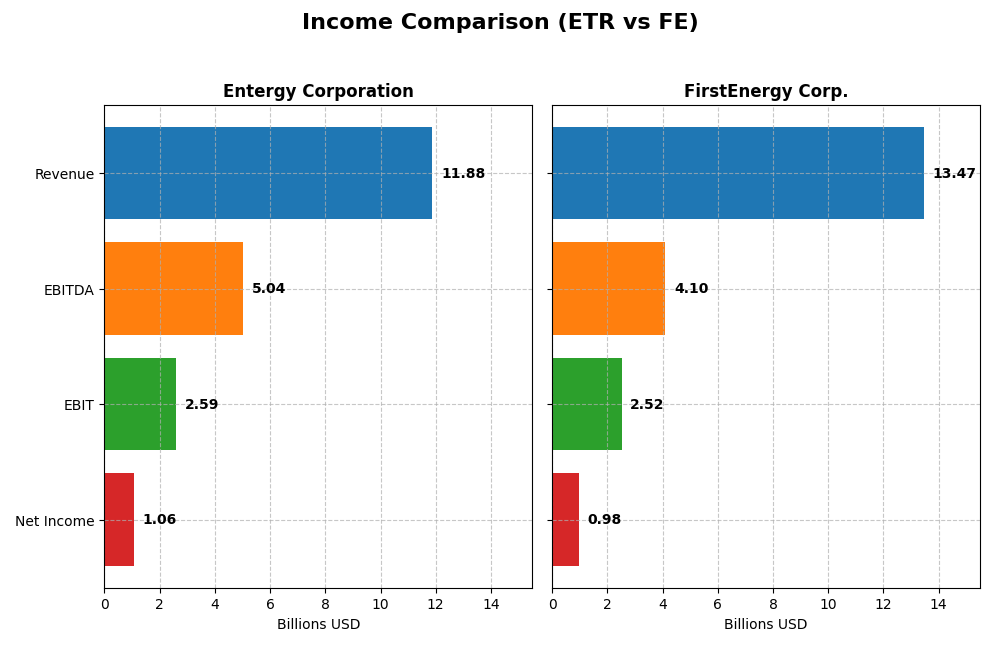
Below is a side-by-side comparison of key income statement metrics for Entergy Corporation and FirstEnergy Corp. for the fiscal year 2024.
| Metric | Entergy Corporation | FirstEnergy Corp. |
|---|---|---|
| Market Cap | 41.8B | 25.8B |
| Revenue | 11.9B | 13.5B |
| EBITDA | 5.04B | 4.10B |
| EBIT | 2.59B | 2.52B |
| Net Income | 1.06B | 978M |
| EPS | 2.47 | 1.7 |
| Fiscal Year | 2024 | 2024 |
Income Statement Interpretations
Entergy Corporation
Entergy’s revenue showed a mixed trend from 2020 to 2024, peaking at $13.8B in 2022 before declining to $11.9B in 2024. Net income dropped significantly over the period, especially in 2024, falling to $1.06B from $2.36B in 2023. Margins remained generally favorable, with a stable gross margin around 48% but net margin decreased to 8.93% in 2024, indicating margin compression in the most recent year.
FirstEnergy Corp.
FirstEnergy’s revenue increased steadily from $10.8B in 2020 to $13.5B in 2024, reflecting a 24.9% growth over the period. Despite this, net income has declined overall, reaching $978M in 2024 from a peak above $1.28B in 2021. Gross margin remained strong at 67.5%, while net margin slipped to 7.26% in 2024. The latest year saw moderate revenue growth but a slight decline in net margin and earnings per share.
Which one has the stronger fundamentals?
Both companies show favorable gross and EBIT margins, but each faces challenges with declining net income and earnings per share over the period. Entergy exhibits stronger gross margin stability but experienced sharper net income volatility and margin contraction recently. FirstEnergy maintains a higher gross margin and steadier revenue growth but also suffers from shrinking profitability, reflecting mixed fundamentals for both.
Financial Ratios Comparison
The table below presents key financial ratios for Entergy Corporation (ETR) and FirstEnergy Corp. (FE) based on their latest fiscal year data ending in 2024, enabling a straightforward comparison of performance and financial health.
| Ratios | Entergy Corporation (ETR) | FirstEnergy Corp. (FE) |
|---|---|---|
| ROE | 7.0% | 7.9% |
| ROIC | 3.2% | 3.7% |
| P/E | 30.6 | 23.4 |
| P/B | 2.14 | 1.84 |
| Current Ratio | 0.72 | 0.56 |
| Quick Ratio | 0.43 | 0.45 |
| D/E (Debt to Equity) | 1.91 | 1.95 |
| Debt-to-Assets | 44.6% | 46.6% |
| Interest Coverage | 2.30 | 2.35 |
| Asset Turnover | 0.18 | 0.26 |
| Fixed Asset Turnover | 0.25 | 0.33 |
| Payout Ratio | 94.2% | 99.2% |
| Dividend Yield | 3.08% | 4.24% |
Interpretation of the Ratios
Entergy Corporation
Entergy shows several unfavorable ratios including return on equity at 7.02% and return on invested capital at 3.2%, signaling weaker profitability. Its current and quick ratios are below 1, indicating liquidity concerns. However, its dividend yield is favorable at 3.08%, supported by consistent dividend payments, though free cash flow coverage is negative, which may pressure sustainability.
FirstEnergy Corp.
FirstEnergy’s ratios reveal a mixed picture with a slightly better return on equity of 7.85% but still unfavorable. Liquidity ratios are weak, with a current ratio of 0.56 and quick ratio of 0.45. The company pays dividends with a higher yield of 4.24%, but negative free cash flow raises concerns about the long-term sustainability of these distributions and share buybacks.
Which one has the best ratios?
Both companies face challenges with profitability and liquidity ratios, though FirstEnergy has a marginally better return on equity and a higher dividend yield. Entergy’s lower return ratios and liquidity metrics weigh on its financial strength. Overall, both companies are rated unfavorable or slightly unfavorable, with neither showing a clear advantage in ratio quality.
Strategic Positioning
This section compares the strategic positioning of Entergy Corporation and FirstEnergy Corp., focusing on Market position, Key segments, and exposure to disruption:
Entergy Corporation
- Operates in regulated electric market with moderate competitive pressure in select southern US states.
- Key segments include Utility (electricity, natural gas) and Wholesale Commodities (nuclear, gas, coal, hydro, solar).
- Exposure to technological disruption moderate with diversified power sources including nuclear and renewables.
FirstEnergy Corp.
- Operates in regulated electric market serving six northeastern and mid-Atlantic states with competitive pressure.
- Focuses on Regulated Distribution and Transmission; power generation includes coal, nuclear, hydro, gas, wind, solar.
- Similar exposure with mix of traditional and renewable energy sources and extensive transmission infrastructure.
Entergy Corporation vs FirstEnergy Corp. Positioning
Entergy has a diversified business model combining utility and wholesale commodities across fewer states, while FirstEnergy concentrates on regulated distribution and transmission over a broader geographic area. Entergy’s mix includes more wholesale operations, FirstEnergy has larger customer base and infrastructure.
Which has the best competitive advantage?
Both companies show very unfavorable MOAT evaluations with declining ROIC below WACC, indicating value destruction and weakening competitive advantage in recent years. Neither currently demonstrates a sustainable economic moat based on the provided data.
Stock Comparison
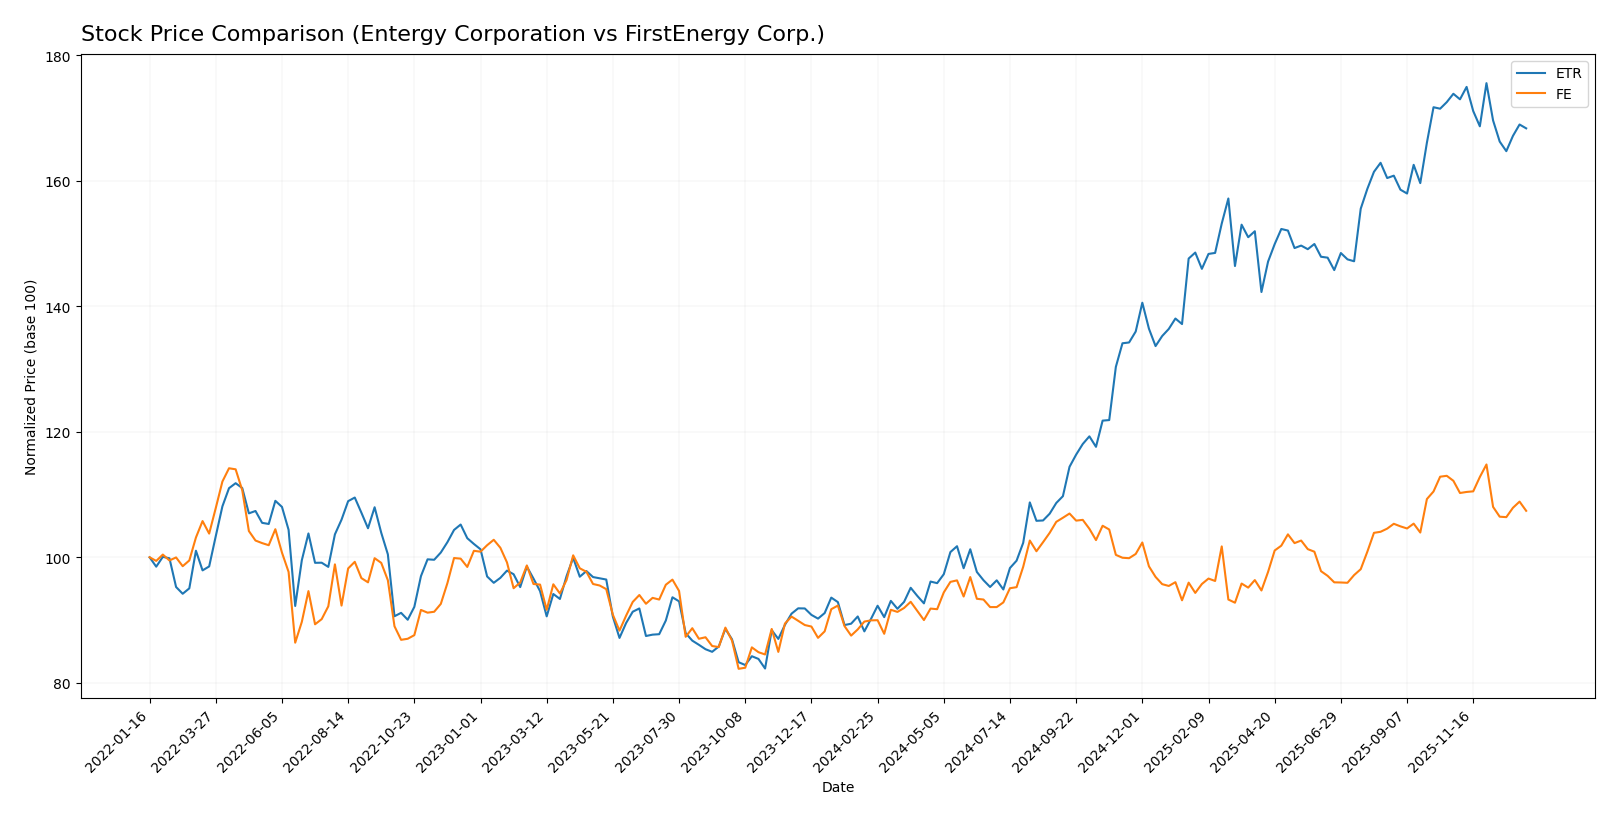
The stock prices of Entergy Corporation (ETR) and FirstEnergy Corp. (FE) have shown significant bullish momentum over the past 12 months, with notable deceleration in recent months amid seller dominance and decreasing trading volumes for ETR.
Trend Analysis
Entergy Corporation’s stock demonstrated a strong bullish trend over the past year, gaining 86.74%. The trend shows deceleration despite high volatility (std deviation 15.22), with a recent slight bearish movement of -3.17% from October 2025 to January 2026.
FirstEnergy Corp.’s stock also trended bullish over the 12-month period, rising 19.42%. The price movement decelerated with lower volatility (std deviation 2.64), and the recent trend indicates a mild bearish change of -4.27% during the same recent interval.
Comparing both, Entergy Corporation delivered the highest market performance with an 86.74% increase over the past year, outperforming FirstEnergy’s 19.42% gain despite both showing recent short-term declines.
Target Prices
The consensus target prices for Entergy Corporation and FirstEnergy Corp. reflect moderate upside potential according to analyst estimates.
| Company | Target High | Target Low | Consensus |
|---|---|---|---|
| Entergy Corporation | 115 | 91 | 103.17 |
| FirstEnergy Corp. | 54 | 46 | 49.29 |
Analysts expect Entergy’s stock to rise from its current 93.52 USD toward a consensus target of 103.17 USD, indicating moderate growth. FirstEnergy’s target of 49.29 USD also suggests a potential increase from the current 44.65 USD price point.
Analyst Opinions Comparison
This section compares analysts’ ratings and grades for Entergy Corporation and FirstEnergy Corp.:
Rating Comparison
ETR Rating
- Rating: B-, considered very favorable
- Discounted Cash Flow Score: 1, very unfavorable
- ROE Score: 4, favorable
- ROA Score: 3, moderate
- Debt To Equity Score: 2, moderate
- Overall Score: 2, moderate
FE Rating
- Rating: B, considered very favorable
- Discounted Cash Flow Score: 4, favorable
- ROE Score: 4, favorable
- ROA Score: 3, moderate
- Debt To Equity Score: 1, very unfavorable
- Overall Score: 3, moderate
Which one is the best rated?
Based strictly on the data, FE has a higher overall score and better discounted cash flow rating, but a worse debt to equity score. ETR has a lower overall rating and score but better debt to equity. FE is better rated overall.
Scores Comparison
Here is a comparison of Entergy Corporation and FirstEnergy Corp. scores:
Entergy Corporation Scores
- Altman Z-Score: 1.04, indicating financial distress.
- Piotroski Score: 4, reflecting average financial health.
FirstEnergy Corp. Scores
- Altman Z-Score: 0.78, indicating financial distress.
- Piotroski Score: 6, reflecting average financial health.
Which company has the best scores?
FirstEnergy has a lower Altman Z-Score than Entergy, both in distress zones, but a higher Piotroski Score, suggesting stronger financial health based on the data provided.
Grades Comparison
Here is a detailed comparison of the latest reliable grades for Entergy Corporation and FirstEnergy Corp.:
Entergy Corporation Grades
The table below summarizes recent grades from established grading companies for Entergy Corporation.
| Grading Company | Action | New Grade | Date |
|---|---|---|---|
| Argus Research | Maintain | Buy | 2026-01-06 |
| UBS | Maintain | Buy | 2025-12-17 |
| Keybanc | Maintain | Overweight | 2025-12-12 |
| JP Morgan | Maintain | Overweight | 2025-12-11 |
| Citigroup | Maintain | Neutral | 2025-11-18 |
| Evercore ISI Group | Maintain | In Line | 2025-10-30 |
| Mizuho | Maintain | Outperform | 2025-10-27 |
| Morgan Stanley | Maintain | Equal Weight | 2025-10-22 |
| B of A Securities | Maintain | Neutral | 2025-10-16 |
| Keybanc | Maintain | Overweight | 2025-10-15 |
Entergy’s grades predominantly indicate a positive outlook, with multiple buy and overweight ratings and no downgrades reported.
FirstEnergy Corp. Grades
The following table shows recent grades from recognized grading firms for FirstEnergy Corp.
| Grading Company | Action | New Grade | Date |
|---|---|---|---|
| UBS | Maintain | Neutral | 2025-12-17 |
| Mizuho | Maintain | Neutral | 2025-10-24 |
| Scotiabank | Maintain | Sector Outperform | 2025-10-24 |
| UBS | Maintain | Neutral | 2025-10-24 |
| Morgan Stanley | Maintain | Overweight | 2025-10-21 |
| Jefferies | Maintain | Hold | 2025-10-21 |
| Keybanc | Downgrade | Sector Weight | 2025-10-15 |
| Scotiabank | Maintain | Sector Outperform | 2025-10-06 |
| Morgan Stanley | Maintain | Overweight | 2025-09-25 |
| Barclays | Upgrade | Overweight | 2025-08-25 |
FirstEnergy’s grades are mixed, featuring several neutral and hold ratings, a downgrade by Keybanc, but also some overweight and sector outperform ratings.
Which company has the best grades?
Entergy Corporation holds a stronger consensus with predominantly buy and overweight ratings, suggesting a generally more positive analyst sentiment than FirstEnergy Corp., which has a more cautious consensus dominated by neutral and hold grades. This disparity may influence investor confidence and portfolio positioning differently for each company.
Strengths and Weaknesses
Below is a comparison of Entergy Corporation (ETR) and FirstEnergy Corp. (FE) based on key financial and strategic criteria as of 2024.
| Criterion | Entergy Corporation (ETR) | FirstEnergy Corp. (FE) |
|---|---|---|
| Diversification | Moderate diversification across residential, industrial, commercial sectors with some gas and resale sales totaling over 15B USD | Primarily focused on regulated distribution and transmission, less diversified, about 8.5B USD in core segments |
| Profitability | Net margin 8.93% (neutral), ROIC 3.2% (unfavorable), declining returns, value destroying | Net margin 7.26% (neutral), ROIC 3.66% (unfavorable), also declining returns, value destroying |
| Innovation | Limited recent innovation indicated, focus on regulated utilities and traditional electric/gas | Similar conservative approach with regulated utilities, limited signs of innovation |
| Global presence | Primarily US-based utility operations, regional focus | US regional utility with no significant global footprint |
| Market Share | Strong presence in US regulated utility markets with stable customer base | Strong in certain US regions but less diversified market share |
Key takeaways: Both Entergy and FirstEnergy show challenges in profitability with declining ROIC and value destruction, indicating caution. Entergy benefits from more diversified revenue streams, while FirstEnergy shows slightly better ROIC but remains similarly constrained by limited innovation and regional focus. Investors should consider these weaknesses carefully in risk management.
Risk Analysis
Below is a comparison of key risk factors for Entergy Corporation (ETR) and FirstEnergy Corp. (FE) based on 2024 financial and operational data:
| Metric | Entergy Corporation (ETR) | FirstEnergy Corp. (FE) |
|---|---|---|
| Market Risk | Beta 0.65 – moderate volatility | Beta 0.63 – moderate volatility |
| Debt Level | Debt/Equity 1.91 – high leverage | Debt/Equity 1.95 – high leverage |
| Regulatory Risk | High – operates in multiple regulated states | High – serves several states with complex regulations |
| Operational Risk | Moderate – diverse power sources including nuclear | Moderate – coal and nuclear dependency, aging infrastructure |
| Environmental Risk | Elevated – nuclear and fossil fuel plants | Elevated – coal reliance and environmental compliance pressures |
| Geopolitical Risk | Low – primarily US-focused | Low – primarily US-focused |
The most impactful risks are the high debt levels for both companies, increasing financial vulnerability, and regulatory pressures in the utilities sector. Entergy’s diversified energy mix somewhat mitigates operational risk, whereas FirstEnergy faces challenges from legacy coal assets. Both companies remain exposed to environmental regulations that could affect future costs and operations.
Which Stock to Choose?
Entergy Corporation (ETR) shows mixed financial evolution with a declining revenue growth of -2.2% in 2024 but a favorable gross margin at 48.3%. Its profitability ratios like ROE (7.02%) and ROIC (3.2%) are unfavorable, and it carries a high net debt to EBITDA ratio of 5.57. The company’s overall financial ratios evaluation is unfavorable, though it holds a very favorable rating of B-. Its economic moat assessment is very unfavorable, indicating value destruction with declining ROIC.
FirstEnergy Corp. (FE) experienced a moderate 4.68% revenue growth in 2024 and maintains a strong gross margin of 67.52%. Profitability ratios such as ROE (7.85%) and ROIC (3.66%) remain unfavorable, with a net debt to EBITDA ratio of 5.89. FE’s financial ratios evaluation is slightly unfavorable, paired with a very favorable rating of B. Its economic moat is also very unfavorable, reflecting declining profitability and value erosion.
Investors seeking growth might find FE’s more favorable income trends and slightly better financial ratios appealing, whereas those prioritizing rating strength may consider ETR’s solid overall rating despite its income challenges. Both companies display very unfavorable moats, suggesting caution in terms of sustainable value creation, and the choice could depend on risk tolerance and investment strategy preferences.
Disclaimer: Investment carries a risk of loss of initial capital. The past performance is not a reliable indicator of future results. Be sure to understand risks before making an investment decision.
Go Further
I encourage you to read the complete analyses of Entergy Corporation and FirstEnergy Corp. to enhance your investment decisions: