In the evolving landscape of regulated electric utilities, Exelon Corporation (EXC) and Entergy Corporation (ETR) stand out as major players shaping the industry’s future. Both companies operate extensive power generation and distribution networks across the United States, leveraging diverse energy sources including nuclear and renewables. Their innovative strategies and market overlap make them compelling candidates for comparison. Join me as we analyze these utilities to identify which offers the most attractive investment opportunity today.
Table of contents
Companies Overview
I will begin the comparison between Exelon and Entergy by providing an overview of these two companies and their main differences.
Exelon Overview
Exelon Corporation is a utility services holding company engaged in energy generation, delivery, and marketing across the US and Canada. It owns diverse generating facilities including nuclear, fossil, wind, hydroelectric, biomass, and solar. Exelon also sells electricity, natural gas, and renewable energy to wholesale and retail customers, offering extensive support services in operations and asset management. The company is headquartered in Chicago and employs about 20,000 staff.
Entergy Overview
Entergy Corporation operates in electricity production and retail distribution primarily in Arkansas, Louisiana, Mississippi, and Texas. It has two segments: Utility, which serves 3 million customers with electric power and natural gas, and Entergy Wholesale Commodities, focused on nuclear and non-nuclear power plants. Entergy generates electricity from gas, nuclear, coal, hydro, and solar sources, with approximately 26,000 MW capacity. The company is based in New Orleans with 12,000 employees.
Key similarities and differences
Both Exelon and Entergy operate in the regulated electric utility sector with diversified energy generation portfolios including nuclear and renewable sources. Exelon has a broader geographic presence across the US and Canada, while Entergy focuses on the southern US. Exelon offers additional energy-related products and support services, whereas Entergy has a distinct wholesale commodities segment managing nuclear plant operations and decommissioning. Market caps are comparable, with Exelon at $44B and Entergy at $42B.
Income Statement Comparison
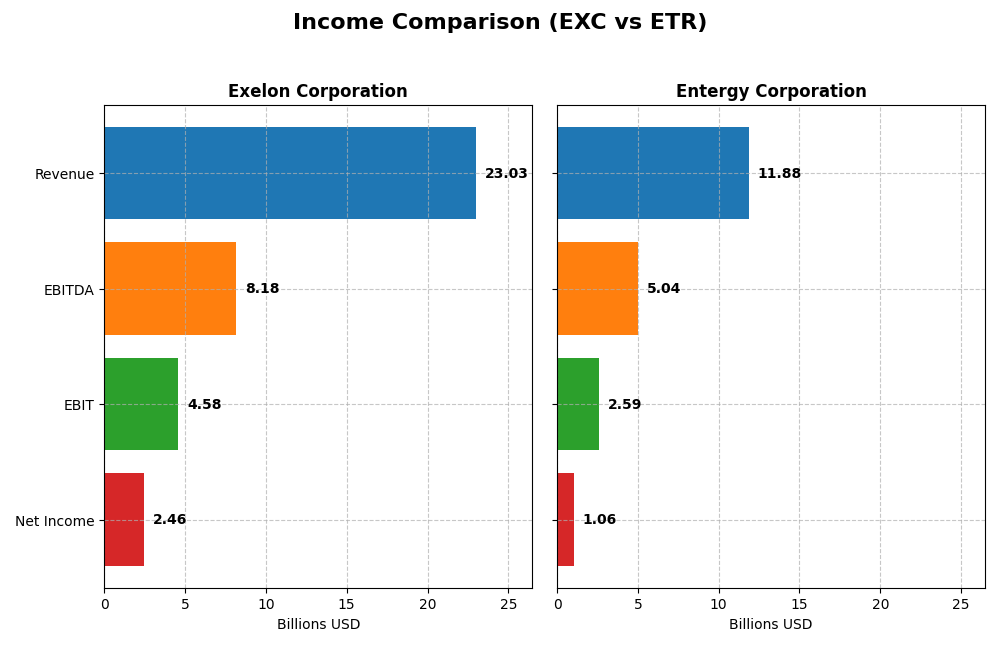
The table below compares key income statement metrics for Exelon Corporation and Entergy Corporation for the fiscal year 2024, providing a snapshot of their financial performance.
| Metric | Exelon Corporation | Entergy Corporation |
|---|---|---|
| Market Cap | 43.8B | 41.8B |
| Revenue | 23.0B | 11.9B |
| EBITDA | 8.2B | 5.0B |
| EBIT | 4.6B | 2.6B |
| Net Income | 2.46B | 1.06B |
| EPS | 2.45 | 2.47 |
| Fiscal Year | 2024 | 2024 |
Income Statement Interpretations
Exelon Corporation
Exelon’s revenue showed a mixed trend, with a notable decline over the 2020-2024 period but a modest 6% increase in the latest year to $23B. Net income grew by 25% overall, reaching $2.46B in 2024. Margins improved, with a gross margin of 40.8% and net margin of 10.7%, although net margin slightly contracted in the latest year. The company maintained favorable profitability despite revenue fluctuations.
Entergy Corporation
Entergy’s revenue increased by 17.5% over the period but fell 2.2% in 2024 to about $11.9B. Net income, however, declined by 25% overall, dropping to $1.06B in 2024. Margins remain solid with a gross margin of 48.3% and EBIT margin of 21.8%, but net margin contracted sharply by 54% in the latest year. Earnings per share also suffered significant declines, reflecting recent operational challenges.
Which one has the stronger fundamentals?
Exelon’s fundamentals appear stronger, supported by overall net income growth and margin expansion despite recent revenue headwinds. Its income statement shows a favorable momentum in profitability metrics and controlled expenses. Entergy faces more challenges, with declining net income, margins, and EPS recently, signaling weaker operational performance despite revenue growth over the longer term.
Financial Ratios Comparison
The table below presents a side-by-side comparison of key financial ratios for Exelon Corporation (EXC) and Entergy Corporation (ETR) based on their most recent fiscal year 2024 data.
| Ratios | Exelon Corporation (EXC) | Entergy Corporation (ETR) |
|---|---|---|
| ROE | 9.14% | 7.02% |
| ROIC | 3.93% | 3.20% |
| P/E | 15.35 | 30.56 |
| P/B | 1.40 | 2.14 |
| Current Ratio | 0.87 | 0.72 |
| Quick Ratio | 0.78 | 0.43 |
| D/E (Debt-to-Equity) | 1.73 | 1.91 |
| Debt-to-Assets | 43.3% | 44.6% |
| Interest Coverage | 2.26 | 2.30 |
| Asset Turnover | 0.21 | 0.18 |
| Fixed Asset Turnover | 0.29 | 0.25 |
| Payout Ratio | 61.9% | 94.2% |
| Dividend Yield | 4.04% | 3.08% |
Interpretation of the Ratios
Exelon Corporation
Exelon’s ratios reveal a mix of strengths and weaknesses. The net margin and dividend yield are favorable, indicating profitability and attractive income return. However, weak liquidity ratios, high debt levels, and low asset turnover raise concerns about operational efficiency and financial stability. The company pays dividends, supported by a 4.04% yield, but coverage by free cash flow appears challenging, signaling potential sustainability risks.
Entergy Corporation
Entergy shows mostly unfavorable ratios, including a high price-to-earnings ratio and poor liquidity measures, reflecting potential overvaluation and liquidity risk. The net margin is neutral, while debt levels and asset turnover are weak. Entergy also pays dividends with a 3.08% yield, but like Exelon, it faces coverage and free cash flow constraints, which may impact future distributions and buyback programs.
Which one has the best ratios?
Comparing both, Exelon displays a slightly more favorable profile with a higher proportion of positive ratio statuses and a better dividend yield. Entergy’s ratios lean more unfavorable, especially in valuation and liquidity. Overall, Exelon’s metrics suggest a marginally stronger financial position, though both companies exhibit notable weaknesses that warrant caution.
Strategic Positioning
This section compares the strategic positioning of Exelon Corporation and Entergy Corporation, including market position, key segments, and exposure to technological disruption:
Exelon Corporation
- Large market cap of $43.8B in regulated electric utilities with moderate beta of 0.56.
- Diverse revenue streams across multiple electric utility subsidiaries and energy products including nuclear, fossil, wind, hydro, biomass, and solar.
- Exposure includes nuclear, fossil, renewable sources; offers a broad mix of generation types, suggesting varied technological risk.
Entergy Corporation
- Market cap of $41.8B in regulated electric utilities with slightly higher beta of 0.65.
- Operates two segments: Utility (electric power and natural gas distribution) and Wholesale Commodities including nuclear and non-nuclear plants.
- Generates electricity with gas, nuclear, coal, hydro, and solar power; decommissioning nuclear plants adds regulatory and technological complexity.
Exelon Corporation vs Entergy Corporation Positioning
Exelon pursues a diversified business model with multiple subsidiaries and energy sources, spreading risk and market exposure. Entergy focuses on two main segments with a strong regional utility footprint, concentrating risk but potentially simplifying management. Exelon’s broader scope may imply higher complexity with varied technological exposure.
Which has the best competitive advantage?
Both companies currently shed value as ROIC is below WACC; Exelon shows a slightly unfavorable moat with growing profitability, while Entergy faces a very unfavorable moat and declining profitability, indicating weaker competitive advantage.
Stock Comparison
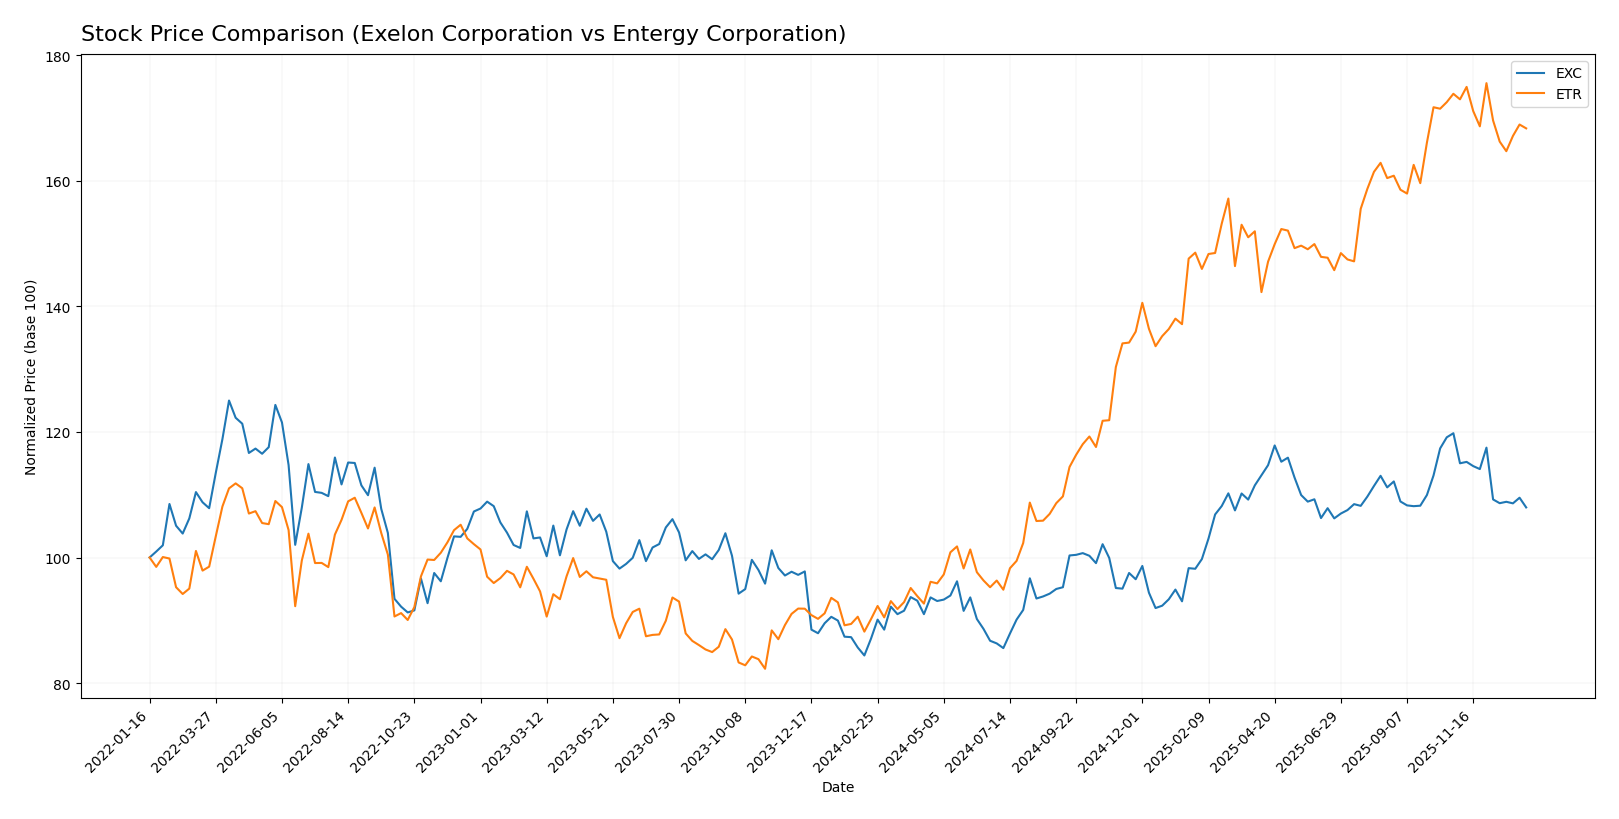
The past year exhibited significant price appreciation for both Exelon Corporation and Entergy Corporation, with notable deceleration in the uptrends and recent downward pressure on stock prices.
Trend Analysis
Exelon Corporation’s stock showed a bullish trend over the past 12 months, rising 24.03%, with decelerating momentum and a high-low range between 48.04 and 34.31. Recent months saw a 9.87% decline, indicating short-term weakness.
Entergy Corporation experienced a stronger bullish trend over the same period, advancing 86.74%, also with decelerating acceleration. The stock fluctuated between 97.52 and 50.08, but recently dropped 3.17%, suggesting a mild pullback.
Comparing trends, Entergy’s stock delivered the highest market performance with an 86.74% gain, substantially outperforming Exelon’s 24.03% increase over the past year.
Target Prices
The current analyst consensus indicates moderate upside potential for both Exelon Corporation and Entergy Corporation.
| Company | Target High | Target Low | Consensus |
|---|---|---|---|
| Exelon Corporation | 57 | 39 | 50.86 |
| Entergy Corporation | 115 | 91 | 103.17 |
Analysts expect Exelon’s stock to appreciate from its current price of 43.3 USD to around 50.86 USD, while Entergy shows a similar positive outlook with a consensus target price well above its current 93.52 USD.
Analyst Opinions Comparison
This section compares analysts’ ratings and grades for Exelon Corporation and Entergy Corporation:
Rating Comparison
EXC Rating
- Rating: B, considered very favorable overall.
- Discounted Cash Flow Score: Moderate at 3, suggesting a balanced valuation perspective.
- ROE Score: Moderate at 3, reflecting average efficiency in generating profit from equity.
- ROA Score: Moderate at 3, indicating average asset utilization efficiency.
- Debt To Equity Score: Moderate at 2, pointing to a balanced but cautious financial risk level.
- Overall Score: Moderate at 3, representing a stable but unspectacular overall financial rating.
ETR Rating
- Rating: B-, also viewed as very favorable by analysts.
- Discounted Cash Flow Score: Very unfavorable at 1, indicating potential overvaluation concerns.
- ROE Score: Favorable at 4, showing strong profitability relative to shareholders’ equity.
- ROA Score: Moderate at 3, similar efficiency in asset use as EXC.
- Debt To Equity Score: Moderate at 2, also suggesting a comparable financial risk profile.
- Overall Score: Moderate at 2, slightly lower overall financial standing compared to EXC.
Which one is the best rated?
Exelon holds a higher overall score (3) and a better discounted cash flow score (3) than Entergy, which has a lower overall score (2) and a very unfavorable DCF score (1). Entergy scores better on return on equity but is overall less favored based on these metrics.
Scores Comparison
The comparison of Exelon Corporation and Entergy Corporation scores is as follows:
EXC Scores
- Altman Z-Score: 0.78, indicating financial distress.
- Piotroski Score: 5, reflecting average financial strength.
ETR Scores
- Altman Z-Score: 1.04, also indicating financial distress.
- Piotroski Score: 4, reflecting average financial strength.
Which company has the best scores?
Both EXC and ETR are in the distress zone by Altman Z-Score, with EXC slightly lower. EXC has a marginally higher Piotroski Score than ETR, but both remain in the average category.
Grades Comparison
Here is a detailed comparison of the recent grades assigned to Exelon Corporation and Entergy Corporation by reputable grading companies:
Exelon Corporation Grades
This table summarizes recent grades and rating actions from major financial institutions for Exelon Corporation:
| Grading Company | Action | New Grade | Date |
|---|---|---|---|
| UBS | Maintain | Neutral | 2025-12-17 |
| JP Morgan | Maintain | Neutral | 2025-12-12 |
| Morgan Stanley | Maintain | Equal Weight | 2025-10-22 |
| Keybanc | Maintain | Underweight | 2025-10-15 |
| Jefferies | Maintain | Buy | 2025-10-15 |
| Barclays | Maintain | Overweight | 2025-10-14 |
| UBS | Maintain | Neutral | 2025-10-10 |
| Morgan Stanley | Maintain | Equal Weight | 2025-09-25 |
| Keybanc | Maintain | Underweight | 2025-07-16 |
| UBS | Maintain | Neutral | 2025-07-11 |
Exelon’s grades show a mixed pattern with several Neutral and Equal Weight ratings, alongside some Buy and Overweight recommendations, indicating a generally cautious outlook.
Entergy Corporation Grades
This table summarizes recent grades and rating actions from major financial institutions for Entergy Corporation:
| Grading Company | Action | New Grade | Date |
|---|---|---|---|
| Argus Research | Maintain | Buy | 2026-01-06 |
| UBS | Maintain | Buy | 2025-12-17 |
| Keybanc | Maintain | Overweight | 2025-12-12 |
| JP Morgan | Maintain | Overweight | 2025-12-11 |
| Citigroup | Maintain | Neutral | 2025-11-18 |
| Evercore ISI Group | Maintain | In Line | 2025-10-30 |
| Mizuho | Maintain | Outperform | 2025-10-27 |
| Morgan Stanley | Maintain | Equal Weight | 2025-10-22 |
| B of A Securities | Maintain | Neutral | 2025-10-16 |
| Keybanc | Maintain | Overweight | 2025-10-15 |
Entergy’s grades predominantly lean towards Buy and Overweight ratings, with positive assessments like Outperform and no Sell ratings, suggesting a more favorable outlook.
Which company has the best grades?
Entergy Corporation has received generally stronger grades than Exelon Corporation, with more Buy and Overweight ratings. This difference could influence investor sentiment, reflecting greater confidence in Entergy’s near-term prospects.
Strengths and Weaknesses
Below is a comparison table of key strengths and weaknesses for Exelon Corporation (EXC) and Entergy Corporation (ETR) based on the most recent data from 2024.
| Criterion | Exelon Corporation (EXC) | Entergy Corporation (ETR) |
|---|---|---|
| Diversification | Highly diversified with multiple regulated electric and gas utilities across several regions, including Baltimore Gas & Electric and Commonwealth Edison. | Primarily focused on electricity with segments in commercial, industrial, and residential sectors; less diversified than EXC. |
| Profitability | Net margin favorable at 10.68%; however, ROIC (3.93%) is below WACC (5%), indicating value destruction but with a growing ROIC trend. | Net margin neutral at 8.93%; ROIC (3.2%) below WACC (5.49%) and declining, showing value destruction with decreasing profitability. |
| Innovation | Moderate innovation focus, slight improvement in ROIC suggests some operational efficiencies. | Limited signs of innovation; profitability and ROIC trends are negative, signaling operational challenges. |
| Global presence | Mainly US-focused but operates across several states and utility segments, providing a broad regional footprint. | US-centric with a focus on electric utilities and wholesale commodities; narrower geographic exposure. |
| Market Share | Strong market share in regulated electric and gas markets, with revenues exceeding $27B in key segments. | Solid presence in electricity markets with revenues around $11B, but faces greater competition and volatility. |
Key takeaways: Exelon stands out for its broad diversification and improving profitability despite current value destruction, while Entergy faces more challenges with declining returns and less diversification. Both require cautious evaluation given their financial and operational risks.
Risk Analysis
Below is a comparative table summarizing key risks for Exelon Corporation (EXC) and Entergy Corporation (ETR) based on the latest 2024 financial and operational data.
| Metric | Exelon Corporation (EXC) | Entergy Corporation (ETR) |
|---|---|---|
| Market Risk | Beta 0.56 – Low volatility, but regulated utility sector limits growth | Beta 0.65 – Slightly higher volatility, regional exposure to Gulf Coast markets |
| Debt level | Debt-to-Equity 1.73 (unfavorable), Interest Coverage 2.39 (neutral) | Debt-to-Equity 1.91 (unfavorable), Interest Coverage 2.25 (neutral) |
| Regulatory Risk | High – Operates in multiple states with strict energy regulations and nuclear oversight | High – Utility operations in four states with nuclear plant decommissioning challenges |
| Operational Risk | Moderate – Diverse generation portfolio but low asset turnover | Moderate – Nuclear decommissioning and aging infrastructure concerns |
| Environmental Risk | Moderate – Exposure to fossil and nuclear generation with transition to renewables ongoing | Moderate – Similar exposure, plus risks from Gulf Coast climate events |
| Geopolitical Risk | Low – Primarily U.S. and Canada operations, limited international exposure | Low – U.S.-focused, but regional political factors may affect regulation |
Exelon’s and Entergy’s most impactful risks are their elevated debt levels combined with moderate interest coverage, raising financial strain concerns. Regulatory pressures, especially related to nuclear operations and environmental policies, remain significant. Both firms fall in the distress zone on Altman Z-scores, indicating heightened bankruptcy risk potential, requiring cautious risk management.
Which Stock to Choose?
Exelon Corporation (EXC) shows a favorable income statement with strong gross and EBIT margins, and growing profitability despite a slight net margin decline. Its financial ratios reveal mixed signals, with favorable net margin and dividend yield but weaknesses in liquidity and asset turnover. EXC carries substantial debt and a moderate credit rating of B.
Entergy Corporation (ETR) posts favorable margins but faces overall unfavorable income growth, with declines in net income and EPS. Its financial ratios are mostly unfavorable, including a high P/E ratio and weak liquidity, combined with heavy debt load. ETR holds a slightly lower rating of B- but remains categorized as very favorable.
Investors seeking growth might find EXC’s improving profitability and more stable rating appealing, while those tolerant of higher risk and volatility could interpret ETR’s recent price surge as a growth opportunity despite weaker financials. The choice could depend on the investor’s risk tolerance and focus on either quality or speculative growth.
Disclaimer: Investment carries a risk of loss of initial capital. The past performance is not a reliable indicator of future results. Be sure to understand risks before making an investment decision.
Go Further
I encourage you to read the complete analyses of Exelon Corporation and Entergy Corporation to enhance your investment decisions: