Entergy Corporation and Eversource Energy are two prominent players in the regulated electric utility sector, each serving distinct yet overlapping regional markets in the United States. Entergy focuses on the southern states with a diverse energy mix including nuclear, while Eversource operates in the Northeast with a strong emphasis on electric and natural gas distribution. This comparison explores their innovation strategies and market positions to help you identify which company stands out as a promising investment opportunity.
Table of contents
Companies Overview
I will begin the comparison between Entergy Corporation and Eversource Energy by providing an overview of these two companies and their main differences.
Entergy Corporation Overview
Entergy Corporation operates as a regulated electric utility, focusing on electricity production and retail distribution in Arkansas, Louisiana, Mississippi, and Texas. It generates power through gas, nuclear, coal, hydro, and solar sources, with approximately 26,000 MW of capacity, including 6,000 MW nuclear. Serving 3 million customers, Entergy also engages in wholesale power operations and nuclear plant decommissioning.
Eversource Energy Overview
Eversource Energy is a public utility holding company operating in electricity transmission and distribution, natural gas distribution, and water services in Connecticut, Massachusetts, and New Hampshire. It serves residential, commercial, and municipal customers, operating regulated water utilities for about 226,000 users. Eversource also develops solar power facilities, emphasizing energy delivery across multiple utility segments.
Key similarities and differences
Both companies operate in the regulated electric utility sector with diversified energy sources, including natural gas and solar power. Entergy has a larger market cap and a broader geographic footprint focused on the southern US, while Eversource concentrates on the Northeast with additional water utility services. Entergy’s business includes nuclear power plant ownership and wholesale operations, contrasting with Eversource’s emphasis on integrated utility services including water distribution.
Income Statement Comparison
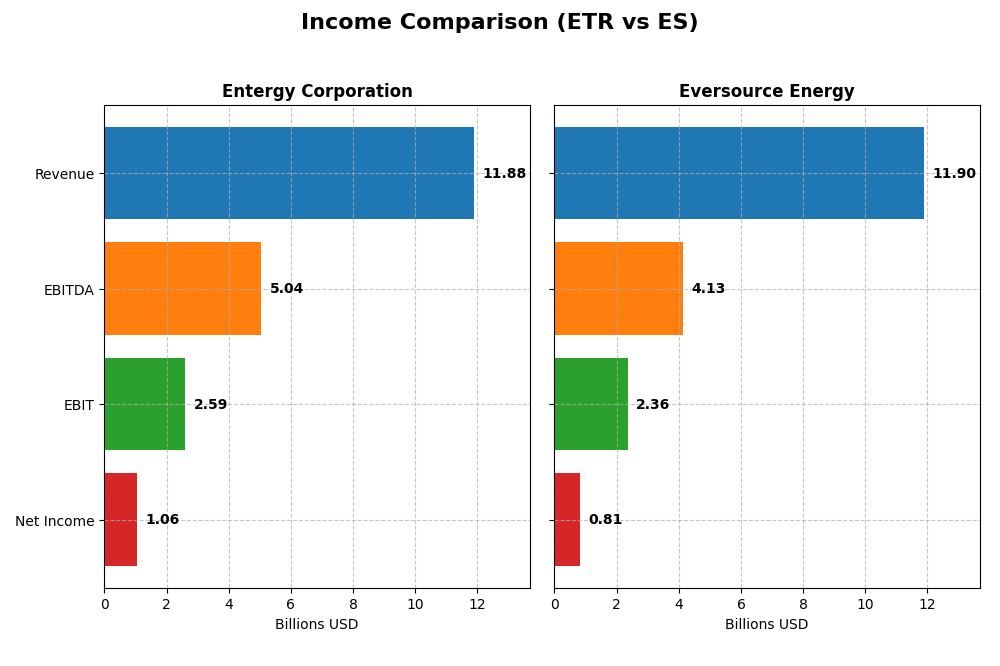
This table compares the key income statement metrics for Entergy Corporation and Eversource Energy for the fiscal year 2024, providing a snapshot of their financial performance.
| Metric | Entergy Corporation (ETR) | Eversource Energy (ES) |
|---|---|---|
| Market Cap | 41.8B | 24.99B |
| Revenue | 11.88B | 11.90B |
| EBITDA | 5.04B | 4.13B |
| EBIT | 2.59B | 2.36B |
| Net Income | 1.06B | 812M |
| EPS | 2.47 | 2.27 |
| Fiscal Year | 2024 | 2024 |
Income Statement Interpretations
Entergy Corporation
Entergy’s revenue showed an overall 17.46% growth from 2020 to 2024 but declined by 2.2% in the latest year. Net income fell by 24.56% over the period and dropped sharply by 54.07% year-on-year. Margins remain solid with a favorable gross margin of 48.3% and net margin near 9%, although recent margin contractions and EPS declines highlight some operational pressures.
Eversource Energy
Eversource experienced a 33.65% revenue increase over five years but nearly flat revenue growth (-0.08%) in 2024. Net income decreased by 32.65% overall but rebounded significantly in 2024 with a 278.74% EPS growth. Margins are stable with a gross margin of 31.12% and net margin of 6.82%, supported by a strong rebound in EBIT and net margin growth in the latest fiscal year.
Which one has the stronger fundamentals?
Eversource shows a more favorable overall income statement evaluation with 57.14% favorable factors, including recent margin and EPS improvements despite long-term net income declines. Entergy, while demonstrating higher margins, faces unfavorable trends in net income and EPS growth, with 57.14% unfavorable signals. Eversource’s recent operational recovery contrasts with Entergy’s persistent margin pressures.
Financial Ratios Comparison
Below is a comparison of key financial ratios for Entergy Corporation (ETR) and Eversource Energy (ES) based on their most recent fiscal year data (2024).
| Ratios | Entergy Corporation (ETR) | Eversource Energy (ES) |
|---|---|---|
| ROE | 7.02% | 5.40% |
| ROIC | 3.20% | 3.18% |
| P/E | 30.56 | 25.29 |
| P/B | 2.14 | 1.37 |
| Current Ratio | 0.72 | 0.76 |
| Quick Ratio | 0.43 | 0.67 |
| D/E (Debt-to-Equity) | 1.91 | 1.94 |
| Debt-to-Assets | 44.63% | 48.85% |
| Interest Coverage | 2.30 | 2.43 |
| Asset Turnover | 0.18 | 0.20 |
| Fixed Asset Turnover | 0.25 | 0.29 |
| Payout Ratio | 94.23% | 124.32% |
| Dividend Yield | 3.08% | 4.91% |
Interpretation of the Ratios
Entergy Corporation
Entergy shows a mixed profile with a neutral net margin (8.93%) but unfavorable returns on equity (7.02%) and invested capital (3.2%), indicating weaker profitability. The high debt-to-equity ratio (1.91) and low current and quick ratios reflect potential liquidity concerns. Dividend yield is favorable at 3.08%, supported by consistent payouts, though free cash flow coverage is negative, posing sustainability risks.
Eversource Energy
Eversource also exhibits neutral net margin (6.82%) but similarly unfavorable ROE (5.4%) and ROIC (3.18%), suggesting profitability challenges. It has a slightly better price-to-book ratio (1.37) but maintains a high debt-to-equity ratio (1.94) and weak liquidity metrics. The dividend yield is relatively strong at 4.91%, yet negative free cash flow raises concerns about dividend sustainability and capital allocation.
Which one has the best ratios?
Both companies have a majority of unfavorable ratios, especially in profitability and liquidity, with Entergy having slightly lower returns but better dividend yield coverage risks. Eversource’s stronger dividend yield and price-to-book ratio contrast with its weaker cash flow profile. Overall, neither company presents a clearly superior ratio profile, as both face significant financial challenges.
Strategic Positioning
This section compares the strategic positioning of Entergy Corporation (ETR) and Eversource Energy (ES), focusing on market position, key segments, and exposure to technological disruption:
Entergy Corporation
- Operates in regulated electric with competitive pressure in southern US states.
- Key segments include Utility and Wholesale Commodities, with diverse electricity generation sources.
- Manages diverse power generation including nuclear, gas, coal, hydro, and solar, mitigating technological disruption.
Eversource Energy
- Operates in regulated electric with competitive pressure in northeastern US states.
- Key segments include Electric Distribution, Transmission, Natural Gas, and Water Distribution.
- Engages in energy delivery including solar power and natural gas distribution, with regulated water utilities.
Entergy Corporation vs Eversource Energy Positioning
Entergy has a diversified generation portfolio across multiple southern states, while Eversource focuses on regulated energy delivery and water services in the northeast. Entergy’s wholesale and nuclear exposure contrasts with Eversource’s emphasis on distribution and transmission.
Which has the best competitive advantage?
Both companies exhibit very unfavorable MOAT status with declining ROIC trends and are currently shedding value, indicating no clear competitive advantage based on capital efficiency and profitability from 2020 to 2024.
Stock Comparison
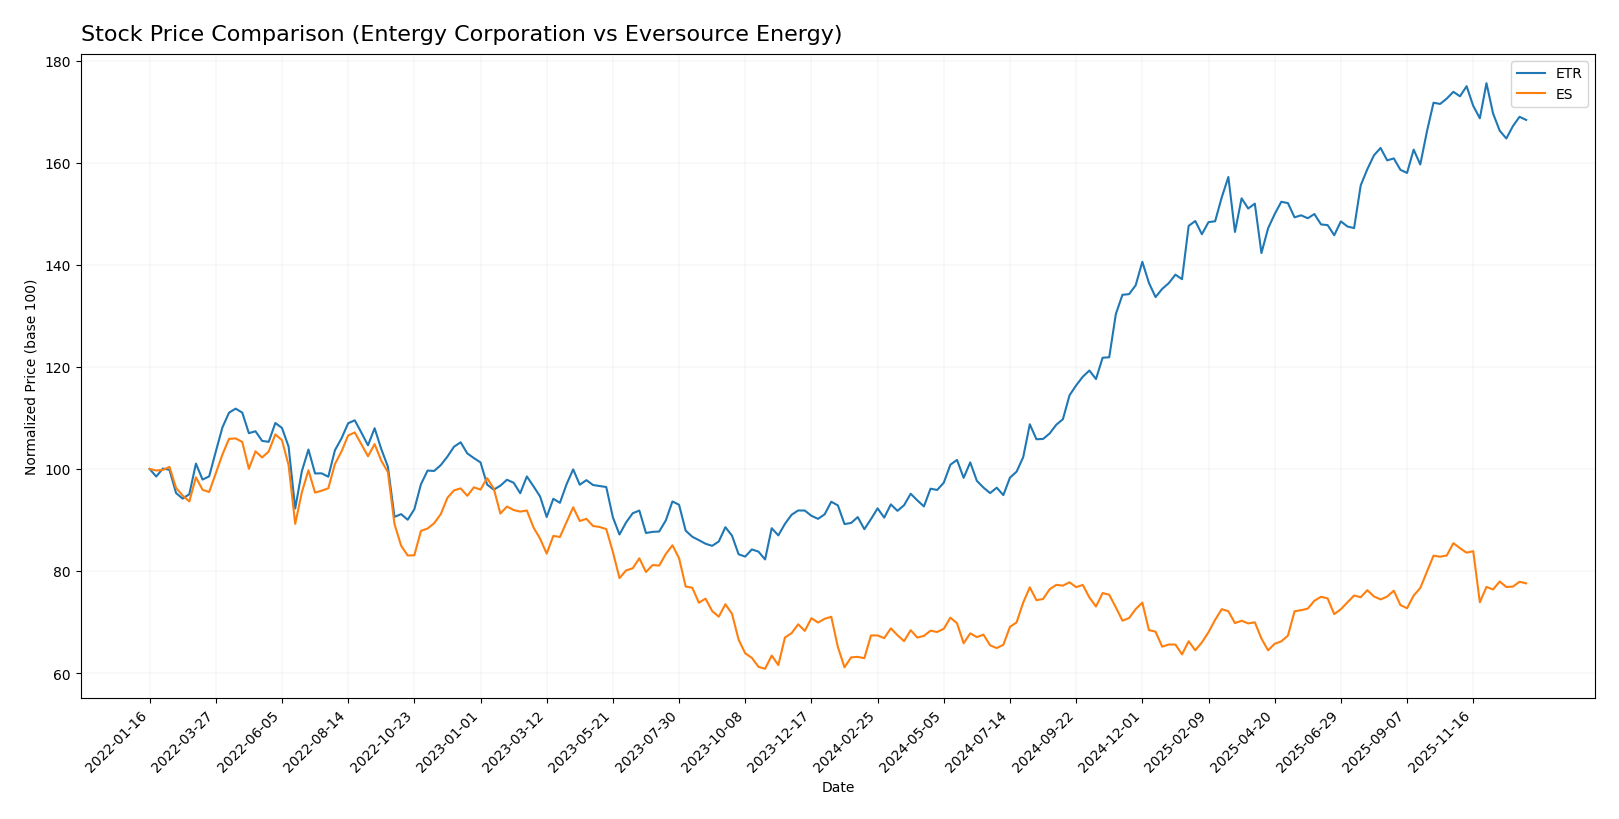
The stock price movements of Entergy Corporation (ETR) and Eversource Energy (ES) over the past 12 months reveal strong bullish trends with decelerating momentum and notable price fluctuations, followed by recent downtrends indicating seller dominance.
Trend Analysis
Entergy Corporation’s stock showed an 86.74% price increase over the past year, indicating a bullish trend with deceleration in growth. The price ranged from 50.08 to 97.52, with recent weeks showing a slight -3.17% decline.
Eversource Energy’s stock gained 15.15% over the same period, reflecting a bullish but decelerating trend. The price fluctuated between 55.63 and 74.67, with a recent sharper decline of -9.21% noted.
Comparatively, Entergy Corporation delivered the highest market performance with a significantly larger overall gain, despite both stocks experiencing recent downward corrections.
Target Prices
The current target price consensus for Entergy Corporation and Eversource Energy reflects moderate upside potential based on analyst estimates.
| Company | Target High | Target Low | Consensus |
|---|---|---|---|
| Entergy Corporation | 115 | 91 | 103.17 |
| Eversource Energy | 81 | 60 | 68 |
Analysts expect Entergy’s stock to appreciate moderately from its current price of $93.52, targeting an average of $103.17. Eversource’s consensus target of $68 is slightly above its current price of $67.79, suggesting limited near-term upside.
Analyst Opinions Comparison
This section compares analysts’ ratings and financial grades for Entergy Corporation and Eversource Energy:
Rating Comparison
Entergy Corporation Rating
- Rating: B-, considered Very Favorable by analysts.
- Discounted Cash Flow Score: 1, marked Very Unfavorable.
- ROE Score: 4, evaluated as Favorable for profitability.
- ROA Score: 3, categorized as Moderate for asset utilization.
- Debt To Equity Score: 2, Moderate financial risk level.
- Overall Score: 2, Moderate overall financial standing.
Eversource Energy Rating
- Rating: C+, also considered Very Favorable by analysts.
- Discounted Cash Flow Score: 1, marked Very Unfavorable.
- ROE Score: 3, rated Moderate, showing average profit efficiency.
- ROA Score: 3, also Moderate, reflecting similar asset use.
- Debt To Equity Score: 1, Very Unfavorable, indicating higher risk.
- Overall Score: 2, Moderate overall financial standing.
Which one is the best rated?
Based strictly on the data, Entergy Corporation holds a higher rating (B-) compared to Eversource Energy’s C+, with better scores in ROE and debt-to-equity, suggesting relatively stronger financial efficiency and moderate risk management.
Scores Comparison
The scores comparison for Entergy Corporation (ETR) and Eversource Energy (ES) is summarized as follows:
ETR Scores
- Altman Z-Score: 1.04, in the distress zone, indicating higher bankruptcy risk.
- Piotroski Score: 4, classified as average financial strength.
ES Scores
- Altman Z-Score: 0.75, also in the distress zone, signaling elevated bankruptcy risk.
- Piotroski Score: 6, classified as average financial strength.
Which company has the best scores?
Based strictly on the provided data, ES has a slightly lower Altman Z-Score indicating more distress, but a higher Piotroski Score suggesting better financial strength compared to ETR. Overall, ES shows a stronger Piotroski Score while both remain in distress per Altman Z-Score.
Grades Comparison
The following section compares the recent grades assigned to Entergy Corporation and Eversource Energy by recognized financial institutions:
Entergy Corporation Grades
This table summarizes the latest grades and rating actions from major grading companies for Entergy Corporation.
| Grading Company | Action | New Grade | Date |
|---|---|---|---|
| Argus Research | Maintain | Buy | 2026-01-06 |
| UBS | Maintain | Buy | 2025-12-17 |
| Keybanc | Maintain | Overweight | 2025-12-12 |
| JP Morgan | Maintain | Overweight | 2025-12-11 |
| Citigroup | Maintain | Neutral | 2025-11-18 |
| Evercore ISI Group | Maintain | In Line | 2025-10-30 |
| Mizuho | Maintain | Outperform | 2025-10-27 |
| Morgan Stanley | Maintain | Equal Weight | 2025-10-22 |
| B of A Securities | Maintain | Neutral | 2025-10-16 |
| Keybanc | Maintain | Overweight | 2025-10-15 |
Entergy Corporation’s grades predominantly indicate a positive outlook, with multiple “Buy” and “Overweight” ratings maintained by reputable firms.
Eversource Energy Grades
This table presents the recent grades and rating changes for Eversource Energy from verified grading companies.
| Grading Company | Action | New Grade | Date |
|---|---|---|---|
| UBS | Maintain | Neutral | 2025-12-17 |
| JP Morgan | Maintain | Underweight | 2025-12-12 |
| Janney Montgomery Scott | Upgrade | Buy | 2025-11-24 |
| Scotiabank | Maintain | Sector Underperform | 2025-11-20 |
| Mizuho | Downgrade | Neutral | 2025-11-20 |
| Wells Fargo | Downgrade | Equal Weight | 2025-11-20 |
| UBS | Downgrade | Neutral | 2025-11-06 |
| BMO Capital | Maintain | Market Perform | 2025-11-06 |
| Scotiabank | Maintain | Sector Underperform | 2025-11-06 |
| Mizuho | Maintain | Outperform | 2025-10-27 |
Eversource Energy’s grades show a mixed trend with downgrades and sector underperform ratings, though some firms maintain neutral or outperform views.
Which company has the best grades?
Entergy Corporation has received generally stronger and more consistent grades, centered around “Buy” and “Overweight,” compared to Eversource Energy’s more mixed ratings including downgrades and underperform assessments. This difference may influence investor perception of relative stability and growth potential.
Strengths and Weaknesses
Below is a comparison table highlighting the strengths and weaknesses of Entergy Corporation (ETR) and Eversource Energy (ES) based on their latest financial and operational data.
| Criterion | Entergy Corporation (ETR) | Eversource Energy (ES) |
|---|---|---|
| Diversification | Moderate diversification with strong residential and industrial segments; some exposure to wholesale commodities | Well-diversified across electric distribution, transmission, natural gas, and water segments |
| Profitability | Low ROIC (3.2%) below WACC (5.49%), declining trend; net margin neutral at 8.93% | Low ROIC (3.18%) below WACC (5.01%), also declining; net margin neutral at 6.82% |
| Innovation | Limited data on innovation; overall value destruction suggests challenges in operational efficiency | Similar challenges with declining ROIC, but steady investments in infrastructure segments |
| Global presence | Primarily US-focused utility operations with no significant international footprint | Also US-focused, strong presence in Northeast US markets |
| Market Share | Strong in residential and industrial electricity markets; wholesale commodities volatile | Leading regional utility provider with balanced revenue streams |
Key takeaways: Both Entergy and Eversource face challenges with declining profitability and ROIC below their cost of capital, signaling value destruction. Eversource shows better diversification across utilities, while Entergy has stronger exposure to residential and industrial customers. Caution is advised due to unfavorable financial ratios and declining returns.
Risk Analysis
Below is a comparison of key risks for Entergy Corporation (ETR) and Eversource Energy (ES) based on the most recent data from 2024-2026.
| Metric | Entergy Corporation (ETR) | Eversource Energy (ES) |
|---|---|---|
| Market Risk | Beta 0.65 – moderate volatility, stable utility sector | Beta 0.77 – slightly higher volatility but still low |
| Debt level | Debt-to-Equity 1.91 (unfavorable), interest coverage 2.25 (neutral) | Debt-to-Equity 1.94 (unfavorable), interest coverage 2.12 (neutral) |
| Regulatory Risk | High – operates nuclear and fossil fuel plants, subject to stringent regulations | High – regulated electric, gas, and water utilities under strict oversight |
| Operational Risk | Moderate – managing nuclear decommissioning and diverse energy sources | Moderate – multi-utility operations with infrastructure maintenance challenges |
| Environmental Risk | Elevated – nuclear and coal assets pose environmental and cleanup liabilities | Moderate – focus on renewable energy but also natural gas distribution |
| Geopolitical Risk | Low – US-focused operations in southern states | Low – US-focused, primarily in New England |
Both companies face significant regulatory and environmental risks, with Entergy’s exposure to nuclear assets increasing operational and environmental challenges. Their debt levels are relatively high, which could pressure financial flexibility. Market risk remains moderate due to their utility sector stability, though Eversource shows slightly higher beta. Operationally, both manage complex infrastructures with potential for service disruption. Recent Altman Z-Scores place both firms in the distress zone, signaling caution. Dividend yields are favorable, offering income potential despite these risks.
Which Stock to Choose?
Entergy Corporation (ETR) shows a mixed income evolution with a 17.46% revenue growth overall but declining net income and EPS. Its profitability ratios are mostly unfavorable, with ROE at 7.02% and ROIC at 3.2%, while its debt level is high (D/E 1.91) and liquidity ratios are low. Despite this, its rating is very favorable with a B- grade but global financial ratios and income statement evaluations remain unfavorable.
Eversource Energy (ES) presents a stronger revenue growth of 33.65% over the period but also shows declining net income and EPS. Profitability ratios are slightly better but still unfavorable (ROE 5.4%, ROIC 3.18%), with a higher debt level (D/E 1.94) and moderate liquidity. Its overall rating is very favorable with a C+ grade. Income statement evaluation is globally favorable, although financial ratios mostly remain unfavorable.
For investors, ETR’s solid rating and income quality might appeal to those seeking dividend yield and moderate growth, while ES’s favorable income statement growth and valuation metrics could attract those prioritizing revenue expansion but accepting higher risk. Both companies exhibit value destruction in MOAT analysis and face liquidity challenges, suggesting cautious consideration based on individual risk tolerance and investment strategy.
Disclaimer: Investment carries a risk of loss of initial capital. The past performance is not a reliable indicator of future results. Be sure to understand risks before making an investment decision.
Go Further
I encourage you to read the complete analyses of Entergy Corporation and Eversource Energy to enhance your investment decisions: