Entergy Corporation and Evergy, Inc. are two prominent players in the regulated electric utilities sector, serving distinct but overlapping U.S. regions with diverse energy portfolios. Both companies emphasize innovation through renewable energy integration and efficient power distribution. This comparison explores their market positions, growth strategies, and risk profiles to help you decide which utility stock could be the most compelling addition to your investment portfolio in 2026.
Table of contents
Companies Overview
I will begin the comparison between Entergy Corporation and Evergy, Inc. by providing an overview of these two companies and their main differences.
Entergy Corporation Overview
Entergy Corporation operates in the regulated electric industry, focusing on the production and retail distribution of electricity across Arkansas, Louisiana, Mississippi, and Texas. Established in 1913 and headquartered in New Orleans, it manages around 26,000 MW of generating capacity, including 6,000 MW from nuclear sources. Entergy serves 3 million utility customers and operates through two segments: Utility and Entergy Wholesale Commodities.
Evergy, Inc. Overview
Evergy, Inc. is a regulated electric utility company serving Kansas and Missouri, with a customer base of approximately 1.62M. Founded in 2017 and headquartered in Kansas City, it generates electricity through diverse sources including coal, hydroelectric, uranium, natural gas, and renewables. Evergy operates extensive transmission and distribution networks totaling over 62,000 circuit miles, supporting residential, commercial, and industrial customers.
Key similarities and differences
Both Entergy and Evergy operate as regulated electric utilities generating and distributing power across specific U.S. regions. Each utilizes multiple energy sources, including renewables and nuclear (Entergy only), to supply electricity. However, Entergy has a larger market capitalization (42B vs. 17B), serves nearly double the customers, and maintains a broader geographic footprint. Evergy, meanwhile, has a more concentrated operational area with extensive transmission infrastructure.
Income Statement Comparison
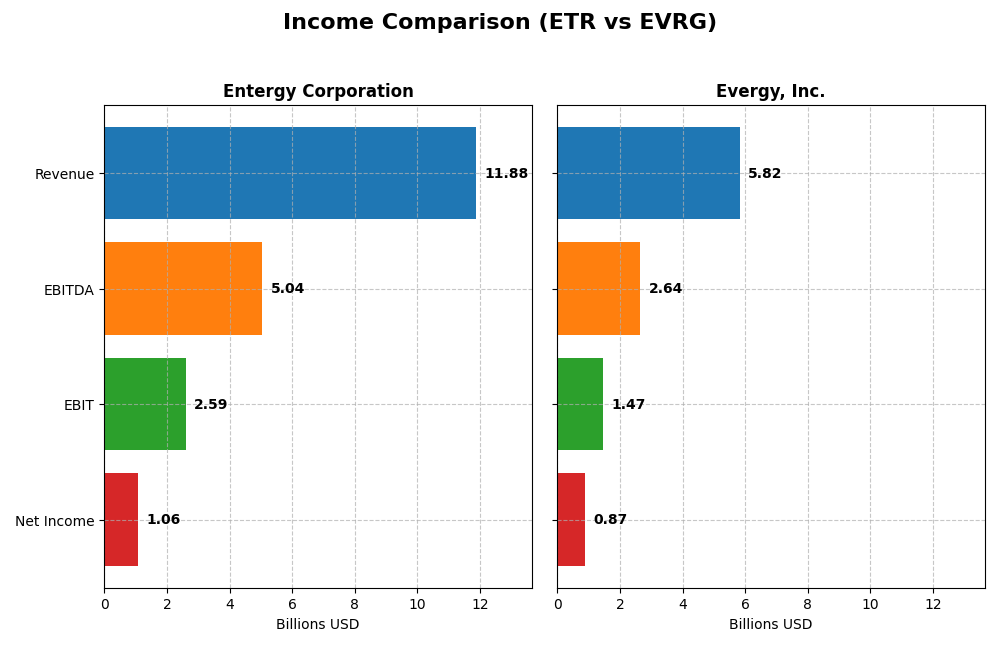
The table below presents a side-by-side comparison of key income statement metrics for Entergy Corporation and Evergy, Inc. for the fiscal year 2024.
| Metric | Entergy Corporation | Evergy, Inc. |
|---|---|---|
| Market Cap | 41.8B | 16.8B |
| Revenue | 11.9B | 5.8B |
| EBITDA | 5.0B | 2.6B |
| EBIT | 2.6B | 1.5B |
| Net Income | 1.1B | 874M |
| EPS | 2.47 | 3.79 |
| Fiscal Year | 2024 | 2024 |
Income Statement Interpretations
Entergy Corporation
Entergy Corporation’s revenue showed a moderate overall growth of 17.46% from 2020 to 2024, though it declined by 2.2% in the most recent year. Net income decreased significantly over the period by 24.56%, with a steep drop of 54.07% in net margin in 2024. Gross and EBIT margins remained favorable at 48.3% and 21.83%, respectively, but net margin and EPS deteriorated in 2024, signaling margin pressure.
Evergy, Inc.
Evergy, Inc. experienced steady revenue growth of 18.53% over five years and a 6.17% increase in 2024. Net income rose 41.27% overall, supported by improving net margin and EPS growth of 19.56% last year. Gross margin stood at 32.57%, with an EBIT margin of 25.26%, both favorable. Despite a slight unfavorable rise in operating expenses relative to revenue growth, profitability metrics strengthened in 2024.
Which one has the stronger fundamentals?
Based on income statement evaluations, Evergy demonstrates stronger fundamentals with 78.57% favorable indicators compared to Entergy’s 35.71%. Evergy’s consistent revenue and net income growth, along with improving margins and EPS, contrast with Entergy’s recent declines in profitability and net margin. Entergy’s neutral interest expense and favorable gross margin are outweighed by unfavorable net income trends.
Financial Ratios Comparison
The table below compares the most recent key financial ratios for Entergy Corporation (ETR) and Evergy, Inc. (EVRG) based on their 2024 fiscal year-end data.
| Ratios | Entergy Corporation (ETR) | Evergy, Inc. (EVRG) |
|---|---|---|
| ROE | 7.0% | 8.8% |
| ROIC | 3.2% | 4.5% |
| P/E | 30.6 | 16.2 |
| P/B | 2.14 | 1.42 |
| Current Ratio | 0.72 | 0.50 |
| Quick Ratio | 0.43 | 0.27 |
| D/E (Debt to Equity) | 1.91 | 1.41 |
| Debt-to-Assets | 44.6% | 43.6% |
| Interest Coverage | 2.30 | 2.57 |
| Asset Turnover | 0.18 | 0.18 |
| Fixed Asset Turnover | 0.25 | 0.23 |
| Payout ratio | 94.2% | 68.3% |
| Dividend yield | 3.08% | 4.21% |
Interpretation of the Ratios
Entergy Corporation
Entergy’s ratios show several weaknesses, including an unfavorable return on equity (7.02%) and return on invested capital (3.2%), alongside a low current ratio of 0.72, which signals liquidity concerns. The company has a favorable dividend yield of 3.08%, indicating consistent shareholder returns, but the overall ratio profile remains unfavorable with risks in profitability and liquidity.
Evergy, Inc.
Evergy presents stronger net margin (15.0%) and a favorable price-to-book ratio (1.42), though its return on equity (8.77%) and return on invested capital (4.52%) are still considered unfavorable. The dividend yield at 4.21% is attractive, supporting shareholder income. Despite some liquidity challenges with a current ratio of 0.5, the global ratios lean slightly unfavorable but better than Entergy’s.
Which one has the best ratios?
Comparing the two, Evergy holds a more favorable overall ratio structure, highlighted by a stronger net margin, better price-to-book, and a higher dividend yield. Entergy faces more pronounced unfavorable metrics, particularly in profitability and liquidity. Yet, both companies show areas needing improvement, with Evergy slightly outperforming on balance.
Strategic Positioning
This section compares the strategic positioning of Entergy Corporation and Evergy, Inc., including market position, key segments, and exposure to technological disruption:
Entergy Corporation
- Larger market cap of $41.8B with significant presence in Arkansas, Louisiana, Mississippi, and Texas utilities.
- Diverse revenue streams with utility and wholesale commodities segments, serving residential, commercial, and industrial customers.
- Generates electricity from nuclear, gas, coal, hydro, solar, and other sources, including nuclear plant ownership.
Evergy, Inc.
- Smaller $16.8B market cap, focused on electricity generation in Kansas and Missouri.
- Operates a single electric utility segment serving residential, commercial, and industrial customers.
- Uses coal, hydroelectric, landfill gas, uranium, natural gas, oil, solar, wind, and other renewables for generation.
Entergy Corporation vs Evergy, Inc. Positioning
Entergy’s approach is more diversified across multiple states and energy types, including wholesale commodities, offering broader business drivers. Evergy concentrates geographically in two states with a single utility segment, which may limit scale but focuses on transmission and distribution.
Which has the best competitive advantage?
Both companies are currently shedding value with ROIC below WACC. Entergy’s declining ROIC indicates worsening profitability, while Evergy shows improving ROIC trends despite negative spread, suggesting slightly more favorable future value creation potential.
Stock Comparison
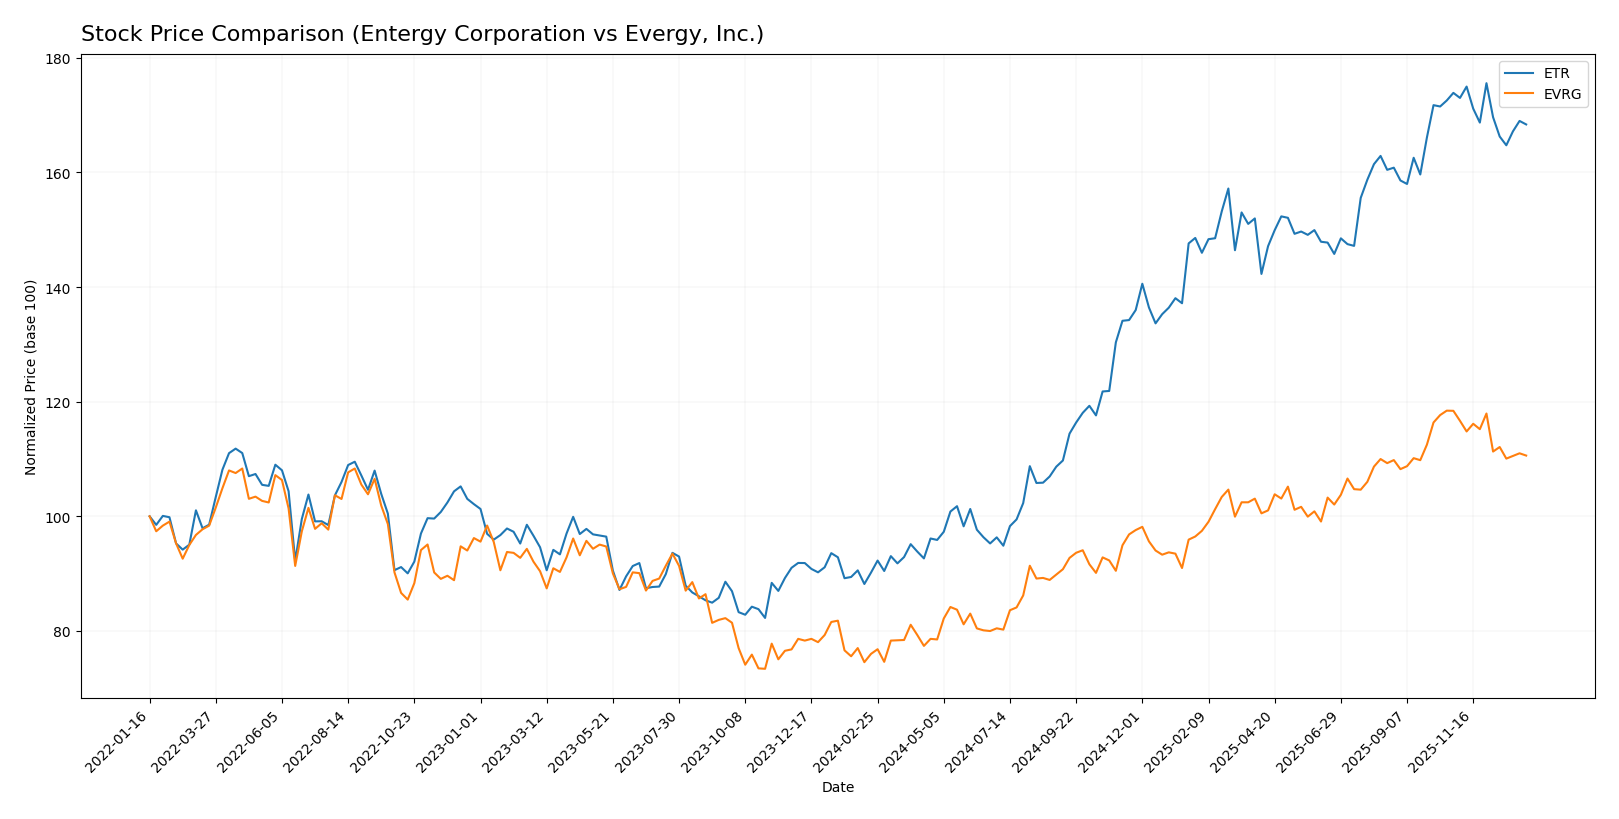
The stock price movements of Entergy Corporation (ETR) and Evergy, Inc. (EVRG) over the past 12 months reveal strong bullish trends with notable deceleration, alongside recent short-term declines reflecting seller dominance.
Trend Analysis
Entergy Corporation (ETR) showed an 86.74% price increase over the past year, indicating a bullish trend with deceleration. The stock ranged between 50.08 and 97.52, with recent weeks showing a mild 3.17% decline.
Evergy, Inc. (EVRG) also exhibited a bullish trend with a 45.55% gain over the year, decelerating as well. Price fluctuated from 49.12 to 77.98, followed by a steeper recent drop of 6.59%.
Comparing both, ETR delivered the highest market performance over the past year, nearly doubling EVRG’s price appreciation despite both experiencing recent short-term downward trends.
Target Prices
The current analyst consensus for target prices shows moderate upside potential for both Entergy Corporation and Evergy, Inc.
| Company | Target High | Target Low | Consensus |
|---|---|---|---|
| Entergy Corporation | 115 | 91 | 103.17 |
| Evergy, Inc. | 93 | 76 | 82.67 |
Analysts expect Entergy’s stock to rise above its current price of 93.52 USD, with a consensus target around 103.17 USD. Evergy’s consensus target of 82.67 USD also suggests upside from its current 72.82 USD, indicating positive market sentiment.
Analyst Opinions Comparison
This section compares analysts’ ratings and grades for Entergy Corporation and Evergy, Inc.:
Rating Comparison
Entergy Corporation Rating
- Rating: B-, considered very favorable by analysts.
- Discounted Cash Flow Score: 1, indicating a very unfavorable DCF.
- ROE Score: 4, rated favorable for efficient equity profit generation.
- ROA Score: 3, moderate utilization of assets to generate earnings.
- Debt To Equity Score: 2, moderate financial risk profile.
- Overall Score: 2, moderate overall financial standing.
Evergy, Inc. Rating
- Rating: B-, also viewed as very favorable by analysts.
- Discounted Cash Flow Score: 1, showing a very unfavorable DCF.
- ROE Score: 3, moderate score reflecting average equity profit.
- ROA Score: 3, similarly moderate asset utilization.
- Debt To Equity Score: 2, also moderate financial risk.
- Overall Score: 2, matching moderate overall financial standing.
Which one is the best rated?
Both Entergy and Evergy share the same overall rating of B- and overall score of 2, indicating a moderate financial standing. Entergy has a stronger ROE score (4 vs. 3), while other scores are equal, making Entergy slightly better rated in equity profitability.
Scores Comparison
Here is a comparison of Entergy Corporation and Evergy, Inc. based on their financial health scores:
ETR Scores
- Altman Z-Score: 1.04, indicating financial distress and high bankruptcy risk.
- Piotroski Score: 4, reflecting average financial strength and stability.
EVRG Scores
- Altman Z-Score: 0.82, indicating financial distress and high bankruptcy risk.
- Piotroski Score: 5, reflecting average financial strength and stability.
Which company has the best scores?
Both companies are in the distress zone for bankruptcy risk, but Evergy has a slightly lower Altman Z-Score and a marginally better Piotroski Score, indicating a similar but slightly stronger financial position than Entergy based solely on these metrics.
Grades Comparison
Here is a detailed comparison of the recent grades assigned to Entergy Corporation and Evergy, Inc.:
Entergy Corporation Grades
The table below summarizes Entergy Corporation’s latest grades from reputable financial institutions:
| Grading Company | Action | New Grade | Date |
|---|---|---|---|
| Argus Research | Maintain | Buy | 2026-01-06 |
| UBS | Maintain | Buy | 2025-12-17 |
| Keybanc | Maintain | Overweight | 2025-12-12 |
| JP Morgan | Maintain | Overweight | 2025-12-11 |
| Citigroup | Maintain | Neutral | 2025-11-18 |
| Evercore ISI Group | Maintain | In Line | 2025-10-30 |
| Mizuho | Maintain | Outperform | 2025-10-27 |
| Morgan Stanley | Maintain | Equal Weight | 2025-10-22 |
| B of A Securities | Maintain | Neutral | 2025-10-16 |
| Keybanc | Maintain | Overweight | 2025-10-15 |
Entergy’s grades predominantly reflect a positive outlook, with multiple Buy and Overweight ratings maintained over the past months.
Evergy, Inc. Grades
The following table presents Evergy, Inc.’s recent grades from recognized grading companies:
| Grading Company | Action | New Grade | Date |
|---|---|---|---|
| Mizuho | Downgrade | Neutral | 2025-12-18 |
| UBS | Maintain | Buy | 2025-12-17 |
| Citigroup | Maintain | Buy | 2025-11-10 |
| Jefferies | Maintain | Buy | 2025-10-09 |
| Mizuho | Maintain | Outperform | 2025-08-08 |
| Mizuho | Maintain | Outperform | 2025-07-18 |
| Barclays | Maintain | Overweight | 2025-05-30 |
| Citigroup | Maintain | Buy | 2025-05-16 |
| UBS | Upgrade | Buy | 2025-04-28 |
| Barclays | Maintain | Overweight | 2025-04-22 |
Evergy’s ratings show a mix of strong Buy and Outperform grades, though with a recent downgrade from Mizuho to Neutral.
Which company has the best grades?
Entergy Corporation holds a more consistently positive grading profile with sustained Buy and Overweight ratings, while Evergy, Inc. shows some variability with a recent downgrade affecting its outlook. Investors may interpret Entergy’s steadier grades as a sign of greater analyst confidence.
Strengths and Weaknesses
Below is a comparative overview of Entergy Corporation (ETR) and Evergy, Inc. (EVRG) based on key financial and strategic criteria.
| Criterion | Entergy Corporation (ETR) | Evergy, Inc. (EVRG) |
|---|---|---|
| Diversification | Moderate: diversified within electric and natural gas sectors, with 2024 revenues heavily from Residential (4.5B) and Industrial (3.2B) segments | Lower: primarily electric utility focused with revenues around 2.7B (2017 data latest available) |
| Profitability | Low: ROIC 3.2% below WACC 5.49%, declining trend; net margin 8.93%, unfavorable ROE 7.02% | Moderate: ROIC 4.52% below WACC 5.36% but improving trend; net margin 15%, ROE 8.77% unfavorable |
| Innovation | Limited data; declining profitability suggests challenges in capital efficiency | Limited data; growing ROIC indicates improving operational efficiency |
| Global presence | Primarily US-based utilities with regulated markets | US regional electric utility focus, no global footprint |
| Market Share | Strong presence in regulated US electric and gas markets with multi-billion revenues | Regional electric utility with stable market share in its operating areas |
Key takeaways: Entergy shows signs of value destruction with declining ROIC and low profitability, weakened by less efficient capital use and lower liquidity ratios. Evergy, despite shedding value currently, demonstrates improving profitability trends and higher net margins, suggesting potential for value creation if operational improvements continue. Investors should weigh Evergy’s growth prospects against Entergy’s challenges and exercise caution given both companies’ financial constraints.
Risk Analysis
Below is a comparative overview of key risks for Entergy Corporation (ETR) and Evergy, Inc. (EVRG) based on the most recent 2024 data:
| Metric | Entergy Corporation (ETR) | Evergy, Inc. (EVRG) |
|---|---|---|
| Market Risk | Moderate (Beta 0.65, stable utility sector) | Moderate (Beta 0.65, regulated market) |
| Debt Level | High (Debt-to-Equity 1.91, interest coverage 2.25) | Elevated (Debt-to-Equity 1.41, interest coverage 2.61) |
| Regulatory Risk | Significant (operates nuclear plants, multiple states) | Significant (regulated electric markets in KS & MO) |
| Operational Risk | Elevated (nuclear & fossil fuel assets, asset turnover low) | Elevated (diverse generation mix, asset turnover low) |
| Environmental Risk | Moderate (nuclear decommissioning, fossil fuels present) | Moderate (coal and fossil fuels, renewables growing) |
| Geopolitical Risk | Low (U.S.-focused operations) | Low (U.S.-focused operations) |
Both companies face substantial regulatory and operational risks intrinsic to the regulated electric utility sector, including nuclear plant management for Entergy and coal reliance for Evergy. Debt levels are relatively high for both, posing financial risk despite moderate interest coverage. Market volatility is low due to stable utility demand, while geopolitical exposure is minimal given their U.S.-centric operations. Entergy’s nuclear operations and Evergy’s coal usage represent notable environmental risk points. Investors should weigh these factors carefully, prioritizing regulatory and debt risks as most impactful.
Which Stock to Choose?
Entergy Corporation (ETR) shows mixed income evolution with a 17.46% revenue growth over 2020-2024 but declining net income and EPS. Its financial ratios appear mostly unfavorable, including a high net debt to EBITDA of 5.57 and weak liquidity ratios. Profitability is moderate with a 7.02% ROE, while its debt levels and rating remain cautious at B- with a moderate overall score.
Evergy, Inc. (EVRG) demonstrates favorable income growth, with 18.53% revenue and 41.27% net income increases over five years. Its financial ratios are slightly more positive, featuring a lower net debt to EBITDA of 5.32 and better valuation multiples. Profitability is reasonable with an 8.77% ROE, and the company holds a similar B- rating but with a slightly more favorable global ratio outlook.
For investors, Evergy’s favorable income growth and improving profitability might appeal to growth-oriented profiles, while Entergy’s stable dividend yield and cautious rating could be of interest to those prioritizing income and quality. The choice could depend on one’s risk tolerance and investment focus, as both companies present financial challenges but differ in growth and value creation trends.
Disclaimer: Investment carries a risk of loss of initial capital. The past performance is not a reliable indicator of future results. Be sure to understand risks before making an investment decision.
Go Further
I encourage you to read the complete analyses of Entergy Corporation and Evergy, Inc. to enhance your investment decisions: