In the evolving uranium sector, Energy Fuels Inc. (UUUU) and Uranium Royalty Corp. (UROY) stand out as compelling players with distinct strategies. Energy Fuels focuses on uranium extraction and processing within the U.S., while Uranium Royalty operates as a diversified royalty company with global uranium interests. Comparing these companies reveals insights into industry approaches and growth potential. Join me as we explore which offers the most promising investment opportunity today.
Table of contents
Companies Overview
I will begin the comparison between Energy Fuels Inc. and Uranium Royalty Corp. by providing an overview of these two companies and their main differences.
Energy Fuels Inc. Overview
Energy Fuels Inc. engages in the extraction, recovery, exploration, and sale of conventional and in situ uranium in the United States. The company operates several uranium projects and a mill across multiple states including Wyoming, Texas, and Utah. Founded in 1987 and headquartered in Lakewood, Colorado, Energy Fuels holds a significant position in the uranium industry with a market cap of approximately 4.3B USD.
Uranium Royalty Corp. Overview
Uranium Royalty Corp. operates as a pure-play uranium royalty company, managing a geographically diversified portfolio of uranium interests across North America and Namibia. Incorporated in 2017 and based in Vancouver, Canada, it focuses on acquiring and accumulating royalty interests rather than direct extraction. The company has a market cap of about 535M USD and employs a lean team of 14 employees.
Key similarities and differences
Both companies operate within the uranium sector, contributing to the energy industry but with distinct business models. Energy Fuels Inc. focuses on uranium mining and processing operations, maintaining direct control over extraction assets. In contrast, Uranium Royalty Corp. acts as a royalty holder, generating revenue from uranium projects without engaging in physical mining. Their geographic footprints overlap in some regions, yet their operational approaches and scale differ significantly.
Income Statement Comparison
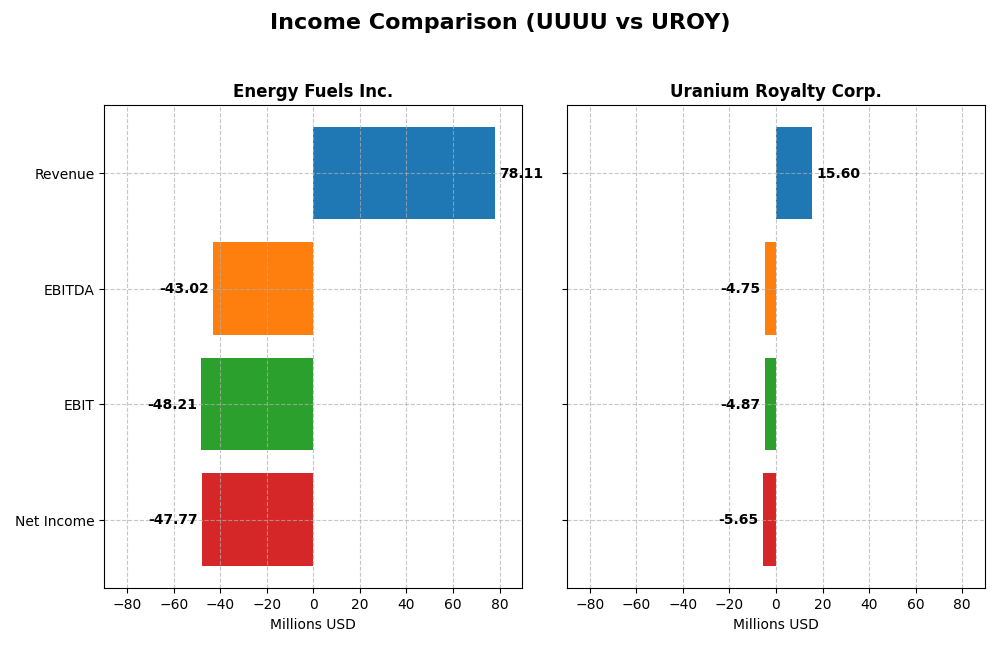
This table compares the latest fiscal year income statement metrics for Energy Fuels Inc. and Uranium Royalty Corp., providing a snapshot of their financial performance.
| Metric | Energy Fuels Inc. (UUUU) | Uranium Royalty Corp. (UROY) |
|---|---|---|
| Market Cap | 4.31B USD | 535M CAD |
| Revenue | 78.1M USD | 15.6M CAD |
| EBITDA | -43.0M USD | -4.75M CAD |
| EBIT | -48.2M USD | -4.87M CAD |
| Net Income | -47.8M USD | -5.65M CAD |
| EPS | -0.28 USD | -0.0446 CAD |
| Fiscal Year | 2024 | 2025 |
Income Statement Interpretations
Energy Fuels Inc.
Energy Fuels Inc. experienced significant revenue growth from 2020 to 2024, surging over 4600%. Net income, however, declined by about 72% over the same period, reflecting volatility in profitability. Gross margins remained favorable at 21.76%, but EBIT and net margins were negative in 2024. The recent year showed revenue more than doubling, while margins deteriorated, highlighting operational challenges despite top-line gains.
Uranium Royalty Corp.
Uranium Royalty Corp. showed relatively flat revenue over 2021-2025, with a marked decline of 63% in the latest year. Net income fell sharply over the period, dropping by over 300%. Gross margin was near 10% but considered neutral, while EBIT and net margins were negative and unfavorable in 2025. The last fiscal year saw decreased revenue and margins, reflecting weakening operational efficiency.
Which one has the stronger fundamentals?
Energy Fuels Inc. demonstrates stronger revenue growth and a more favorable gross margin compared to Uranium Royalty Corp., which faced declining revenue and weaker profitability. However, Energy Fuels’ negative EBIT and net margin indicate ongoing profitability issues. Uranium Royalty’s overall income statement evaluation is unfavorable, contrasting with Energy Fuels’ neutral stance, suggesting more balanced but still challenged fundamentals for Energy Fuels.
Financial Ratios Comparison
Below is a comparison of key financial ratios for Energy Fuels Inc. (UUUU) and Uranium Royalty Corp. (UROY) based on the most recent full fiscal year data available.
| Ratios | Energy Fuels Inc. (UUUU) FY 2024 | Uranium Royalty Corp. (UROY) FY 2025 |
|---|---|---|
| ROE | -9.05% | -1.92% |
| ROIC | -6.67% | -1.63% |
| P/E | -18.47 | -56.00 |
| P/B | 1.67 | 1.07 |
| Current Ratio | 3.88 | 233.49 |
| Quick Ratio | 2.76 | 233.49 |
| D/E (Debt-to-Equity) | 0.0041 | 0.0007 |
| Debt-to-Assets | 0.36% | 0.07% |
| Interest Coverage | 0 | -11.02 |
| Asset Turnover | 0.13 | 0.05 |
| Fixed Asset Turnover | 1.42 | 82.51 |
| Payout ratio | 0 | 0 |
| Dividend yield | 0% | 0% |
Interpretation of the Ratios
Energy Fuels Inc.
Energy Fuels Inc. shows a majority of unfavorable ratios, including a negative net margin of -61.15% and negative returns on equity and invested capital, indicating profitability challenges. The current ratio is high but considered unfavorable, while the quick ratio and debt metrics are favorable. The company does not pay dividends, likely reflecting reinvestment in operations or a growth phase given negative profitability.
Uranium Royalty Corp.
Uranium Royalty Corp. also reports predominantly unfavorable ratios, with a net margin of -36.26% and negative returns on equity and invested capital, signaling weak profitability. Its current ratio is extremely high but unfavorable, while quick ratio, debt-to-equity, and fixed asset turnover ratios are favorable. The company does not issue dividends, possibly prioritizing reinvestment or expansion over shareholder payouts.
Which one has the best ratios?
Neither company exhibits a broadly favorable financial profile, as both face significant profitability issues and negative returns. Uranium Royalty Corp. holds a slightly higher proportion of favorable ratios at 42.86% compared to Energy Fuels Inc.’s 28.57%, but both are rated globally unfavorable. Investors should note substantial risks reflected in these ratio assessments.
Strategic Positioning
This section compares the strategic positioning of Energy Fuels Inc. and Uranium Royalty Corp., focusing on Market position, Key segments, and Exposure to technological disruption:
Energy Fuels Inc.
- Leading U.S.-based uranium producer facing competitive pressure in conventional and in situ extraction.
- Operates uranium extraction projects and a milling facility, driving revenue through physical production.
- Exposure centered on uranium extraction technologies with potential impact from in situ recovery innovations.
Uranium Royalty Corp.
- Pure-play uranium royalty company with diversified geographic interests and moderate competitive pressure.
- Focuses on acquiring and managing royalty interests across multiple uranium projects globally.
- Less direct exposure to extraction technology disruption, relying on royalty income from diversified assets.
Energy Fuels Inc. vs Uranium Royalty Corp. Positioning
Energy Fuels operates a concentrated business model focused on uranium extraction and processing, offering direct exposure to production risks and opportunities. Uranium Royalty employs a diversified royalty approach across multiple projects, reducing operational risk but depending on third-party production success.
Which has the best competitive advantage?
Both companies are shedding value with ROIC below WACC, but Energy Fuels shows a growing ROIC trend (Slightly Unfavorable), while Uranium Royalty’s declining ROIC trend results in a Very Unfavorable moat, indicating Energy Fuels currently holds a marginally better competitive advantage.
Stock Comparison
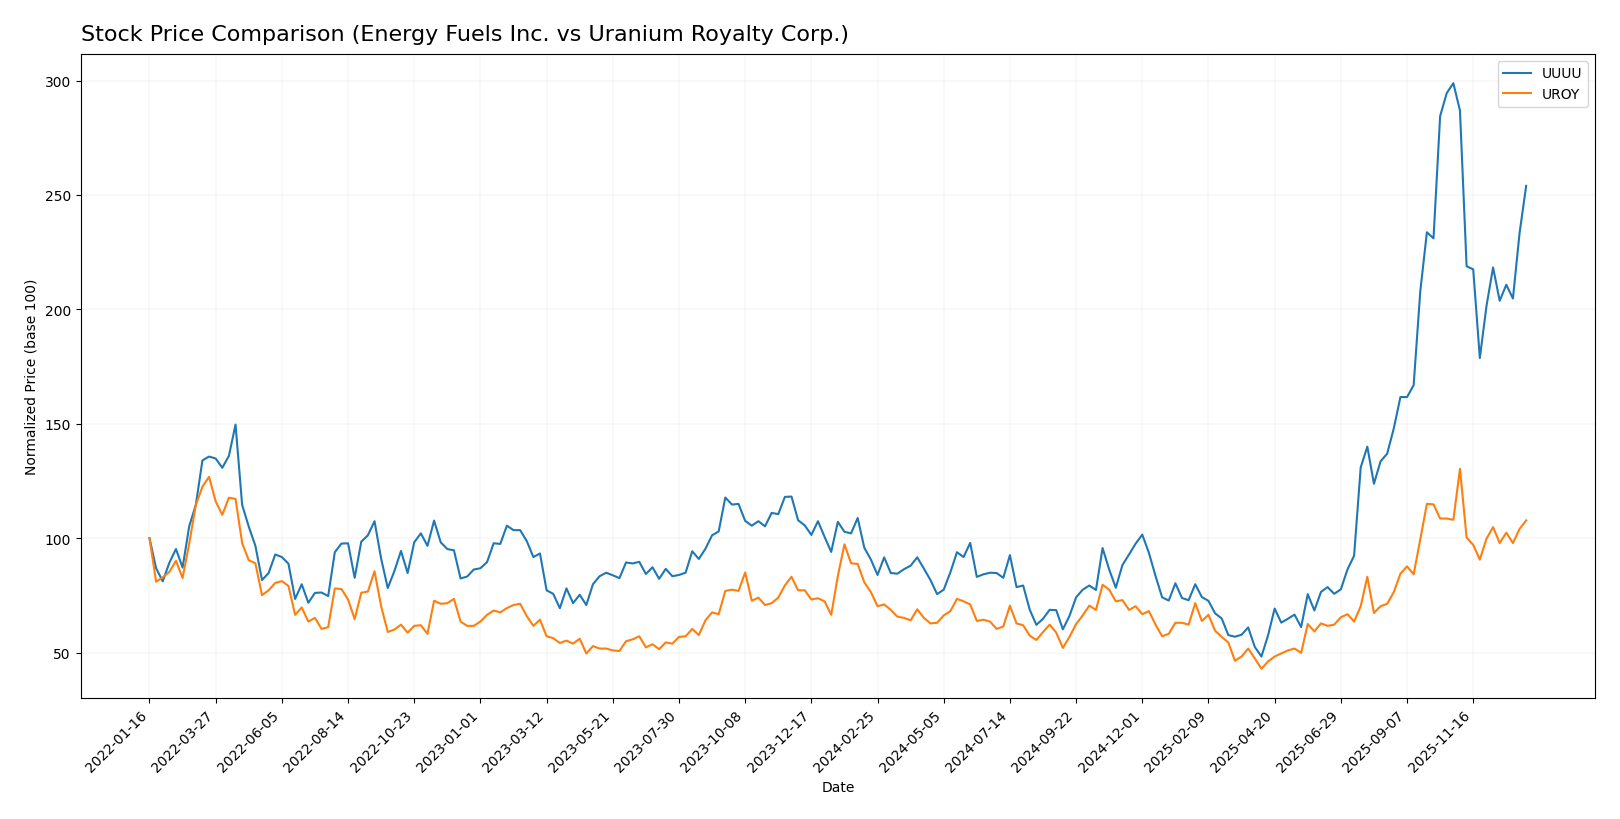
The past year has seen significant price movements and evolving trading dynamics for Energy Fuels Inc. and Uranium Royalty Corp., with both stocks exhibiting bullish trends but showing signs of deceleration.
Trend Analysis
Energy Fuels Inc. (UUUU) posted a strong 180.25% price increase over the past 12 months, indicating a bullish trend with deceleration. The stock ranged from a low of 3.45 to a high of 21.37, with overall volatility at 4.44.
Uranium Royalty Corp. (UROY) experienced a 41.05% price rise over the same period, also bullish but with deceleration. It showed lower volatility at 0.67, with prices fluctuating between 1.6 and 4.86.
Comparing the two, Energy Fuels Inc. delivered the highest market performance over the past year, outperforming Uranium Royalty Corp. by a wide margin in price appreciation.
Target Prices
The target price consensus for Energy Fuels Inc. shows a moderately bullish outlook among analysts.
| Company | Target High | Target Low | Consensus |
|---|---|---|---|
| Energy Fuels Inc. | 26.75 | 11.5 | 19.13 |
Analysts expect Energy Fuels Inc. to trade above the current price of 18.16 USD, indicating potential upside. No verified target price data is available for Uranium Royalty Corp. at this time.
Analyst Opinions Comparison
This section compares analysts’ ratings and grades for Energy Fuels Inc. and Uranium Royalty Corp.:
Rating Comparison
Energy Fuels Inc. Rating
- Rating: D+ with a very favorable rating status.
- Discounted Cash Flow Score: 1, very unfavorable.
- ROE Score: 1, very unfavorable.
- ROA Score: 1, very unfavorable.
- Debt To Equity Score: 1, very unfavorable.
- Overall Score: 1, very unfavorable.
Uranium Royalty Corp. Rating
- Rating: C- with a very favorable rating status.
- Discounted Cash Flow Score: 1, very unfavorable.
- ROE Score: 1, very unfavorable.
- ROA Score: 1, very unfavorable.
- Debt To Equity Score: 4, favorable.
- Overall Score: 1, very unfavorable.
Which one is the best rated?
Both companies share very unfavorable scores for most financial metrics and overall scores. Uranium Royalty Corp. has a better rating (C- vs. D+) and a favorable debt to equity score, suggesting slightly stronger financial stability.
Scores Comparison
Here is a comparison of the Altman Z-Score and Piotroski Score for Energy Fuels Inc. and Uranium Royalty Corp.:
Energy Fuels Inc. Scores
- Altman Z-Score: 40.3, indicating a safe zone for bankruptcy risk.
- Piotroski Score: 1, classified as very weak financial strength.
Uranium Royalty Corp. Scores
- Altman Z-Score: 388.4, indicating a safe zone for bankruptcy risk.
- Piotroski Score: 3, classified as very weak financial strength.
Which company has the best scores?
Uranium Royalty Corp. has a much higher Altman Z-Score than Energy Fuels Inc., both in the safe zone. Both companies have very weak Piotroski Scores, with UROY slightly higher than UUUU.
Grades Comparison
The following sections present the most recent reliable grades for Energy Fuels Inc. and Uranium Royalty Corp.:
Energy Fuels Inc. Grades
This table summarizes recent grades assigned by reputable financial analysts to Energy Fuels Inc.:
| Grading Company | Action | New Grade | Date |
|---|---|---|---|
| HC Wainwright & Co. | Maintain | Buy | 2026-01-09 |
| Roth Capital | Downgrade | Sell | 2025-11-05 |
| HC Wainwright & Co. | Maintain | Buy | 2025-11-04 |
| HC Wainwright & Co. | Maintain | Buy | 2025-10-21 |
| B. Riley Securities | Maintain | Buy | 2025-10-08 |
| HC Wainwright & Co. | Maintain | Buy | 2025-09-17 |
| HC Wainwright & Co. | Maintain | Buy | 2025-08-08 |
| Canaccord Genuity | Maintain | Buy | 2025-07-02 |
| HC Wainwright & Co. | Maintain | Buy | 2025-05-09 |
| HC Wainwright & Co. | Maintain | Buy | 2025-02-28 |
Energy Fuels Inc. shows a strong buy consensus with mostly buy ratings, though Roth Capital issued a sell downgrade recently.
Uranium Royalty Corp. Grades
Below is a summary of recent grades for Uranium Royalty Corp. from established grading firms:
| Grading Company | Action | New Grade | Date |
|---|---|---|---|
| HC Wainwright & Co. | Maintain | Buy | 2025-04-22 |
| HC Wainwright & Co. | Maintain | Buy | 2024-12-19 |
| HC Wainwright & Co. | Maintain | Buy | 2024-09-17 |
| HC Wainwright & Co. | Maintain | Buy | 2024-06-17 |
| HC Wainwright & Co. | Maintain | Buy | 2024-03-11 |
| HC Wainwright & Co. | Maintain | Buy | 2022-01-03 |
| HC Wainwright & Co. | Maintain | Buy | 2021-09-29 |
| HC Wainwright & Co. | Maintain | Buy | 2021-09-28 |
| HC Wainwright & Co. | Maintain | Buy | 2021-07-02 |
| HC Wainwright & Co. | Maintain | Buy | 2021-07-01 |
Uranium Royalty Corp. has consistently maintained buy ratings from HC Wainwright & Co. over several years.
Which company has the best grades?
Both Energy Fuels Inc. and Uranium Royalty Corp. have predominantly buy ratings; however, Energy Fuels Inc. exhibits more analyst coverage with a recent sell downgrade. Uranium Royalty Corp. maintains a stable buy rating exclusively from HC Wainwright & Co. Investors may view the broader analyst consensus for Energy Fuels as indicating higher scrutiny or varied opinions.
Strengths and Weaknesses
The table below compares key strengths and weaknesses of Energy Fuels Inc. (UUUU) and Uranium Royalty Corp. (UROY) based on diversification, profitability, innovation, global presence, and market share using the most recent data.
| Criterion | Energy Fuels Inc. (UUUU) | Uranium Royalty Corp. (UROY) |
|---|---|---|
| Diversification | Limited product diversification; focus on uranium and related materials | Focused on uranium royalties; limited diversification |
| Profitability | Negative net margin (-61.15%), ROIC -6.67%, but improving profitability trend | Negative net margin (-36.26%), ROIC -1.63%, declining profitability trend |
| Innovation | Moderate asset turnover, some operational efficiency | High fixed asset turnover, but low overall asset turnover |
| Global presence | Primarily North American operations; modest global reach | Mainly Canadian market with royalty interests globally |
| Market Share | Niche player in uranium mining sector | Niche in uranium royalty sector; smaller market share |
Key takeaways: Both companies face profitability challenges with negative returns and unfavorable financial ratios. Energy Fuels shows improving profitability trends, signaling potential recovery, while Uranium Royalty struggles with declining returns. Neither company has strong diversification or dominant market share, increasing investment risk.
Risk Analysis
Below is a comparative risk table for Energy Fuels Inc. (UUUU) and Uranium Royalty Corp. (UROY) based on the most recent 2024-2025 data.
| Metric | Energy Fuels Inc. (UUUU) | Uranium Royalty Corp. (UROY) |
|---|---|---|
| Market Risk | High beta 1.85, volatile range $3.2-$27.33 | Higher beta 2.03, range $1.43-$5.37 |
| Debt level | Very low debt (D/E = 0), debt-to-assets 0.36% | Very low debt (D/E = 0), debt-to-assets 0.07% |
| Regulatory Risk | High, mining and uranium regulations in multiple US states | Moderate, royalty business with diversified geographic exposure |
| Operational Risk | Significant, complex operations with multiple active and exploration sites | Lower, focused on royalty income without direct operations |
| Environmental Risk | Elevated, uranium mining has substantial environmental scrutiny | Lower, indirect exposure via royalties |
| Geopolitical Risk | US-centered operations, less exposure | Exposure to Canada, US, Namibia, and others, moderate geopolitical risk |
Energy Fuels carries high operational and environmental risks due to direct uranium mining and processing, with market volatility amplified by a beta near 1.85. Uranium Royalty Corp. faces lower operational risk but is exposed to geopolitical risk through its diversified global royalty portfolio. Both companies have minimal debt, reducing financial risk, but face unfavorable profitability metrics and regulatory challenges inherent to the uranium sector.
Which Stock to Choose?
Energy Fuels Inc. (UUUU) shows a strong revenue growth of 4611% over 2020-2024 but suffers from negative profitability and unfavorable financial ratios, including a -9.05% ROE and a slightly unfavorable moat due to value destruction despite improving ROIC. Its rating is very favorable (D+), yet the overall financial health appears weak.
Uranium Royalty Corp. (UROY) experienced declining income with a -63.48% revenue drop last year and mostly unfavorable ratios, including a -1.92% ROE and a very unfavorable moat with decreasing profitability. Its rating is also very favorable (C-), but the company faces significant financial challenges and value erosion.
Investors focused on growth might find Energy Fuels Inc. more appealing given its strong revenue rebound and improving ROIC trend, while risk-averse or value-oriented investors could view Uranium Royalty Corp. as less favorable due to its declining profitability and deteriorating financial metrics.
Disclaimer: Investment carries a risk of loss of initial capital. The past performance is not a reliable indicator of future results. Be sure to understand risks before making an investment decision.
Go Further
I encourage you to read the complete analyses of Energy Fuels Inc. and Uranium Royalty Corp. to enhance your investment decisions: