Energy Fuels Inc. (UUUU) and Ur-Energy Inc. (URG) are two prominent players in the uranium industry, both focused on uranium extraction and development within the United States. They compete in overlapping markets with distinct project portfolios and differing scales of operation, reflecting varied innovation strategies in a critical energy sector. This article will explore their strengths and risks to help you identify which company holds the most promise for your investment portfolio.
Table of contents
Companies Overview
I will begin the comparison between Energy Fuels Inc. and Ur-Energy Inc. by providing an overview of these two companies and their main differences.
Energy Fuels Inc. Overview
Energy Fuels Inc. specializes in the extraction, recovery, exploration, and sale of conventional and in situ uranium in the United States. The company owns several uranium projects and a mill across Wyoming, Texas, and Utah. Founded in 1987 and headquartered in Lakewood, Colorado, Energy Fuels operates in the uranium industry with a market cap of approximately 4.3B USD and employs around 1,260 people.
Ur-Energy Inc. Overview
Ur-Energy Inc. focuses on the acquisition, exploration, development, and operation of uranium mineral properties within the United States. It holds interests in 12 projects, notably the Lost Creek project in Wyoming. Established in 2004 and based in Littleton, Colorado, the company operates in the uranium sector with a market cap near 600M USD and has about 101 employees.
Key similarities and differences
Both companies operate in the uranium industry within the United States and are listed on the NYSE Arca exchange. Energy Fuels is significantly larger in market cap and workforce than Ur-Energy, reflecting a broader asset base and project portfolio. While Energy Fuels owns and operates multiple projects and a processing mill, Ur-Energy concentrates on fewer properties with a flagship project in Wyoming, indicating a difference in scale and operational focus.
Income Statement Comparison
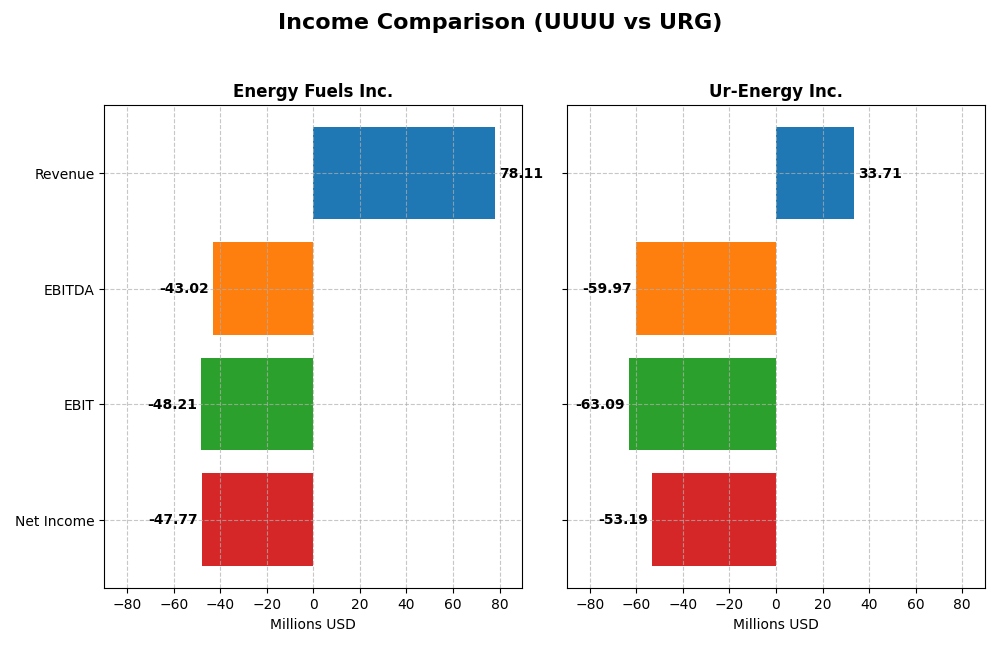
The following table presents a side-by-side comparison of key income statement metrics for Energy Fuels Inc. and Ur-Energy Inc. for the fiscal year 2024.
| Metric | Energy Fuels Inc. (UUUU) | Ur-Energy Inc. (URG) |
|---|---|---|
| Market Cap | 4.31B | 598M |
| Revenue | 78.1M | 33.7M |
| EBITDA | -43.0M | -59.9M |
| EBIT | -48.2M | -63.1M |
| Net Income | -47.8M | -53.2M |
| EPS | -0.28 | -0.17 |
| Fiscal Year | 2024 | 2024 |
Income Statement Interpretations
Energy Fuels Inc.
Energy Fuels Inc. showed a strong revenue growth of 4611% over 2020-2024, with a 106% increase from 2023 to 2024. Despite this, net income declined by 72% overall and turned negative in 2024, reflecting a net margin of -61.15%. Gross margin remained favorable at 21.76%, but EBIT margin and net margin deteriorated, indicating operational challenges in the latest year.
Ur-Energy Inc.
Ur-Energy Inc. experienced a 305% revenue increase over the period, with a 91% rise in 2024 compared to 2023. However, the company posted negative gross and EBIT margins (-26.62% and -187.17%), and net income declined sharply by 260% overall. Despite some improvement in net margin growth recently, persistent losses and unfavorable profitability metrics highlight ongoing financial strain.
Which one has the stronger fundamentals?
Energy Fuels Inc. exhibits more favorable profitability metrics, especially its positive gross margin and substantial revenue growth, although recent EBIT and net margins remain negative. Ur-Energy Inc. faces deeper margin deficits and a more unfavorable income statement evaluation despite revenue growth. Overall, Energy Fuels presents a more balanced financial profile, while Ur-Energy’s fundamentals appear weaker based on income statement performance.
Financial Ratios Comparison
The table below presents a side-by-side comparison of key financial ratios for Energy Fuels Inc. (UUUU) and Ur-Energy Inc. (URG) based on their most recent fiscal year data from 2024.
| Ratios | Energy Fuels Inc. (UUUU) | Ur-Energy Inc. (URG) |
|---|---|---|
| ROE | -9.05% | -40.05% |
| ROIC | -6.67% | -36.01% |
| P/E | -18.47 | -6.87 |
| P/B | 1.67 | 2.75 |
| Current Ratio | 3.88 | 5.99 |
| Quick Ratio | 2.76 | 4.91 |
| D/E (Debt-to-Equity) | 0.0041 | 0.0093 |
| Debt-to-Assets | 0.36% | 0.64% |
| Interest Coverage | 0 | 0 |
| Asset Turnover | 0.13 | 0.17 |
| Fixed Asset Turnover | 1.42 | 0 |
| Payout ratio | 0% | 0% |
| Dividend yield | 0% | 0% |
Interpretation of the Ratios
Energy Fuels Inc.
Energy Fuels Inc. shows several unfavorable ratios, including negative net margin (-61.15%) and return on equity (-9.05%), indicating profitability challenges. Its current ratio of 3.88 is considered unfavorable, despite a favorable quick ratio of 2.76. The company does not pay dividends, likely reflecting its ongoing reinvestment or operational struggles.
Ur-Energy Inc.
Ur-Energy Inc. also displays weak profitability with a net margin of -157.8% and return on equity at -40.05%. The current ratio is high at 5.99 but rated unfavorable, while quick ratio and debt metrics are favorable. This company does not pay dividends either, suggesting a focus on growth or reinvestment strategies amid financial difficulties.
Which one has the best ratios?
Both companies have a similar proportion of favorable and unfavorable ratios, each with 28.57% favorable and 57.14% unfavorable, resulting in an overall unfavorable evaluation. Neither company pays dividends, and both face significant profitability and operational challenges, with no clear superiority in their financial ratios.
Strategic Positioning
This section compares the strategic positioning of Energy Fuels Inc. and Ur-Energy Inc. in terms of market position, key segments, and exposure to technological disruption:
Energy Fuels Inc.
- Leading uranium producer with multiple US projects, facing moderate competitive pressure.
- Diverse assets including conventional and in situ uranium recovery, plus uranium/vanadium properties.
- Exposure to uranium industry technological shifts, operating conventional and in situ recovery methods.
Ur-Energy Inc.
- Smaller market cap with concentrated uranium mining operations in Wyoming, under competitive pressure.
- Focused on uranium acquisition, exploration, and operation mainly at Lost Creek project in Wyoming.
- Operates uranium mining with conventional exploration, limited diversification in technology adoption.
Energy Fuels Inc. vs Ur-Energy Inc. Positioning
Energy Fuels shows a diversified approach across multiple projects and extraction methods, providing broader market exposure. Ur-Energy is more concentrated in fewer assets, which may limit resilience but focus operations. Both operate within the same sector but differ in asset scope and scale.
Which has the best competitive advantage?
Based on MOAT evaluations, Energy Fuels has a slightly unfavorable position with growing profitability, while Ur-Energy faces a very unfavorable position with declining profitability, indicating Energy Fuels holds a comparatively stronger competitive advantage.
Stock Comparison
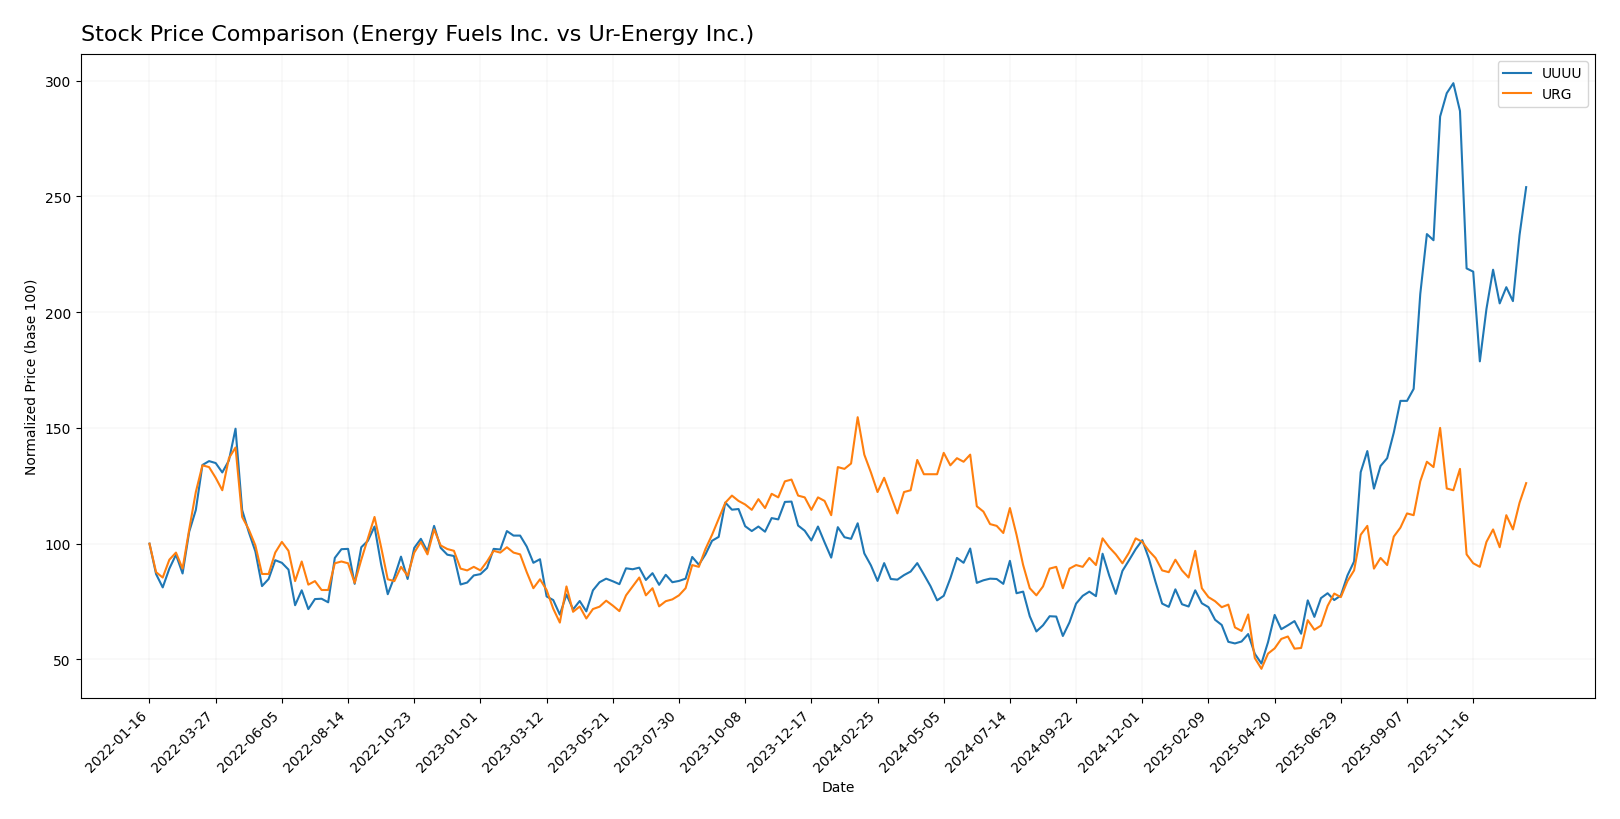
The stock price movements of Energy Fuels Inc. and Ur-Energy Inc. over the past 12 months reveal contrasting trajectories, with notable shifts in trading dynamics and volume trends reflecting changing investor sentiment.
Trend Analysis
Energy Fuels Inc. exhibited a strongly bullish trend over the past year, with a price increase of 180.25%. However, the trend shows deceleration and a recent short-term decline of 15.02%, indicating some volatility and a slight downward slope.
Ur-Energy Inc. recorded a bearish trend with a 3.53% price decrease over the same period, though its trend accelerated. Recently, it experienced a modest 2.5% price increase, suggesting early signs of stabilization or reversal.
Comparing both stocks, Energy Fuels Inc. delivered the highest market performance over the past year despite recent weakness, outperforming Ur-Energy Inc., which maintained a generally bearish stance.
Target Prices
The consensus target prices for Energy Fuels Inc. and Ur-Energy Inc. reflect moderate upside potential based on current analyst estimates.
| Company | Target High | Target Low | Consensus |
|---|---|---|---|
| Energy Fuels Inc. | 26.75 | 11.5 | 19.13 |
| Ur-Energy Inc. | 2.6 | 2.15 | 2.38 |
Analysts expect Energy Fuels Inc. shares to trade slightly above the current price of $18.16, while Ur-Energy Inc. shows a consensus target notably higher than its $1.64 market price, indicating potential appreciation.
Analyst Opinions Comparison
This section compares analysts’ ratings and grades for Energy Fuels Inc. and Ur-Energy Inc.:
Rating Comparison
Energy Fuels Inc. Rating
- Rating: D+, classified as Very Favorable
- Discounted Cash Flow Score: 1, Very Unfavorable
- ROE Score: 1, Very Unfavorable
- ROA Score: 1, Very Unfavorable
- Debt To Equity Score: 1, Very Unfavorable
- Overall Score: 1, Very Unfavorable
Ur-Energy Inc. Rating
- Rating: D+, classified as Very Favorable
- Discounted Cash Flow Score: 1, Very Unfavorable
- ROE Score: 1, Very Unfavorable
- ROA Score: 1, Very Unfavorable
- Debt To Equity Score: 2, Moderate
- Overall Score: 1, Very Unfavorable
Which one is the best rated?
Both companies have the same D+ rating with very unfavorable overall scores. Ur-Energy Inc. shows a moderately better debt-to-equity score than Energy Fuels Inc., indicating slightly lower financial risk in this aspect.
Scores Comparison
Here is a comparison of the Altman Z-Score and Piotroski Score for Energy Fuels Inc. and Ur-Energy Inc.:
Energy Fuels Inc. Scores
- Altman Z-Score: 40.34, indicating a safe zone status
- Piotroski Score: 1, classified as very weak
Ur-Energy Inc. Scores
- Altman Z-Score: 0.60, indicating distress zone status
- Piotroski Score: 2, also classified as very weak
Which company has the best scores?
Based on the provided data, Energy Fuels Inc. shows a significantly stronger Altman Z-Score, indicating better financial stability. However, both companies have very weak Piotroski Scores, suggesting limited financial strength.
Grades Comparison
Here is a detailed comparison of the recent grades assigned by reputable financial grading companies for both companies:
Energy Fuels Inc. Grades
The following table lists recent grades from recognized grading firms for Energy Fuels Inc.:
| Grading Company | Action | New Grade | Date |
|---|---|---|---|
| HC Wainwright & Co. | Maintain | Buy | 2026-01-09 |
| Roth Capital | Downgrade | Sell | 2025-11-05 |
| HC Wainwright & Co. | Maintain | Buy | 2025-11-04 |
| HC Wainwright & Co. | Maintain | Buy | 2025-10-21 |
| B. Riley Securities | Maintain | Buy | 2025-10-08 |
| HC Wainwright & Co. | Maintain | Buy | 2025-09-17 |
| HC Wainwright & Co. | Maintain | Buy | 2025-08-08 |
| Canaccord Genuity | Maintain | Buy | 2025-07-02 |
| HC Wainwright & Co. | Maintain | Buy | 2025-05-09 |
| HC Wainwright & Co. | Maintain | Buy | 2025-02-28 |
Overall, Energy Fuels Inc. has predominantly maintained Buy ratings, with one notable Sell downgrade from Roth Capital in late 2025.
Ur-Energy Inc. Grades
The recent grades from established grading companies for Ur-Energy Inc. are shown below:
| Grading Company | Action | New Grade | Date |
|---|---|---|---|
| HC Wainwright & Co. | Maintain | Buy | 2025-11-04 |
| B. Riley Securities | Maintain | Buy | 2025-09-25 |
| Roth Capital | Maintain | Buy | 2025-09-23 |
| HC Wainwright & Co. | Maintain | Buy | 2025-04-15 |
| HC Wainwright & Co. | Maintain | Buy | 2025-02-11 |
| Roth MKM | Maintain | Buy | 2024-10-23 |
| B. Riley Securities | Maintain | Buy | 2024-08-20 |
| HC Wainwright & Co. | Maintain | Buy | 2024-08-14 |
| HC Wainwright & Co. | Maintain | Buy | 2024-07-17 |
| Roth MKM | Maintain | Buy | 2024-05-09 |
Ur-Energy Inc. shows a consistent pattern of Buy ratings with no downgrades or Sell recommendations during the same period.
Which company has the best grades?
Ur-Energy Inc. holds a stronger and more consistent Buy rating trend compared to Energy Fuels Inc., which experienced a Sell downgrade. This suggests greater analyst confidence in Ur-Energy, potentially affecting investor sentiment and portfolio decisions.
Strengths and Weaknesses
Below is a comparison of key strengths and weaknesses of Energy Fuels Inc. (UUUU) and Ur-Energy Inc. (URG) based on recent financial and operational data.
| Criterion | Energy Fuels Inc. (UUUU) | Ur-Energy Inc. (URG) |
|---|---|---|
| Diversification | Limited product segmentation; focused on uranium | Limited product segmentation; focused on uranium |
| Profitability | Negative net margin (-61.15%), ROIC -6.67%, shedding value but improving ROIC trend (+53.7%) | Negative net margin (-157.8%), ROIC -36.01%, shedding value with declining ROIC trend (-112.5%) |
| Innovation | Moderate innovation with improving asset turnover (1.42 fixed asset turnover) | Weak innovation, fixed asset turnover is zero |
| Global presence | Modest global presence, stable but limited expansion | Modest global presence, no significant growth |
| Market Share | Small and niche market share in uranium mining | Small and niche market share in uranium mining |
Key takeaways: Both companies are currently unprofitable and destroying shareholder value, but Energy Fuels shows signs of operational improvement with a growing ROIC, whereas Ur-Energy faces worsening profitability and efficiency. Investors should weigh Energy Fuels’ improving trend against Ur-Energy’s declining performance when considering exposure to this sector.
Risk Analysis
Below is a comparison of key risks faced by Energy Fuels Inc. (UUUU) and Ur-Energy Inc. (URG) based on the most recent data from 2024.
| Metric | Energy Fuels Inc. (UUUU) | Ur-Energy Inc. (URG) |
|---|---|---|
| Market Risk | High beta (1.85) indicates strong volatility. | Moderate beta (1.04) reflects moderate volatility. |
| Debt level | Very low debt (D/E = 0.0), low debt-to-assets (0.36%), low financial risk. | Low debt (D/E = 0.01), slightly higher debt-to-assets (0.64%), manageable risk. |
| Regulatory Risk | Significant due to uranium industry regulations and permitting delays in multiple US states. | Similar regulatory exposure with uranium mining permits in Wyoming and elsewhere. |
| Operational Risk | Large-scale operations with multiple projects; asset turnover low, indicating inefficiency and potential operational challenges. | Smaller scale with 12 projects but very low asset turnover and fixed asset turnover, suggesting operational constraints. |
| Environmental Risk | High due to uranium extraction and milling activities, potential contamination, and waste management issues. | Similar environmental risks inherent to uranium mining and processing. |
| Geopolitical Risk | US-focused operations reduce international geopolitical risk but sensitive to US energy policy shifts. | Same US-centric profile with exposure to domestic policy changes impacting uranium demand. |
Energy Fuels shows higher market volatility and operational scale, while Ur-Energy faces greater financial distress risk with Altman Z-Score in the distress zone. Both companies suffer from negative profitability and weak financial performance. Regulatory and environmental risks remain critical given the uranium sector’s sensitivity. I advise cautious consideration with attention to market fluctuations and regulatory developments.
Which Stock to Choose?
Energy Fuels Inc. (UUUU) has shown strong revenue growth of 105.95% in 2024, with a neutral overall income statement evaluation. However, its profitability ratios are mostly unfavorable, including a negative ROE of -9.05% and a high WACC of 12.47%. The company carries low debt and a favorable quick ratio but suffers from poor asset turnover and interest coverage, resulting in an unfavorable global financial ratios opinion.
Ur-Energy Inc. (URG) experienced 90.66% revenue growth in 2024 but faces greater profitability challenges with a net margin of -157.8% and a ROE of -40.05%. Its debt level is moderate, and liquidity ratios are favorable, but fixed asset turnover and interest coverage are lacking. The overall income statement and financial ratios evaluations are unfavorable, with a declining ROIC trend indicating value destruction.
For investors prioritizing improving profitability and growth, Energy Fuels’ growing ROIC and neutral income evaluation might appear more favorable, while those focused on cautious capital preservation may view Ur-Energy’s higher leverage and worsening profitability as greater risks. The very unfavorable ratings and financial metrics of both companies suggest careful consideration of risk tolerance and investment horizon.
Disclaimer: Investment carries a risk of loss of initial capital. The past performance is not a reliable indicator of future results. Be sure to understand risks before making an investment decision.
Go Further
I encourage you to read the complete analyses of Energy Fuels Inc. and Ur-Energy Inc. to enhance your investment decisions: