NexGen Energy Ltd. and Energy Fuels Inc. are two prominent players in the uranium industry, each driving innovation in resource extraction and development. NexGen focuses on exploration and development in Canada’s Athabasca Basin, while Energy Fuels operates extensive uranium recovery projects across the United States. Their overlapping market presence and differing strategies make them compelling candidates for comparison. In this article, I will help you determine which company stands out as the more attractive investment opportunity.
Table of contents
Companies Overview
I will begin the comparison between NexGen Energy Ltd. and Energy Fuels Inc. by providing an overview of these two companies and their main differences.
NexGen Energy Ltd. Overview
NexGen Energy Ltd. is an exploration and development stage company focused on acquiring, exploring, and developing uranium properties in Canada. Its main asset is the Rook I project, a large contiguous mineral claim area in Saskatchewan’s Athabasca Basin. NexGen is headquartered in Vancouver and operates within the energy sector, positioning itself as a key player in Canadian uranium exploration.
Energy Fuels Inc. Overview
Energy Fuels Inc. engages in uranium extraction, recovery, exploration, and sales primarily in the United States. It owns multiple projects across Wyoming, Texas, and Utah, including the White Mesa Mill, and holds various uranium and uranium/vanadium property interests. Founded in 1987 and based in Lakewood, Colorado, Energy Fuels is a well-established uranium producer and processor in the U.S. energy market.
Key similarities and differences
Both companies operate in the uranium industry within the energy sector, focusing on exploration and development of uranium resources. NexGen emphasizes Canadian projects with a single major asset, while Energy Fuels manages a diversified portfolio of uranium properties and processing facilities mainly in the U.S. NexGen is smaller in scale with fewer employees and a market cap of 7B USD compared to Energy Fuels’ 4.3B USD and larger workforce.
Income Statement Comparison
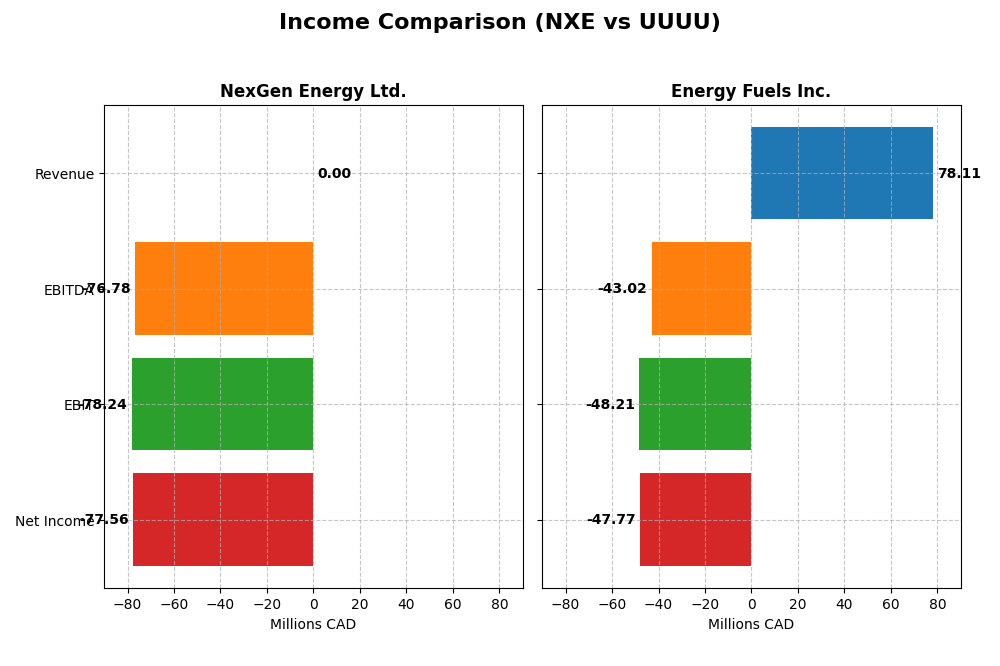
This table presents a side-by-side comparison of the most recent fiscal year income statement metrics for NexGen Energy Ltd. and Energy Fuels Inc., showing key financial figures in their reported currencies.
| Metric | NexGen Energy Ltd. (NXE) | Energy Fuels Inc. (UUUU) |
|---|---|---|
| Market Cap | 7B CAD | 4.3B USD |
| Revenue | 0 CAD | 78M USD |
| EBITDA | -77M CAD | -43M USD |
| EBIT | -78M CAD | -48M USD |
| Net Income | -78M CAD | -48M USD |
| EPS | -0.14 CAD | -0.28 USD |
| Fiscal Year | 2024 | 2024 |
Income Statement Interpretations
NexGen Energy Ltd.
NexGen Energy Ltd. shows zero revenue throughout the period with persistent net losses except for a positive net income in 2023. Margins remain unfavorable, with zero gross and EBIT margins, reflecting no operational profitability. The latest year, 2024, saw a significant decline in EBIT and net income, indicating a slowdown and worsening profitability despite stable expenses and favorable interest expense trends.
Energy Fuels Inc.
Energy Fuels Inc. experienced a strong upward trend in revenue, growing over 4600% across the period, with a positive gross margin of 21.76% in 2024. However, EBIT and net margins remain negative and unfavorable in the latest year, reflecting ongoing operational losses despite increased sales. Recent growth slowed on EBIT and net income, with EPS declining, signaling mixed performance despite revenue gains.
Which one has the stronger fundamentals?
Energy Fuels presents more favorable revenue growth and gross margin, but suffers from poor EBIT and net margins, indicating operational challenges. NexGen Energy has zero revenue and persistent losses but shows some positive net income growth overall. Given Energy Fuels’ neutral global income statement opinion versus NexGen’s unfavorable assessment, Energy Fuels currently demonstrates relatively stronger income fundamentals, though both face significant profitability risks.
Financial Ratios Comparison
Below is a comparison of key financial ratios for NexGen Energy Ltd. (NXE) and Energy Fuels Inc. (UUUU) based on their most recent fiscal year data for 2024.
| Ratios | NexGen Energy Ltd. (NXE) | Energy Fuels Inc. (UUUU) |
|---|---|---|
| ROE | -6.58% | -9.05% |
| ROIC | -4.39% | -6.67% |
| P/E | -67.80 | -18.47 |
| P/B | 4.46 | 1.67 |
| Current Ratio | 1.03 | 3.88 |
| Quick Ratio | 1.03 | 2.76 |
| D/E (Debt-to-Equity) | 0.39 | 0.004 |
| Debt-to-Assets | 27.56% | 0.36% |
| Interest Coverage | -2.33 | 0 |
| Asset Turnover | 0 | 0.13 |
| Fixed Asset Turnover | 0 | 1.42 |
| Payout Ratio | 0 | 0 |
| Dividend Yield | 0 | 0 |
Interpretation of the Ratios
NexGen Energy Ltd.
NexGen Energy presents several unfavorable profitability ratios, including negative return on equity (-6.58%) and return on invested capital (-4.39%), alongside a zero net margin. The company’s leverage and liquidity ratios are mixed, with a favorable debt-to-equity ratio (0.39) but an unfavorable interest coverage ratio (-2.4). NexGen pays no dividends, reflecting its exploration and development stage focus, reinvesting capital rather than distributing returns.
Energy Fuels Inc.
Energy Fuels also shows weak profitability with a net margin of -61.15% and negative returns on equity (-9.05%) and invested capital (-6.67%). Its liquidity ratios are varied, featuring a high current ratio (3.88) flagged as unfavorable due to potential asset inefficiency, but a favorable quick ratio (2.76). The company does not pay dividends, likely prioritizing growth and operational expenditures over shareholder payouts.
Which one has the best ratios?
Both NexGen Energy and Energy Fuels share an overall unfavorable ratio profile, with 64.29% and 57.14% unfavorable ratios, respectively. NexGen’s weaker profitability and interest coverage contrast with Energy Fuels’ liquidity concerns and higher asset turnover neutrality. Neither company pays dividends, reflecting their reinvestment priorities in a challenging sector.
Strategic Positioning
This section compares the strategic positioning of NexGen Energy Ltd. and Energy Fuels Inc. regarding market position, key segments, and exposure to technological disruption:
NexGen Energy Ltd.
- Focuses on uranium exploration and development in Canada’s Athabasca Basin; faces competitive pressure in uranium industry.
- Key asset is the Rook I project with 35,065 hectares in Canada; business driven by uranium property development.
- No explicit mention of exposure to technological disruption; operates in a traditional uranium exploration sector.
Energy Fuels Inc.
- Engages in uranium extraction, recovery, and sale in the US with multiple operational projects across several states.
- Operates Nichols Ranch, White Mesa Mill, and other uranium/vanadium projects; driven by uranium production and recovery.
- No specific data on technological disruption exposure; operates conventional and in situ uranium recovery projects.
NexGen Energy Ltd. vs Energy Fuels Inc. Positioning
NexGen is concentrated on a single large Canadian uranium project, implying a focused business model. Energy Fuels has a more diversified US asset base, spanning multiple projects and uranium recovery methods, offering broader operational scope but also complexity.
Which has the best competitive advantage?
Both companies are currently shedding value with ROIC below WACC, though both show improving profitability trends. Their slight unfavorable moat status indicates limited competitive advantages based on the available data.
Stock Comparison
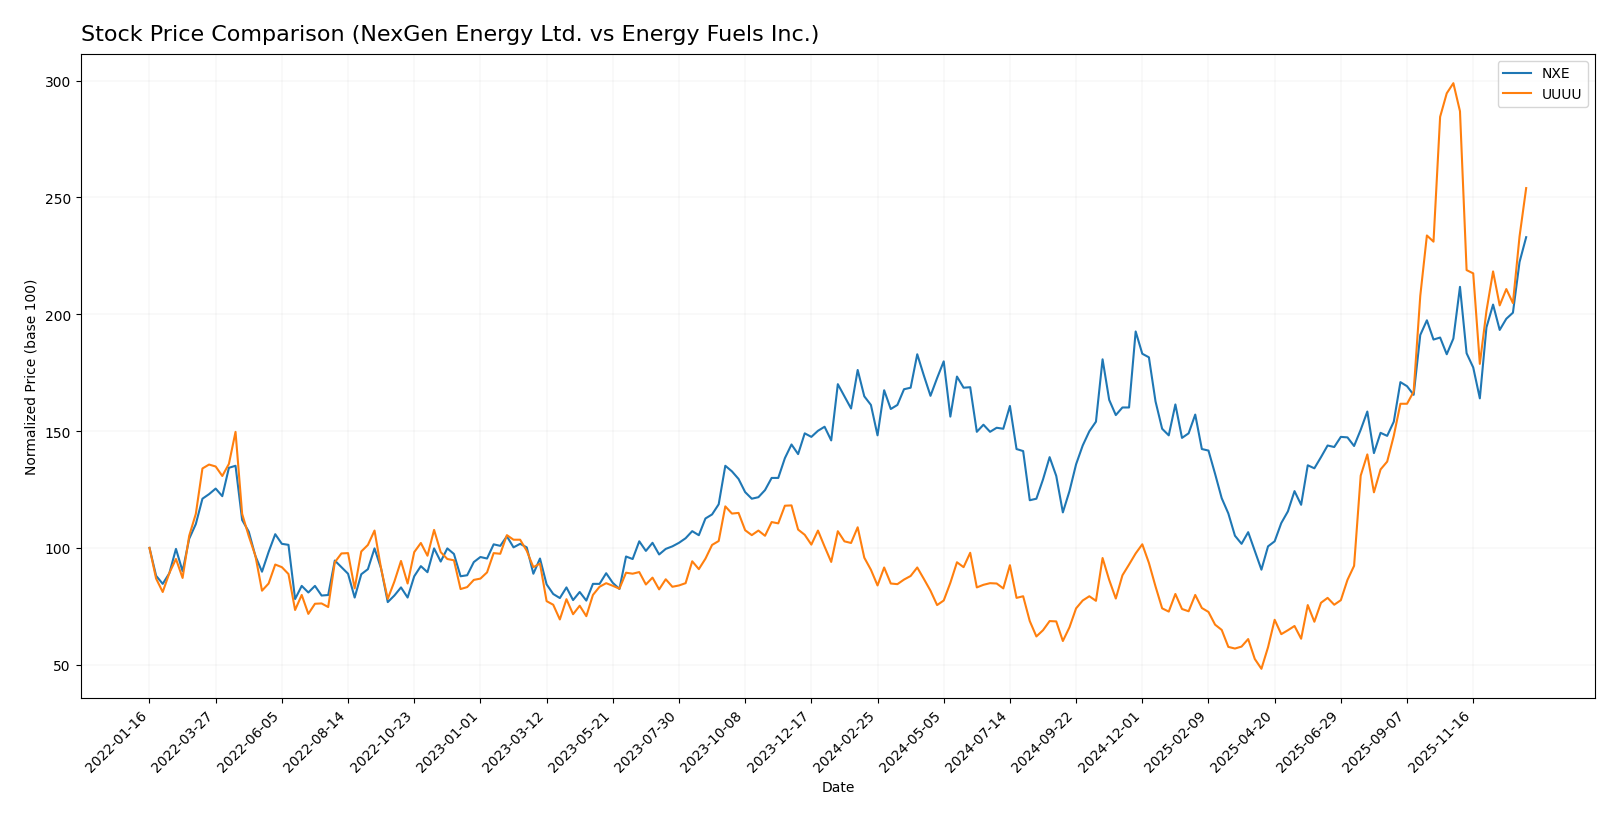
The stock price movements over the past year reveal significant gains for both NexGen Energy Ltd. (NXE) and Energy Fuels Inc. (UUUU), with distinct trading dynamics and shifts in momentum reflecting their market performance.
Trend Analysis
NexGen Energy Ltd. (NXE) showed a bullish trend over the past 12 months with a 44.55% price increase and accelerating momentum. The stock traded between a low of 4.18 and a high of 10.74, maintaining relatively low volatility (1.3 std deviation).
Energy Fuels Inc. (UUUU) experienced a strong bullish trend over the same period, gaining 180.25% despite deceleration. It displayed higher volatility (4.44 std deviation) and ranged from 3.45 to 21.37, with recent downward pressure reducing gains by 15.02%.
Comparing both stocks, UUUU delivered the highest market performance over the past year with a 180.25% rise, outperforming NXE’s 44.55% increase despite recent trend weakening.
Target Prices
The target consensus for Energy Fuels Inc. reflects moderate optimism among analysts.
| Company | Target High | Target Low | Consensus |
|---|---|---|---|
| Energy Fuels Inc. | 26.75 | 11.5 | 19.13 |
Analysts expect Energy Fuels Inc. to appreciate moderately, with the consensus target price about 5% above the current stock price of $18.16. No verified target price data is available for NexGen Energy Ltd.
Analyst Opinions Comparison
This section compares the analysts’ ratings and financial grades for NexGen Energy Ltd. and Energy Fuels Inc.:
Rating Comparison
NexGen Energy Ltd. Rating
- Rating: D+ with a very favorable status
- Discounted Cash Flow Score: 2, indicating moderate value
- ROE Score: 1, indicating very unfavorable profitability
- ROA Score: 1, indicating very unfavorable asset efficiency
- Debt To Equity Score: 1, indicating very unfavorable financial risk
- Overall Score: 1, indicating very unfavorable overall assessment
Energy Fuels Inc. Rating
- Rating: D+ with a very favorable status
- Discounted Cash Flow Score: 1, indicating very unfavorable value
- ROE Score: 1, indicating very unfavorable profitability
- ROA Score: 1, indicating very unfavorable asset efficiency
- Debt To Equity Score: 1, indicating very unfavorable financial risk
- Overall Score: 1, indicating very unfavorable overall assessment
Which one is the best rated?
Both NexGen Energy Ltd. and Energy Fuels Inc. share the same overall rating of D+ with very favorable status. NexGen shows a slightly better discounted cash flow score, but all other scores are equally very unfavorable for both companies.
Scores Comparison
Here is a comparison of the Altman Z-Score and Piotroski Score for NexGen Energy Ltd. and Energy Fuels Inc.:
NexGen Energy Ltd. Scores
- Altman Z-Score: 6.89, indicating a strong safe zone.
- Piotroski Score: 1, showing very weak financial strength.
Energy Fuels Inc. Scores
- Altman Z-Score: 40.34, indicating an extremely safe zone.
- Piotroski Score: 1, showing very weak financial strength.
Which company has the best scores?
Energy Fuels Inc. demonstrates a significantly higher Altman Z-Score, indicating stronger financial stability. Both companies share an equally low Piotroski Score, reflecting very weak financial strength.
Grades Comparison
Here is a comparison of the recent grades assigned to NexGen Energy Ltd. and Energy Fuels Inc.:
NexGen Energy Ltd. Grades
The following table summarizes the consensus grades available for NexGen Energy Ltd.:
| Grading Company | Action | New Grade | Date |
|---|---|---|---|
| Consensus | Buy | Buy | 2026 |
NexGen Energy Ltd. has a consistent consensus grade of “Buy” from four analysts, reflecting a positive but moderate outlook.
Energy Fuels Inc. Grades
The table below displays recent grading actions from several established grading companies for Energy Fuels Inc.:
| Grading Company | Action | New Grade | Date |
|---|---|---|---|
| HC Wainwright & Co. | Maintain | Buy | 2026-01-09 |
| Roth Capital | Downgrade | Sell | 2025-11-05 |
| HC Wainwright & Co. | Maintain | Buy | 2025-11-04 |
| HC Wainwright & Co. | Maintain | Buy | 2025-10-21 |
| B. Riley Securities | Maintain | Buy | 2025-10-08 |
| HC Wainwright & Co. | Maintain | Buy | 2025-09-17 |
| HC Wainwright & Co. | Maintain | Buy | 2025-08-08 |
| Canaccord Genuity | Maintain | Buy | 2025-07-02 |
| HC Wainwright & Co. | Maintain | Buy | 2025-05-09 |
| HC Wainwright & Co. | Maintain | Buy | 2025-02-28 |
Energy Fuels Inc. shows a strong pattern of mostly “Buy” ratings maintained by reputable firms, with one notable downgrade to “Sell” by Roth Capital.
Which company has the best grades?
Energy Fuels Inc. has received a broader range of analyst coverage with mostly “Buy” grades and one “Sell” downgrade, indicating some mixed sentiment. NexGen Energy Ltd. holds a consistent “Buy” consensus from fewer analysts. Investors may interpret Energy Fuels Inc.’s more diverse rating profile as reflecting higher scrutiny or risk, while NexGen’s uniform “Buy” consensus suggests steadier confidence.
Strengths and Weaknesses
Below is a comparison of key strengths and weaknesses of NexGen Energy Ltd. (NXE) and Energy Fuels Inc. (UUUU) based on recent financial and strategic metrics.
| Criterion | NexGen Energy Ltd. (NXE) | Energy Fuels Inc. (UUUU) |
|---|---|---|
| Diversification | Limited diversification; primarily focused on uranium | Limited diversification; uranium and rare earth elements focus |
| Profitability | Negative ROIC (-4.39%), unfavorable net margin; profitability improving but currently value destroying | Negative ROIC (-6.67%), significant net loss; profitability improving but value destroying |
| Innovation | Moderate innovation potential in uranium mining technology | Moderate innovation, some rare earth processing capabilities |
| Global presence | Primarily Canada-based with development projects | US-based with strategic positioning in domestic supply |
| Market Share | Small but growing in uranium sector | Small player in uranium and rare earth industries |
Key takeaways: Both companies currently operate at a loss with negative returns on invested capital, indicating value destruction. However, both show improving profitability trends. Investors should weigh the risks of ongoing unprofitability against future growth potential in the uranium and critical minerals market.
Risk Analysis
Below is a comparison of key risks for NexGen Energy Ltd. (NXE) and Energy Fuels Inc. (UUUU) based on the most recent data for 2024.
| Metric | NexGen Energy Ltd. (NXE) | Energy Fuels Inc. (UUUU) |
|---|---|---|
| Market Risk | High beta of 1.856 indicating significant volatility | High beta of 1.848, similarly volatile |
| Debt level | Moderate debt-to-equity ratio at 0.39, manageable | Near zero debt-to-equity, very low financial risk |
| Regulatory Risk | Moderate, due to uranium sector and Canadian regulations | Moderate, uranium industry with U.S. regulations |
| Operational Risk | High, early development stage with negative returns | High, operational complexity across multiple projects |
| Environmental Risk | Elevated, uranium mining involves environmental scrutiny | Elevated, uranium and vanadium extraction impacts |
| Geopolitical Risk | Moderate, Canadian base somewhat stable | Moderate to high, operations solely in U.S. with potential policy shifts |
The most impactful and likely risks for both companies are operational and environmental, driven by the uranium mining sector’s inherent challenges and regulatory environment. NXE faces higher market volatility but has manageable debt, while UUUU boasts very low debt but operates multiple projects increasing operational complexity. Both companies show weak profitability and financial health indicators, underscoring caution for investors.
Which Stock to Choose?
NexGen Energy Ltd. (NXE) shows stagnant income growth with a 10.03% net income increase over five years but zero revenue growth. Its profitability metrics, including ROE at -6.58% and ROIC at -4.39%, are unfavorable. Debt levels are moderate with a net debt to EBITDA of 0.26. The company’s overall rating is very favorable despite mostly unfavorable financial ratios, reflecting mixed financial health.
Energy Fuels Inc. (UUUU) experiences strong revenue growth of 4611% over five years but a 72% net income decline. Profitability remains negative with ROE at -9.05% and ROIC at -6.67%. Debt is minimal with net debt to EBITDA near zero. Its rating is very favorable, though financial ratios are largely unfavorable, indicating operational challenges despite top-line growth.
For risk-averse investors seeking stability, NXE’s moderate debt and improving profitability might appear more suitable, while growth-focused investors could find UUUU’s robust revenue expansion appealing despite profitability setbacks. Both companies show value destruction but improving returns, suggesting cautious interpretation based on investor risk tolerance and strategy.
Disclaimer: Investment carries a risk of loss of initial capital. The past performance is not a reliable indicator of future results. Be sure to understand risks before making an investment decision.
Go Further
I encourage you to read the complete analyses of NexGen Energy Ltd. and Energy Fuels Inc. to enhance your investment decisions: