Energy Fuels Inc. (UUUU) and IsoEnergy Ltd. (ISOU) are two prominent players in the uranium industry, each carving out distinct paths in resource development and extraction. While Energy Fuels operates primarily in the U.S. with established projects and processing facilities, IsoEnergy focuses on exploration in Canada’s Athabasca Basin, backed by innovative exploration strategies. This comparison will help investors discern which company offers the most compelling opportunity in the evolving uranium market. Let’s explore which stock might best fit your portfolio.
Table of contents
Companies Overview
I will begin the comparison between Energy Fuels Inc. and IsoEnergy Ltd. by providing an overview of these two companies and their main differences.
Energy Fuels Inc. Overview
Energy Fuels Inc. operates in the uranium industry, focusing on extraction, recovery, exploration, and sale of uranium in the United States. The company owns multiple projects and a mill across several states, including Wyoming, Texas, and Utah. Founded in 1987 and headquartered in Lakewood, Colorado, Energy Fuels positions itself as a key player in conventional and in situ uranium recovery within the U.S. energy sector.
IsoEnergy Ltd. Overview
IsoEnergy Ltd. is a uranium exploration and development company primarily active in the Athabasca Basin, Saskatchewan, Canada. Incorporated in 2016, it holds interests in several uranium properties and is a subsidiary of NexGen Energy Ltd. With a smaller workforce and market cap relative to Energy Fuels, IsoEnergy emphasizes acquisition and evaluation of uranium mineral assets, operating from its headquarters in Saskatoon.
Key similarities and differences
Both companies operate within the uranium energy sector, focusing on uranium mineral properties and exploration. Energy Fuels is well-established with diversified projects and operational mills in the U.S., employing 1,260 staff. IsoEnergy, younger and smaller with 18 employees, concentrates primarily on exploration in Canada’s Athabasca Basin. The contrast lies in scale, geographic focus, and stages of development, with Energy Fuels more operational and IsoEnergy more exploration-oriented.
Income Statement Comparison
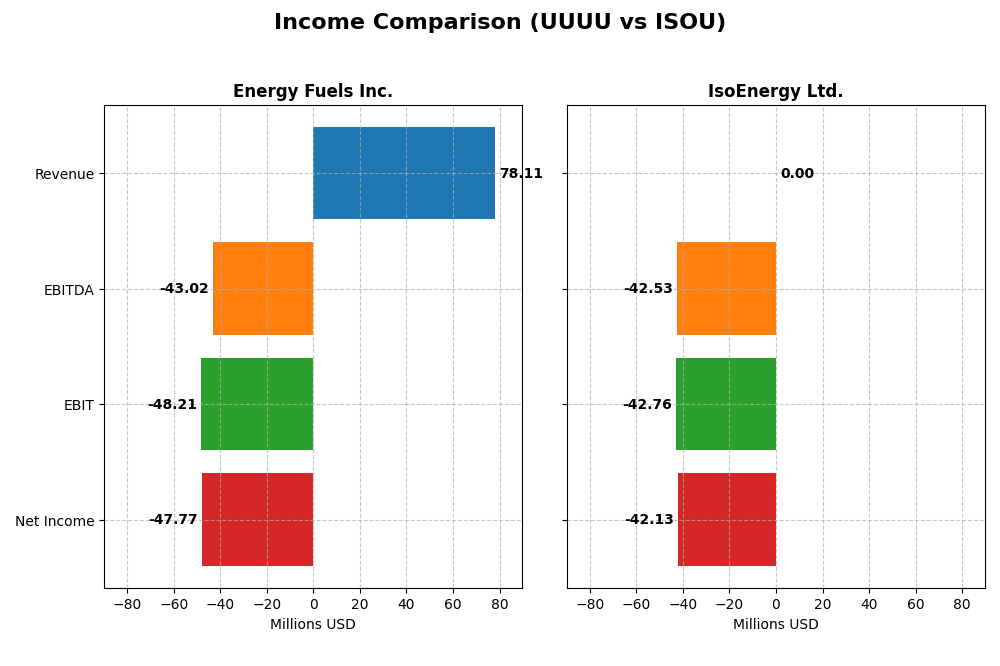
The following table presents a side-by-side comparison of key income statement metrics for Energy Fuels Inc. and IsoEnergy Ltd. for the fiscal year 2024.
| Metric | Energy Fuels Inc. (UUUU) | IsoEnergy Ltd. (ISOU) |
|---|---|---|
| Market Cap | 4.31B USD | 599M CAD |
| Revenue | 78.1M USD | 0 CAD |
| EBITDA | -43.0M USD | -42.5M CAD |
| EBIT | -48.2M USD | -42.8M CAD |
| Net Income | -47.8M USD | -42.1M CAD |
| EPS | -0.28 USD | -1.38 CAD |
| Fiscal Year | 2024 | 2024 |
Income Statement Interpretations
Energy Fuels Inc.
Energy Fuels Inc. showed strong revenue growth from 2020 to 2024, surging from 1.7M to 78.1M USD, although net income remained negative in 2024 at -47.8M USD. Gross margins held favorable at 21.76%, but EBIT and net margins turned unfavorable. The latest year marked a sharp revenue increase but worsening profitability, with a negative EPS of -0.28.
IsoEnergy Ltd.
IsoEnergy Ltd. reported zero revenue throughout 2020-2024, reflecting its exploration-stage status. Net losses deepened over the period, reaching -42.1M CAD in 2024. Margins remained unfavorable across all measures, with no improvement in gross, EBIT, or net margins. The 2024 results show increased operating expenses and a wider net loss per share of -1.38 CAD.
Which one has the stronger fundamentals?
Energy Fuels Inc. demonstrates stronger fundamentals due to its significant revenue growth and positive gross margin, despite net losses. IsoEnergy’s persistent zero revenue and increasing losses suggest weaker income fundamentals. Energy Fuels’ mixed margin results and recent profitability decline warrant caution, while IsoEnergy’s continued unfavorable income metrics highlight greater financial challenges.
Financial Ratios Comparison
The table below presents a side-by-side comparison of key financial ratios for Energy Fuels Inc. (UUUU) and IsoEnergy Ltd. (ISOU) based on their most recent fiscal year data, 2024.
| Ratios | Energy Fuels Inc. (UUUU) | IsoEnergy Ltd. (ISOU) |
|---|---|---|
| ROE | -9.05% | -13.90% |
| ROIC | -6.67% | -12.50% |
| P/E | -18.47 | -9.64 |
| P/B | 1.67 | 1.34 |
| Current Ratio | 3.88 | 1.70 |
| Quick Ratio | 2.76 | 1.70 |
| D/E (Debt-to-Equity) | 0.004 | 0.101 |
| Debt-to-Assets | 0.004 | 0.090 |
| Interest Coverage | 0 | -32.10 |
| Asset Turnover | 0.128 | 0 |
| Fixed Asset Turnover | 1.42 | 0 |
| Payout Ratio | 0 | 0 |
| Dividend Yield | 0% | 0% |
Interpretation of the Ratios
Energy Fuels Inc.
Energy Fuels Inc. shows predominantly unfavorable ratios, including a negative net margin of -61.15% and a return on equity of -9.05%. While the company has a strong quick ratio of 2.76 and zero debt-to-equity, concerns persist around poor asset turnover and interest coverage at zero. The company does not pay dividends, likely due to negative profitability and reinvestment needs.
IsoEnergy Ltd.
IsoEnergy Ltd. has a mixed ratio profile, with 42.86% favorable and 50% unfavorable ratios. The company’s current and quick ratios are both 1.7, indicating reasonable liquidity, but returns are negative with a -13.9% ROE and zero asset turnover. IsoEnergy also pays no dividends, consistent with its early-stage development focus and ongoing capital expenditures.
Which one has the best ratios?
Between the two, IsoEnergy Ltd. presents a slightly more favorable ratio profile with better liquidity metrics and lower debt levels, despite ongoing losses. Energy Fuels Inc. shows more significant financial strain with larger negative returns and poor operating efficiency. Both companies face challenges, but IsoEnergy’s ratios suggest marginally better financial health.
Strategic Positioning
This section compares the strategic positioning of Energy Fuels Inc. and IsoEnergy Ltd. in terms of Market position, Key segments, and Exposure to technological disruption:
Energy Fuels Inc.
- Leading U.S.-based uranium producer with significant assets and competitive presence.
- Focuses on uranium extraction, recovery, and exploration across multiple U.S. projects.
- No explicit mention of technological disruption exposure in provided data.
IsoEnergy Ltd.
- Smaller Canadian uranium explorer focused on Athabasca Basin properties.
- Concentrates on acquisition and development of uranium mineral properties in Canada.
- No explicit mention of technological disruption exposure in provided data.
Energy Fuels Inc. vs IsoEnergy Ltd. Positioning
Energy Fuels exhibits a diversified U.S. uranium production portfolio with established operations, while IsoEnergy remains concentrated on early-stage Canadian exploration. Energy Fuels’ scale contrasts with IsoEnergy’s smaller employee base and narrower geographic focus.
Which has the best competitive advantage?
Both companies are rated as Slightly Unfavorable on MOAT evaluation, showing value destruction but improving profitability. Neither currently demonstrates a strong sustainable competitive advantage based on ROIC versus WACC data.
Stock Comparison
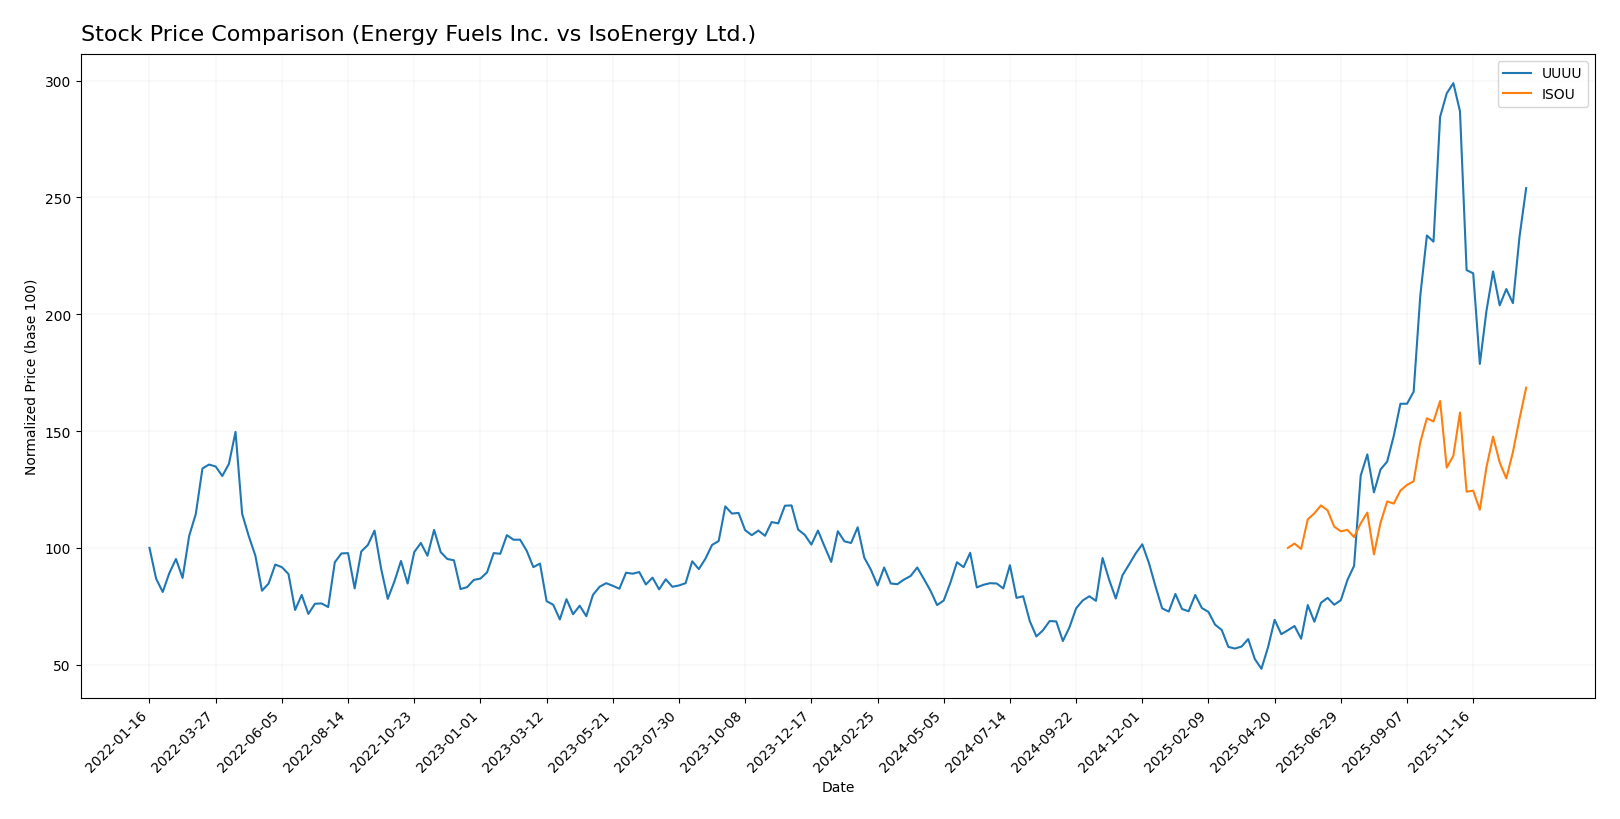
The stock prices of Energy Fuels Inc. and IsoEnergy Ltd. have shown significant movements over the past 12 months, with distinct bullish trends and recent divergences in performance dynamics.
Trend Analysis
Energy Fuels Inc. exhibited a strong bullish trend over the past year with a 180.25% price increase, though the trend showed deceleration. The stock’s highest price reached 21.37, with notable volatility at a 4.44 standard deviation.
IsoEnergy Ltd. also recorded a bullish trend with a 68.57% price increase and accelerating momentum. The stock’s highest price was 10.94, supported by lower volatility at a 1.25 standard deviation.
Comparing both, Energy Fuels Inc. delivered the highest market performance over the past year, despite recent downward pressure, while IsoEnergy Ltd. showed steadier gains with recent acceleration.
Target Prices
Energy Fuels Inc. shows a clear target price consensus from recognized analysts.
| Company | Target High | Target Low | Consensus |
|---|---|---|---|
| Energy Fuels Inc. | 26.75 | 11.5 | 19.13 |
Analysts expect Energy Fuels Inc.’s share price to rise moderately from the current 18.16 USD, suggesting a positive outlook with a balanced risk-reward profile. No verified target price data is available for IsoEnergy Ltd. at this time.
Analyst Opinions Comparison
This section compares analysts’ ratings and grades for Energy Fuels Inc. and IsoEnergy Ltd.:
Rating Comparison
Energy Fuels Inc. Rating
- Rating: D+, classified as Very Favorable by analysts.
- Discounted Cash Flow Score: 1, indicating Very Unfavorable DCF.
- ROE Score: 1, marked as Very Unfavorable for equity returns.
- ROA Score: 1, reflecting Very Unfavorable asset efficiency.
- Debt To Equity Score: 1, considered Very Unfavorable financial risk.
- Overall Score: 1, rated Very Unfavorable overall.
IsoEnergy Ltd. Rating
- Rating: C-, also classified as Very Favorable by analysts.
- Discounted Cash Flow Score: 1, indicating Very Unfavorable DCF.
- ROE Score: 1, marked as Very Unfavorable for equity returns.
- ROA Score: 1, reflecting Very Unfavorable asset efficiency.
- Debt To Equity Score: 3, considered Moderate financial risk.
- Overall Score: 1, rated Very Unfavorable overall.
Which one is the best rated?
Both companies share an overall score of 1, indicating a very unfavorable financial standing, but IsoEnergy Ltd. has a better debt-to-equity score at 3 (Moderate) versus Energy Fuels Inc.’s score of 1 (Very Unfavorable), suggesting a comparatively stronger balance sheet for IsoEnergy.
Scores Comparison
Here is a comparison of the Altman Z-Score and Piotroski Score for Energy Fuels Inc. and IsoEnergy Ltd.:
Energy Fuels Inc. Scores
- Altman Z-Score: 40.3, indicating a strong safe zone
- Piotroski Score: 1, classified as very weak
IsoEnergy Ltd. Scores
- Altman Z-Score: 19.2, also in the safe zone
- Piotroski Score: 2, classified as very weak
Which company has the best scores?
Both companies have Altman Z-Scores in the safe zone, with Energy Fuels Inc. scoring significantly higher. However, both have very weak Piotroski Scores, with IsoEnergy Ltd. slightly better at 2 versus 1.
Grades Comparison
The following presents the recent grades assigned to Energy Fuels Inc. and IsoEnergy Ltd.:
Energy Fuels Inc. Grades
This table lists recent grades given to Energy Fuels Inc. by recognized grading companies.
| Grading Company | Action | New Grade | Date |
|---|---|---|---|
| HC Wainwright & Co. | Maintain | Buy | 2026-01-09 |
| Roth Capital | Downgrade | Sell | 2025-11-05 |
| HC Wainwright & Co. | Maintain | Buy | 2025-11-04 |
| HC Wainwright & Co. | Maintain | Buy | 2025-10-21 |
| B. Riley Securities | Maintain | Buy | 2025-10-08 |
| HC Wainwright & Co. | Maintain | Buy | 2025-09-17 |
| HC Wainwright & Co. | Maintain | Buy | 2025-08-08 |
| Canaccord Genuity | Maintain | Buy | 2025-07-02 |
| HC Wainwright & Co. | Maintain | Buy | 2025-05-09 |
| HC Wainwright & Co. | Maintain | Buy | 2025-02-28 |
The overall trend for Energy Fuels Inc. shows a strong predominance of Buy ratings, with one recent Sell downgrade from Roth Capital.
IsoEnergy Ltd. Grades
No reliable grades or ratings are available for IsoEnergy Ltd. from recognized grading companies.
Which company has the best grades?
Energy Fuels Inc. has received predominantly Buy grades from multiple reputable firms, whereas IsoEnergy Ltd. has no available grades. This suggests clearer market analyst confidence in Energy Fuels Inc., which may influence investor sentiment and risk perception.
Strengths and Weaknesses
Below is a comparative summary of the key strengths and weaknesses of Energy Fuels Inc. (UUUU) and IsoEnergy Ltd. (ISOU) based on their recent financial and operational data.
| Criterion | Energy Fuels Inc. (UUUU) | IsoEnergy Ltd. (ISOU) |
|---|---|---|
| Diversification | Limited; focused primarily on uranium production | Limited; also concentrated on uranium sector |
| Profitability | Negative net margin (-61.15%), ROIC -6.67%, shedding value but improving profitability | Zero net margin, ROIC -12.5%, also shedding value with slight ROIC improvement |
| Innovation | Moderate; no significant data on innovation impact | Moderate; no significant data on innovation impact |
| Global presence | Primarily North America | Primarily Canada |
| Market Share | Small player in uranium mining | Small player in uranium mining |
Key takeaways: Both companies operate in a niche uranium market with limited diversification and small market share. Profitability is currently negative for both, indicating value destruction, though each shows some improvement in ROIC trends. Investors should approach with caution and monitor operational efficiency and market developments closely.
Risk Analysis
Below is a comparative overview of key risks for Energy Fuels Inc. and IsoEnergy Ltd. as of 2024.
| Metric | Energy Fuels Inc. (UUUU) | IsoEnergy Ltd. (ISOU) |
|---|---|---|
| Market Risk | High beta (1.85) indicates high volatility. Uranium price sensitivity impacts revenue. | Moderate beta (0.96), less volatile but dependent on uranium market trends. |
| Debt level | Very low debt-to-equity (0.0), strong balance sheet. | Low debt-to-equity (0.1), manageable leverage. |
| Regulatory Risk | Significant due to US uranium mining regulations and permitting delays. | Moderate, with Canadian regulatory environment and exploration permits needed. |
| Operational Risk | Large-scale operations with multiple mining projects; risk from production delays and cost overruns. | Smaller scale operations, early-stage exploration increases uncertainty. |
| Environmental Risk | High due to uranium mining’s environmental impact and waste management requirements. | High, as exploration activities must comply with strict environmental standards. |
| Geopolitical Risk | US-based operations, relatively stable but subject to US energy policy shifts. | Canadian operations, generally stable but dependent on resource sector policies. |
Energy Fuels faces the most impactful risks in market volatility and regulatory challenges in the US uranium sector, amplified by operational scale and environmental compliance. IsoEnergy, though smaller and less leveraged, carries exploration and market risks with less operational history, making its risk profile more uncertain but with slightly lower financial risk. Both companies have weak profitability and financial health metrics, warranting cautious investment consideration.
Which Stock to Choose?
Energy Fuels Inc. (UUUU) showed strong revenue growth of 105.95% in 2024 but suffered from negative net margin (-61.15%) and returns (ROE -9.05%, ROIC -6.67%). Its debt levels are low and quick ratio favorable, yet overall ratios are mostly unfavorable. The company’s rating is D+ with very unfavorable financial scores.
IsoEnergy Ltd. (ISOU) had stagnant income growth with net margin at 0% and negative returns (ROE -13.9%, ROIC -12.5%). It maintains moderate debt levels and favorable liquidity ratios, but asset turnover is nil. Its rating is C- with a slightly unfavorable ratio profile and very weak financial scores.
For risk-averse investors prioritizing financial stability and liquidity, IsoEnergy might appear more suitable given its moderate debt and slightly better ratio balance. Conversely, growth-oriented investors could see Energy Fuels’ substantial revenue expansion and improving ROIC trend as more aligned with their strategy despite profitability challenges.
Disclaimer: Investment carries a risk of loss of initial capital. The past performance is not a reliable indicator of future results. Be sure to understand risks before making an investment decision.
Go Further
I encourage you to read the complete analyses of Energy Fuels Inc. and IsoEnergy Ltd. to enhance your investment decisions: