Energy Fuels Inc. (UUUU) and enCore Energy Corp. (EU) are two prominent players in the uranium industry, both focused on uranium extraction and development within the United States. Their overlapping market presence and commitment to advancing uranium resources position them as direct competitors in a vital energy sector. This article will analyze their strengths and risks to help you decide which company holds the most promise for your investment portfolio.
Table of contents
Companies Overview
I will begin the comparison between Energy Fuels Inc. and enCore Energy Corp. by providing an overview of these two companies and their main differences.
Energy Fuels Inc. Overview
Energy Fuels Inc. operates in the uranium industry, focusing on extraction, recovery, exploration, and sales within the United States. The company manages several projects including Nichols Ranch, Jane Dough, Hank, and Alta Mesa, and owns the White Mesa Mill. Headquartered in Lakewood, Colorado, Energy Fuels maintains a strong presence in uranium mining and processing with a market cap of approximately 4.3B USD.
enCore Energy Corp. Overview
enCore Energy Corp. is engaged in acquiring, exploring, and developing uranium resource properties across the U.S., with significant holdings in New Mexico, Utah, South Dakota, and Wyoming. The company owns large tracts of land in key uranium belts and districts. Headquartered in Corpus Christi, Texas, enCore’s market capitalization stands near 519M USD, emphasizing resource development in the uranium sector.
Key similarities and differences
Both companies operate strictly within the uranium industry in the United States, focusing on resource extraction and development. Energy Fuels has a larger market cap and operates multiple projects with processing capabilities, while enCore is more focused on acquiring and developing extensive uranium property portfolios. Each company targets strategic locations in uranium-rich regions but varies in scale and operational scope.
Income Statement Comparison
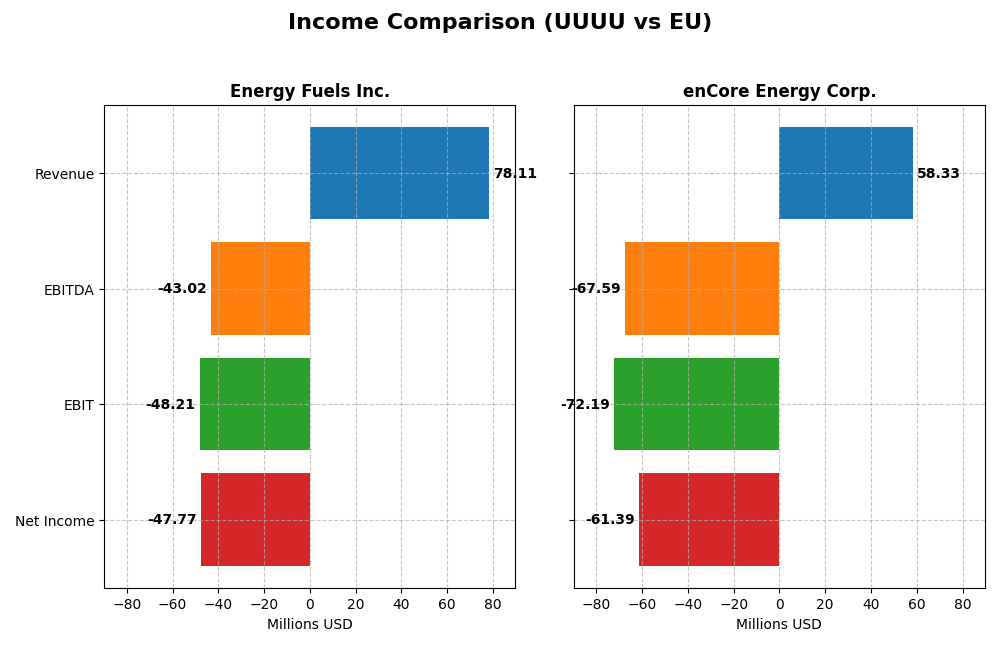
The table below presents a side-by-side comparison of key income statement metrics for Energy Fuels Inc. and enCore Energy Corp. based on their most recent fiscal year data.
| Metric | Energy Fuels Inc. (UUUU) | enCore Energy Corp. (EU) |
|---|---|---|
| Market Cap | 4.31B | 519M |
| Revenue | 78.1M | 58.3M |
| EBITDA | -43.0M | -67.6M |
| EBIT | -48.2M | -72.2M |
| Net Income | -47.8M | -61.4M |
| EPS | -0.28 | -0.34 |
| Fiscal Year | 2024 | 2024 |
Income Statement Interpretations
Energy Fuels Inc.
Energy Fuels Inc. saw a substantial revenue increase from $3.2M in 2020 to $78.1M in 2024, but net income remained negative in recent years, with a loss of $47.8M in 2024. Gross margins improved slightly to 21.8%, while EBIT and net margins remained unfavorable at roughly -62%. The latest year showed strong revenue growth but declining profitability and margins.
enCore Energy Corp.
enCore Energy Corp. experienced revenue growth from zero in 2020 to $58.3M in 2024, but reported net losses each year, including a $61.4M loss in 2024. Gross margins deteriorated to -12.4%, and EBIT and net margins also remained deeply negative. Despite favorable revenue growth, operating and net losses widened significantly in the latest year.
Which one has the stronger fundamentals?
Energy Fuels Inc. exhibits stronger fundamentals with positive gross margins and zero interest expense, alongside significant revenue growth. However, its EBIT and net margins remain negative. enCore Energy shows consistent losses with negative margins across the board and weaker overall income statement metrics. Therefore, Energy Fuels appears to have relatively more favorable income statement fundamentals.
Financial Ratios Comparison
The table below presents a snapshot of key financial ratios for Energy Fuels Inc. and enCore Energy Corp. based on their most recent fiscal year 2024 data.
| Ratios | Energy Fuels Inc. (UUUU) | enCore Energy Corp. (EU) |
|---|---|---|
| ROE | -9.05% | -21.49% |
| ROIC | -6.67% | -17.34% |
| P/E | -18.47 | -10.11 |
| P/B | 1.67 | 2.17 |
| Current Ratio | 3.88 | 2.91 |
| Quick Ratio | 2.76 | 2.21 |
| D/E (Debt-to-Equity) | 0.0041 | 0.072 |
| Debt-to-Assets | 0.004 | 0.052 |
| Interest Coverage | 0 | -41.60 |
| Asset Turnover | 0.13 | 0.15 |
| Fixed Asset Turnover | 1.42 | 0.20 |
| Payout ratio | 0 | 0 |
| Dividend yield | 0 | 0 |
Interpretation of the Ratios
Energy Fuels Inc.
Energy Fuels Inc. shows a mixed ratio profile with more unfavorable indicators, including negative net margin (-61.15%) and return on equity (-9.05%), suggesting profitability challenges. The current ratio of 3.88 is considered unfavorable, but the quick ratio of 2.76 and zero debt-to-equity ratio are positive signs. The company does not pay dividends, likely prioritizing reinvestment or growth strategies.
enCore Energy Corp.
enCore Energy Corp. also faces significant financial pressures with an unfavorable net margin of -105.24% and return on equity of -21.49%, reflecting operational losses. It has a better current ratio of 2.91 and quick ratio of 2.21, both favorable, and modest leverage with a 0.07 debt-to-equity ratio. Like Energy Fuels, enCore does not distribute dividends, possibly focusing on exploration and development.
Which one has the best ratios?
Both companies present predominantly unfavorable financial ratios, with profitability and coverage concerns. enCore Energy Corp. shows slightly better liquidity ratios and marginally higher favorable ratio percentages (35.71% vs. 28.57%). However, both face similar challenges with negative returns and no dividend payouts, resulting in an overall unfavorable ratio assessment for each.
Strategic Positioning
This section compares the strategic positioning of Energy Fuels Inc. and enCore Energy Corp. in terms of market position, key segments, and exposure to technological disruption:
Energy Fuels Inc.
- Leading uranium producer in the US with significant market cap; faces competitive pressure from industry peers.
- Engages in uranium extraction, recovery, and exploration across multiple US states; operates key projects and a mill facility.
- Limited explicit information on technological disruption exposure; operates conventional and in situ recovery methods.
enCore Energy Corp.
- Smaller market cap focused on uranium acquisition and development in US regions; competes within niche segments.
- Focused on acquisition, exploration, and development of uranium properties primarily in New Mexico and surrounding areas.
- No direct data on technological disruption; emphasis on resource acquisition and project development within established methods.
Energy Fuels Inc. vs enCore Energy Corp. Positioning
Energy Fuels Inc. has a diversified portfolio across multiple states and multiple uranium projects including milling, giving scale advantages. enCore is more concentrated geographically and focused on property acquisition and development. Energy Fuels’ broader operations may provide operational flexibility, while enCore’s focused approach could limit scale but concentrate resources on fewer assets.
Which has the best competitive advantage?
Both companies are currently shedding value with negative ROIC compared to WACC. Energy Fuels shows a growing ROIC trend, indicating improving profitability, unlike enCore, which faces a declining ROIC trend and very unfavorable moat status.
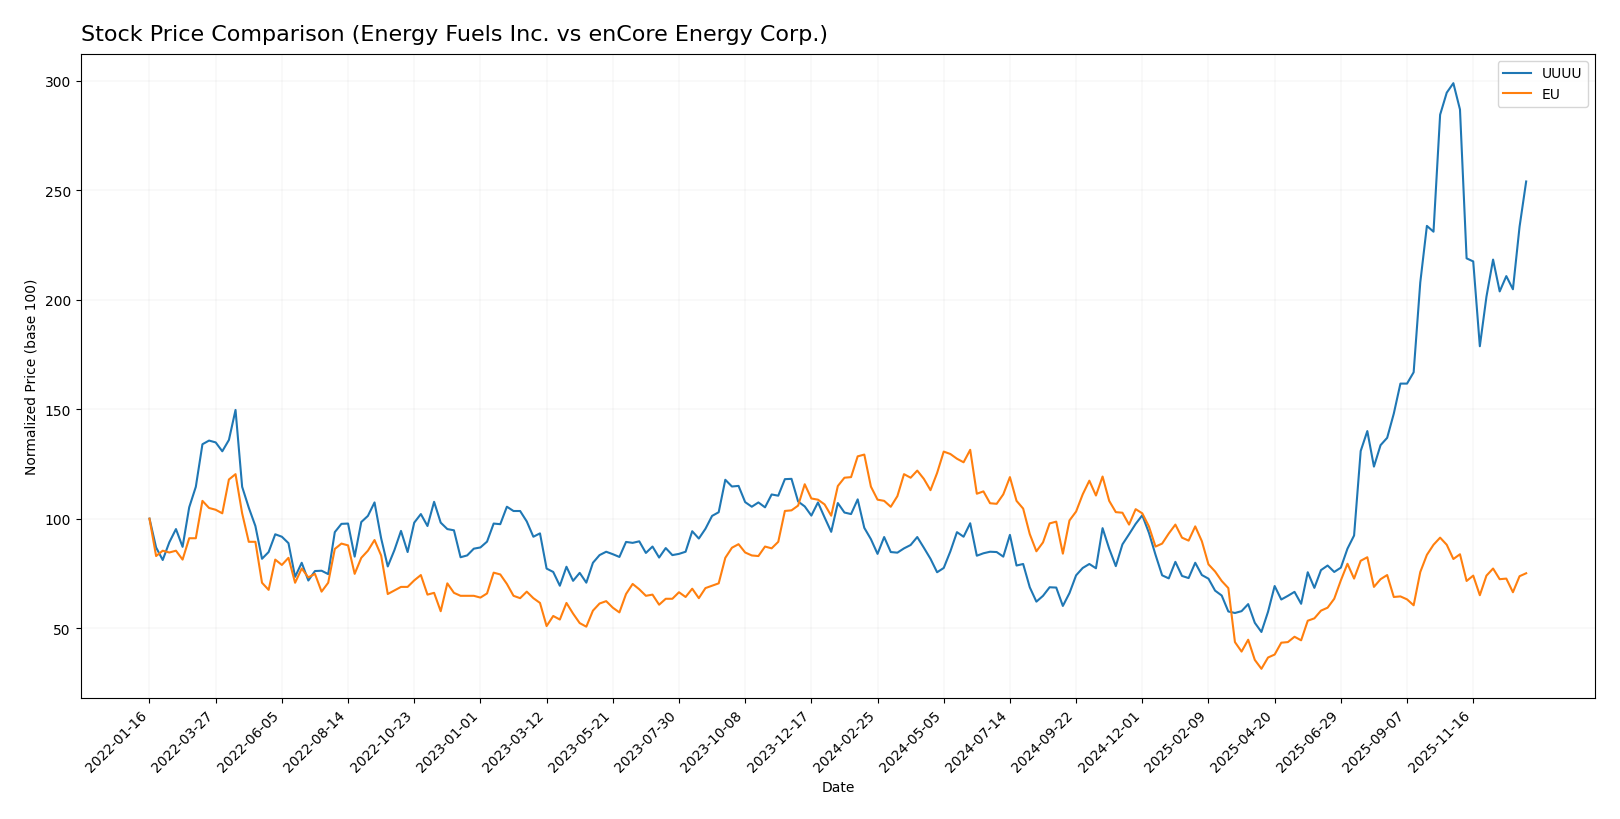
Stock Comparison
The past year showed divergent price movements for Energy Fuels Inc. and enCore Energy Corp., with Energy Fuels registering strong gains despite recent pullbacks, while enCore declined steadily under decelerating bearish momentum.
Trend Analysis
Energy Fuels Inc. experienced a 180.25% price increase over the past 12 months, indicating a bullish trend with deceleration. Its price ranged from a low of 3.45 to a high of 21.37, with recent months showing a 15.02% decline.
enCore Energy Corp. showed a 34.52% price decrease over the same period, consistent with a bearish trend and deceleration. Its stock traded between 1.16 and 4.85, with a recent 7.97% drop indicating persistent negative momentum.
Comparing both, Energy Fuels Inc. delivered the highest market performance with a strong bullish trend, outperforming the bearish trend observed in enCore Energy Corp.
Target Prices
Analysts provide a clear target price consensus for both Energy Fuels Inc. and enCore Energy Corp.
| Company | Target High | Target Low | Consensus |
|---|---|---|---|
| Energy Fuels Inc. | 26.75 | 11.5 | 19.13 |
| enCore Energy Corp. | 3.5 | 3.5 | 3.5 |
The target consensus for Energy Fuels Inc. suggests upside potential compared to its current price of 18.16 USD, indicating moderate growth expectations. enCore Energy Corp.’s consensus target at 3.5 USD also points to a possible increase from its present price of 2.77 USD, reflecting cautious optimism among analysts.
Analyst Opinions Comparison
This section compares analysts’ ratings and grades for Energy Fuels Inc. and enCore Energy Corp.:
Rating Comparison
Energy Fuels Inc. Rating
- Rating: D+, considered very favorable by analysts.
- Discounted Cash Flow Score: 1, marked very unfavorable.
- ROE Score: 1, classified as very unfavorable.
- ROA Score: 1, very unfavorable rating.
- Debt To Equity Score: 1, very unfavorable grade.
- Overall Score: 1, very unfavorable overall rating.
enCore Energy Corp. Rating
- Rating: C-, also rated very favorable by analysts.
- Discounted Cash Flow Score: 1, also very unfavorable.
- ROE Score: 1, equally very unfavorable.
- ROA Score: 1, also very unfavorable.
- Debt To Equity Score: 2, rated moderate.
- Overall Score: 1, very unfavorable overall rating.
Which one is the best rated?
Based strictly on the provided data, enCore Energy Corp. holds a slightly better Debt To Equity and Price-to-Book score, but both companies have the same overall and most other scores, reflecting similar analyst sentiment.
Scores Comparison
Here is a comparison of the Altman Z-Score and Piotroski Score for Energy Fuels Inc. and enCore Energy Corp.:
Energy Fuels Inc. Scores
- Altman Z-Score: 40.34, indicating a strong safe zone.
- Piotroski Score: 1, indicating very weak financial health.
enCore Energy Corp. Scores
- Altman Z-Score: 1.17, indicating distress zone risk.
- Piotroski Score: 4, indicating average financial health.
Which company has the best scores?
Energy Fuels Inc. shows a substantially higher Altman Z-Score, placing it in the safe zone, while enCore Energy is in distress. However, enCore’s Piotroski Score is better, reflecting stronger financial fundamentals than Energy Fuels Inc.
Grades Comparison
Here is the comparison of recent reliable grades from recognized grading companies for the two companies:
Energy Fuels Inc. Grades
The table below summarizes the recent grades assigned by recognized firms for Energy Fuels Inc.:
| Grading Company | Action | New Grade | Date |
|---|---|---|---|
| HC Wainwright & Co. | Maintain | Buy | 2026-01-09 |
| Roth Capital | Downgrade | Sell | 2025-11-05 |
| HC Wainwright & Co. | Maintain | Buy | 2025-11-04 |
| HC Wainwright & Co. | Maintain | Buy | 2025-10-21 |
| B. Riley Securities | Maintain | Buy | 2025-10-08 |
| HC Wainwright & Co. | Maintain | Buy | 2025-09-17 |
| HC Wainwright & Co. | Maintain | Buy | 2025-08-08 |
| Canaccord Genuity | Maintain | Buy | 2025-07-02 |
| HC Wainwright & Co. | Maintain | Buy | 2025-05-09 |
| HC Wainwright & Co. | Maintain | Buy | 2025-02-28 |
Energy Fuels Inc. shows mostly consistent Buy ratings with a single Sell downgrade by Roth Capital in late 2025.
enCore Energy Corp. Grades
The table below summarizes the recent grades assigned by recognized firms for enCore Energy Corp.:
| Grading Company | Action | New Grade | Date |
|---|---|---|---|
| HC Wainwright & Co. | Maintain | Buy | 2025-08-12 |
| HC Wainwright & Co. | Maintain | Buy | 2025-05-13 |
| HC Wainwright & Co. | Maintain | Buy | 2025-03-18 |
| HC Wainwright & Co. | Maintain | Buy | 2024-11-19 |
| HC Wainwright & Co. | Maintain | Buy | 2024-10-07 |
| HC Wainwright & Co. | Maintain | Buy | 2024-08-15 |
| HC Wainwright & Co. | Maintain | Buy | 2024-06-14 |
| B. Riley Securities | Maintain | Buy | 2024-05-15 |
enCore Energy Corp. has consistently maintained Buy ratings from HC Wainwright & Co. and B. Riley Securities over the past two years.
Which company has the best grades?
Both Energy Fuels Inc. and enCore Energy Corp. have predominantly Buy ratings from reputable grading companies. However, Energy Fuels Inc. shows one Sell rating amid many Buys, while enCore Energy Corp.’s ratings are uniformly positive. This consistency in grades may suggest steadier analyst confidence in enCore Energy Corp., potentially impacting investor perception of risk and growth prospects.
Strengths and Weaknesses
Below is a comparative overview of the key strengths and weaknesses of Energy Fuels Inc. (UUUU) and enCore Energy Corp. (EU), based on their recent financial and operational data.
| Criterion | Energy Fuels Inc. (UUUU) | enCore Energy Corp. (EU) |
|---|---|---|
| Diversification | Limited product segmentation, focus on uranium and related energy resources | Limited product segmentation, focused on uranium energy solutions |
| Profitability | Negative net margin (-61.15%), ROIC -6.67%, shedding value but with improving ROIC trend | More severe negative net margin (-105.24%), ROIC -17.34%, declining profitability |
| Innovation | Moderate asset turnover (0.13), neutral fixed asset turnover (1.42) | Low asset turnover (0.15), unfavorable fixed asset turnover (0.2), signaling weaker operational efficiency |
| Global presence | Not prominently diversified geographically | Similar limited global footprint |
| Market Share | Not clearly dominant; financial metrics suggest challenges in scaling value | Also no clear market dominance; financials indicate struggle to create shareholder value |
In summary, both companies face significant profitability challenges and limited diversification, with Energy Fuels showing a slightly more optimistic trend in ROIC growth. Investors should exercise caution and monitor improvements in operational efficiency and profitability before considering an investment.
Risk Analysis
Below is a comparison of key risks for Energy Fuels Inc. (UUUU) and enCore Energy Corp. (EU) based on the latest 2024 data and market conditions.
| Metric | Energy Fuels Inc. (UUUU) | enCore Energy Corp. (EU) |
|---|---|---|
| Market Risk | High beta (1.85) indicates strong sensitivity to market fluctuations. | Moderately high beta (1.44) reflects notable market volatility exposure. |
| Debt level | Very low debt (D/E = 0.0), strong balance sheet. | Low debt (D/E = 0.07), manageable but higher than UUUU. |
| Regulatory Risk | Significant, given uranium industry’s strict US mining and environmental regulations. | Similar regulatory exposure in US uranium sector, with permitting challenges. |
| Operational Risk | High due to exploration and production complexities; low asset turnover (0.13) suggests inefficiencies. | High operational risk; very low fixed asset turnover (0.2) signals underutilized assets. |
| Environmental Risk | Moderate to high, as uranium mining faces environmental scrutiny and potential compliance costs. | Similar environmental risks tied to uranium extraction and land use in New Mexico and Wyoming. |
| Geopolitical Risk | Moderate, with US-focused operations but sensitive to global uranium market shifts and trade policies. | Moderate, US-centric but vulnerable to global uranium supply-demand dynamics and trade tensions. |
Energy Fuels Inc. shows very low financial leverage but suffers from operational inefficiencies and negative profitability margins, making market and regulatory risks most impactful. enCore Energy faces financial distress signals with a distressed Altman Z-score and average Piotroski score, indicating higher bankruptcy risk and operational challenges. Both companies are exposed to stringent environmental and regulatory frameworks typical of the uranium sector, which remain the most likely and impactful risks.
Which Stock to Choose?
Energy Fuels Inc. (UUUU) shows strong revenue growth of 4611% over 2020-2024 but posts negative profitability metrics including a -61.15% net margin and -9.05% ROE. Its debt levels are low with a favorable debt-to-assets ratio of 0.36%, yet the overall financial ratios evaluation is unfavorable. The company has a slightly unfavorable moat rating, reflecting value destruction despite improving profitability. Its rating is D+ with a very unfavorable overall score.
enCore Energy Corp. (EU) also experiences positive revenue growth in the last year but suffers from persistent negative profitability, including a -105.24% net margin and -21.49% ROE. Its debt is modest with a favorable debt-to-equity ratio of 0.07 and a current ratio of 2.91. However, its global income statement and financial ratios evaluations remain unfavorable, and it holds a very unfavorable moat rating due to declining profitability. The company’s rating is C- with a very unfavorable overall score.
Investors seeking potential growth might view Energy Fuels’ improving profitability and growing ROIC as positive signs, despite its unfavorable ratings and financial challenges. Conversely, more risk-averse investors or those focused on financial stability might perceive enCore Energy’s modest debt and valuation metrics as relatively preferable, although its declining profitability and distress signals warrant caution. Ultimately, the choice could depend on the investor’s tolerance for risk and preference for improving versus deteriorating financial trends.
Disclaimer: Investment carries a risk of loss of initial capital. The past performance is not a reliable indicator of future results. Be sure to understand risks before making an investment decision.
Go Further
I encourage you to read the complete analyses of Energy Fuels Inc. and enCore Energy Corp. to enhance your investment decisions: