The uranium sector is gaining renewed interest as the world shifts toward cleaner energy sources, spotlighting companies like Uranium Royalty Corp. (UROY) and enCore Energy Corp. (EU). Both operate within uranium mining and resource development but differ in geographic focus and asset strategies. This comparison will explore their market positioning and innovation approaches to help you identify which stock could be the better addition to your investment portfolio. Let’s uncover which company stands out for investors today.
Table of contents
Companies Overview
I will begin the comparison between Uranium Royalty Corp. and enCore Energy Corp. by providing an overview of these two companies and their main differences.
Uranium Royalty Corp. Overview
Uranium Royalty Corp. operates as a pure-play uranium royalty company focused on acquiring and managing a portfolio of geographically diversified uranium interests. Headquartered in Vancouver, Canada, it holds royalty stakes across various uranium projects in North America and Namibia. The company positions itself as a royalty-focused player in the uranium energy sector, aiming to leverage its broad asset base for income generation.
enCore Energy Corp. Overview
enCore Energy Corp. engages in the acquisition, exploration, and development of uranium resource properties primarily in the United States. Based in Corpus Christi, Texas, it holds a 100% interest in several uranium projects across New Mexico, Wyoming, South Dakota, and Utah. enCore focuses on direct uranium resource development with extensive land holdings and mining claims, targeting growth through project advancement and resource expansion.
Key similarities and differences
Both companies operate within the uranium energy sector and trade on NASDAQ, yet their business models differ significantly. Uranium Royalty Corp. is a royalty company that generates revenue through royalties on uranium production without operating mines. In contrast, enCore Energy is an exploration and development company actively managing uranium properties with full ownership interests. This distinction reflects a difference in operational risk and capital intensity between a royalty model and a resource development model.
Income Statement Comparison
The following table compares key income statement metrics for Uranium Royalty Corp. and enCore Energy Corp. based on their most recent fiscal year reported.
| Metric | Uranium Royalty Corp. (UROY) | enCore Energy Corp. (EU) |
|---|---|---|
| Market Cap | 535M CAD | 519M USD |
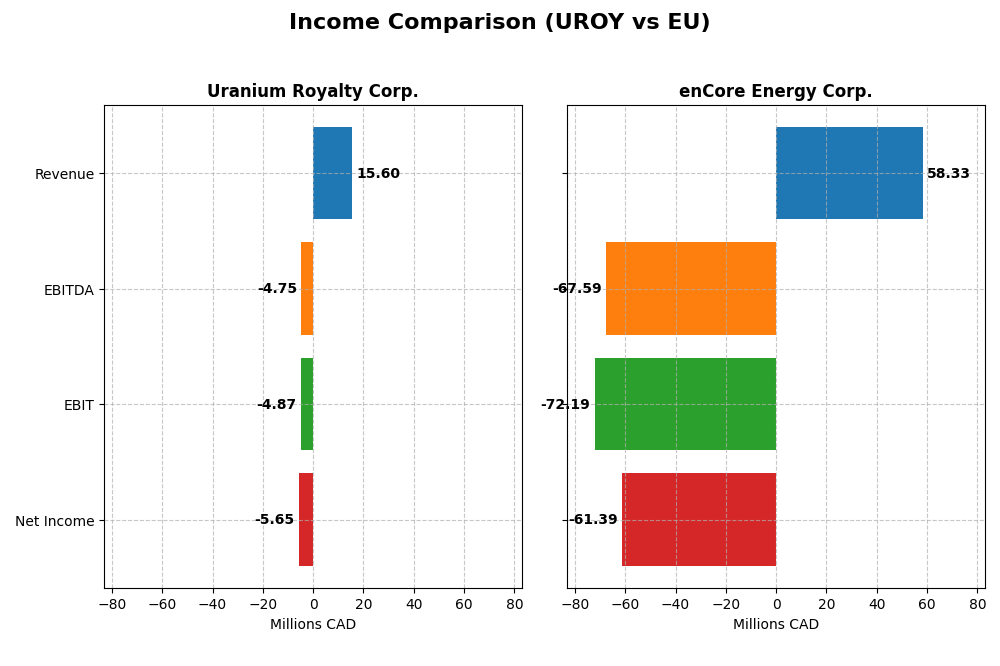
| Revenue | 15.6M CAD | 58.3M USD |
| EBITDA | -4.75M CAD | -67.6M USD |
| EBIT | -4.87M CAD | -72.2M USD |
| Net Income | -5.65M CAD | -61.4M USD |
| EPS | -0.0446 CAD | -0.34 USD |
| Fiscal Year | 2025 | 2024 |
Income Statement Interpretations
Uranium Royalty Corp.
Uranium Royalty Corp. shows volatile revenue and net income from 2021 to 2025, with a peak revenue of 42.7M CAD in 2024 followed by a sharp decline to 15.6M CAD in 2025. Margins have generally weakened, with a gross margin near 10% but an unfavorable net margin of -36.3% in 2025. The latest fiscal year reflects substantial revenue contraction and deteriorating profitability.
enCore Energy Corp.
enCore Energy Corp. experienced significant revenue growth of 163.4% in 2024 reaching 58.3M USD, yet profitability remains negative with a net margin of -105.2%. Gross margins are consistently unfavorable, and EBIT margins have worsened to -123.7%. Despite revenue gains, operating expenses and net losses expanded sharply in the most recent year, indicating ongoing financial challenges.
Which one has the stronger fundamentals?
Both companies exhibit unfavorable overall income statement evaluations with persistent net losses and negative margins. Uranium Royalty Corp. maintains a slightly better gross margin and favorable interest expense ratio, though its revenue and net income declined sharply in 2025. enCore Energy shows strong revenue growth but suffers from much larger operating losses and negative margins. Neither company currently demonstrates strong fundamental income statement metrics.
Financial Ratios Comparison
The table below presents the most recent key financial ratios for Uranium Royalty Corp. (UROY) and enCore Energy Corp. (EU) based on their 2025 and 2024 fiscal year results respectively.
| Ratios | Uranium Royalty Corp. (2025) | enCore Energy Corp. (2024) |
|---|---|---|
| ROE | -1.92% | -21.49% |
| ROIC | -1.63% | -17.34% |
| P/E | -56.0 | -10.11 |
| P/B | 1.07 | 2.17 |
| Current Ratio | 233.5 | 2.91 |
| Quick Ratio | 233.5 | 2.21 |
| D/E (Debt to Equity) | 0.07% | 7.15% |
| Debt-to-Assets | 0.07% | 5.20% |
| Interest Coverage | -11.0 | -41.6 |
| Asset Turnover | 0.05 | 0.15 |
| Fixed Asset Turnover | 82.5 | 0.20 |
| Payout Ratio | 0 | 0 |
| Dividend Yield | 0% | 0% |
Interpretation of the Ratios
Uranium Royalty Corp.
Uranium Royalty Corp. shows a mixed ratio profile with 42.86% favorable and 57.14% unfavorable ratios, reflecting some financial challenges. Key concerns include negative net margin (-36.26%), low return on equity (-1.92%), poor interest coverage (-11.17), and an extremely high current ratio (233.49), which may indicate inefficiency. The company does not pay dividends, likely due to ongoing reinvestment and operational losses.
enCore Energy Corp.
enCore Energy Corp. also presents an unfavorable ratio profile with 35.71% favorable and 57.14% unfavorable ratios. It reports a very negative net margin (-105.24%) and return on equity (-21.49%), alongside weak asset turnover (0.15) and interest coverage (-41.61). The current and quick ratios are adequate at 2.91 and 2.21 respectively. The absence of dividends suggests a focus on growth and resource development instead of shareholder payouts.
Which one has the best ratios?
Both companies exhibit predominantly unfavorable financial ratios with significant profitability and efficiency issues. Uranium Royalty Corp. has a slightly higher proportion of favorable ratios and a better debt profile, but also extreme liquidity ratios. enCore Energy Corp.’s ratios reveal deeper operational losses and weaker asset utilization. Neither company demonstrates strong financial health based on these metrics.
Strategic Positioning
This section compares the strategic positioning of Uranium Royalty Corp. and enCore Energy Corp., focusing on Market position, Key segments, and Exposure to technological disruption:
Uranium Royalty Corp.
- Pure-play uranium royalty company with geographically diversified uranium interests.
- Key business drivers are royalties from multiple uranium projects across Canada, U.S., Namibia.
- Limited exposure to technological disruption, operates mainly through royalty interests, less operational risk.
enCore Energy Corp.
- Uranium acquisition, exploration, and development focused in the U.S. Grants Uranium Belt and other states.
- Key segments include uranium projects wholly owned across New Mexico, South Dakota, Wyoming, and Utah.
- Exploration and development stages expose the company to operational and technological risks in uranium mining.
Uranium Royalty Corp. vs enCore Energy Corp. Positioning
Uranium Royalty Corp. adopts a diversified royalty model across several countries, reducing operational complexity. enCore Energy focuses on concentrated uranium project ownership primarily in the U.S., which may increase operational exposure but offers direct resource control.
Which has the best competitive advantage?
Both companies currently show very unfavorable MOAT evaluations with declining ROIC and value destruction. Neither demonstrates a clear competitive advantage based on efficient capital use or profitability trends.
Stock Comparison
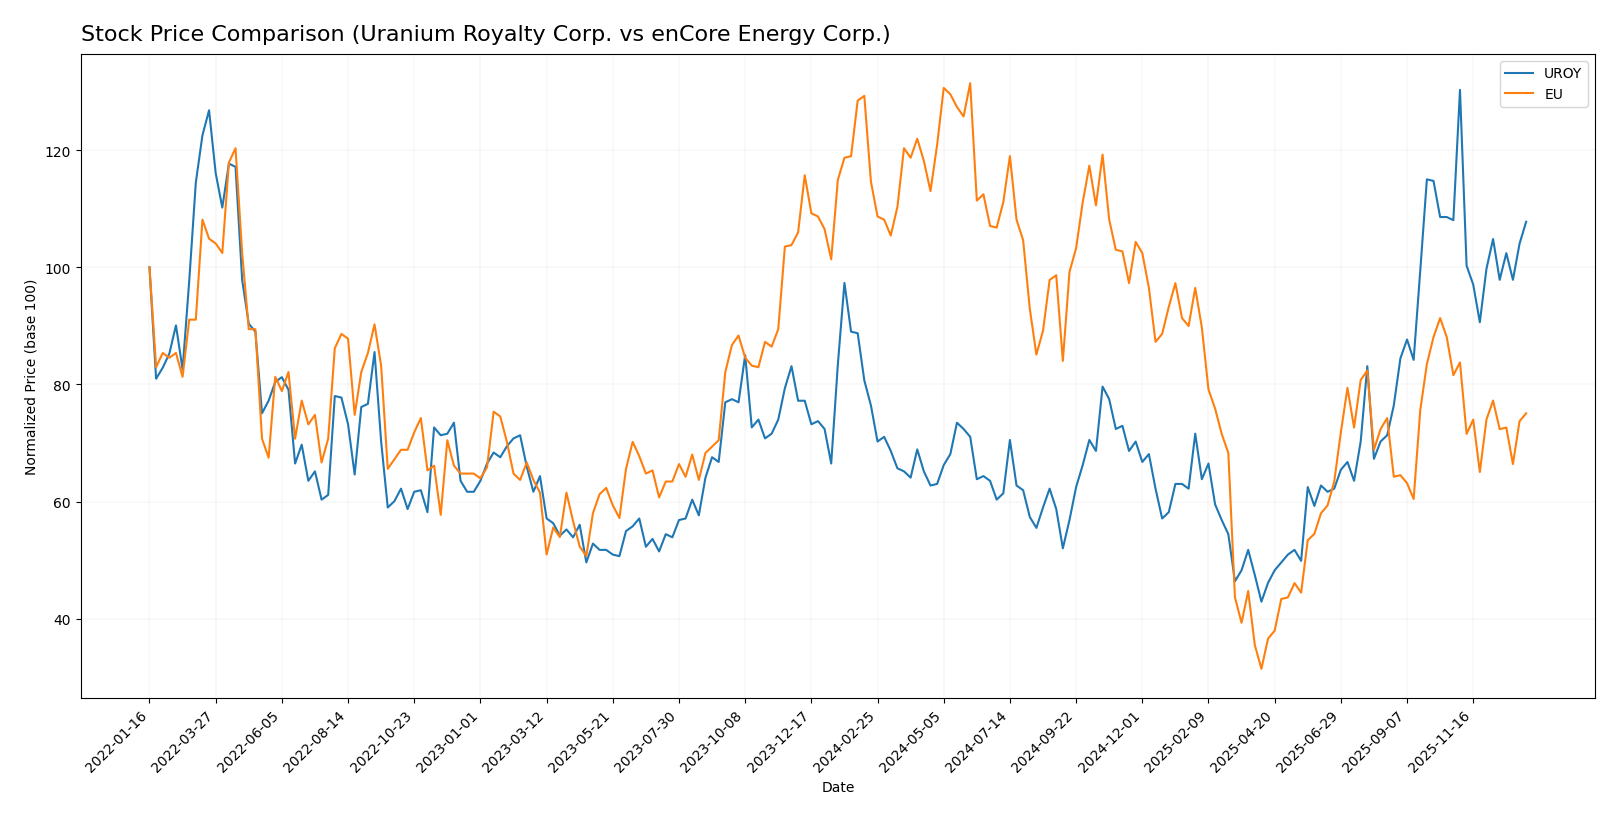
The stock price movements of Uranium Royalty Corp. and enCore Energy Corp. over the past 12 months reveal contrasting trajectories, with Uranium Royalty Corp. showing strong gains while enCore Energy Corp. experienced significant declines.
Trend Analysis
Uranium Royalty Corp. (UROY) exhibited a bullish trend over the past year with a 41.05% price increase and decelerating momentum, reaching a high of 4.86 and a low of 1.6. Recent months show a neutral short-term trend with minor price decline.
enCore Energy Corp. (EU) experienced a bearish trend with a 34.52% price decline over the year and decelerating losses, hitting a high of 4.85 and a low of 1.16. The recent period shows continued negative movement, with a 7.97% drop.
Comparing both, Uranium Royalty Corp. delivered the highest market performance with a strong positive price change, while enCore Energy Corp. faced notable negative returns over the same period.
Target Prices
The target price consensus for enCore Energy Corp. suggests a stable outlook from analysts.
| Company | Target High | Target Low | Consensus |
|---|---|---|---|
| enCore Energy Corp. | 3.5 | 3.5 | 3.5 |
Analysts expect enCore Energy Corp.’s stock to reach $3.5, indicating potential upside from the current price of $2.77. No verified target price data is available for Uranium Royalty Corp.
Analyst Opinions Comparison
This section compares analysts’ ratings and grades for Uranium Royalty Corp. (UROY) and enCore Energy Corp. (EU):
Rating Comparison
UROY Rating
- Rating: C- with a “Very Favorable” status
- Discounted Cash Flow Score: 1, rated “Very Unfavorable”
- ROE Score: 1, rated “Very Unfavorable”
- ROA Score: 1, rated “Very Unfavorable”
- Debt To Equity Score: 4, rated “Favorable”
- Overall Score: 1, rated “Very Unfavorable”
EU Rating
- Rating: C- with a “Very Favorable” status
- Discounted Cash Flow Score: 1, rated “Very Unfavorable”
- ROE Score: 1, rated “Very Unfavorable”
- ROA Score: 1, rated “Very Unfavorable”
- Debt To Equity Score: 2, rated “Moderate”
- Overall Score: 1, rated “Very Unfavorable”
Which one is the best rated?
Both UROY and EU share the same overall rating “C-” and very unfavorable overall scores. UROY holds a better debt-to-equity score rated “Favorable” compared to EU’s “Moderate,” making its financial risk profile appear stronger in this aspect.
Scores Comparison
Here is a comparison of the Altman Z-Score and Piotroski Score for Uranium Royalty Corp. and enCore Energy Corp.:
UROY Scores
- Altman Z-Score: 388.37, indicating a safe zone.
- Piotroski Score: 3, classified as very weak.
EU Scores
- Altman Z-Score: 1.17, indicating the distress zone.
- Piotroski Score: 4, classified as average.
Which company has the best scores?
Based strictly on the provided data, UROY shows a much stronger Altman Z-Score, placing it in the safe zone, while EU is in distress. However, EU’s Piotroski Score is slightly better than UROY’s, indicating a marginally stronger financial health.
Grades Comparison
The following presents the recent grades issued by recognized grading companies for Uranium Royalty Corp. and enCore Energy Corp.:
Uranium Royalty Corp. Grades
This table displays the latest grades and recommendations from HC Wainwright & Co. for Uranium Royalty Corp.:
| Grading Company | Action | New Grade | Date |
|---|---|---|---|
| HC Wainwright & Co. | Maintain | Buy | 2025-04-22 |
| HC Wainwright & Co. | Maintain | Buy | 2024-12-19 |
| HC Wainwright & Co. | Maintain | Buy | 2024-09-17 |
| HC Wainwright & Co. | Maintain | Buy | 2024-06-17 |
| HC Wainwright & Co. | Maintain | Buy | 2024-03-11 |
| HC Wainwright & Co. | Maintain | Buy | 2022-01-03 |
| HC Wainwright & Co. | Maintain | Buy | 2021-09-29 |
| HC Wainwright & Co. | Maintain | Buy | 2021-09-28 |
| HC Wainwright & Co. | Maintain | Buy | 2021-07-02 |
| HC Wainwright & Co. | Maintain | Buy | 2021-07-01 |
The consistent “Buy” ratings from HC Wainwright & Co. indicate a stable positive outlook on Uranium Royalty Corp. over several years.
enCore Energy Corp. Grades
The table below summarizes recent grades issued by HC Wainwright & Co. and B. Riley Securities for enCore Energy Corp.:
| Grading Company | Action | New Grade | Date |
|---|---|---|---|
| HC Wainwright & Co. | Maintain | Buy | 2025-08-12 |
| HC Wainwright & Co. | Maintain | Buy | 2025-05-13 |
| HC Wainwright & Co. | Maintain | Buy | 2025-03-18 |
| HC Wainwright & Co. | Maintain | Buy | 2024-11-19 |
| HC Wainwright & Co. | Maintain | Buy | 2024-10-07 |
| HC Wainwright & Co. | Maintain | Buy | 2024-08-15 |
| HC Wainwright & Co. | Maintain | Buy | 2024-06-14 |
| B. Riley Securities | Maintain | Buy | 2024-05-15 |
Grades for enCore Energy Corp. consistently remain at “Buy” from two reputable firms, reflecting a sustained favorable evaluation.
Which company has the best grades?
Both Uranium Royalty Corp. and enCore Energy Corp. have consistently received “Buy” ratings from reputable grading companies, with enCore Energy showing a slightly broader base of grading firms. This steady positive consensus may influence investors seeking stocks with reliable analyst support.
Strengths and Weaknesses
The table below compares the key strengths and weaknesses of Uranium Royalty Corp. (UROY) and enCore Energy Corp. (EU) based on the latest financial and strategic data.
| Criterion | Uranium Royalty Corp. (UROY) | enCore Energy Corp. (EU) |
|---|---|---|
| Diversification | Limited product segmentation; focus on uranium royalties | Limited product diversification; focused on uranium energy |
| Profitability | Negative net margin (-36.26%), negative ROIC (-1.63%), shedding value | Highly negative net margin (-105.24%), negative ROIC (-17.34%), shedding value |
| Innovation | No significant innovation reported | No significant innovation reported |
| Global presence | Moderate, with some global asset exposure | Limited global presence, mainly North America |
| Market Share | Small share in uranium royalty market | Small share in uranium energy market |
In summary, both companies face significant profitability challenges and are currently value destroyers with declining ROIC trends. Their limited diversification and lack of clear innovation highlight the need for cautious risk management before considering investment.
Risk Analysis
Below is a comparative risk assessment table for Uranium Royalty Corp. (UROY) and enCore Energy Corp. (EU) based on the most recent data available:
| Metric | Uranium Royalty Corp. (UROY) | enCore Energy Corp. (EU) |
|---|---|---|
| Market Risk | High beta 2.03; volatile uranium sector | Moderate beta 1.44; US-focused uranium projects |
| Debt level | Very low debt; debt-to-assets 0.07% | Low debt; debt-to-assets 5.2% |
| Regulatory Risk | Exposure to multiple jurisdictions including Canada, US, Namibia | Primarily US regulatory environment |
| Operational Risk | Royalty model limits direct operational risk | Direct mining operations with exploration risk |
| Environmental Risk | Moderate, given uranium focus but diversified royalties | Higher, due to active development and mining |
| Geopolitical Risk | Moderate, with international projects in Namibia and Canada | Lower, focused in US uranium regions |
Synthesis: Both companies face significant market risk from uranium price volatility. UROY’s low debt and royalty model reduce operational and financial risk but expose it to geopolitical risks due to global asset distribution. EU carries higher operational and environmental risks from active mining in US jurisdictions but benefits from a more stable regulatory environment. EU’s distress-level Altman Z-Score signals higher bankruptcy risk compared to UROY’s safe-zone score. Investors should weigh these factors carefully in portfolio construction.
Which Stock to Choose?
Uranium Royalty Corp. (UROY) has experienced a sharp decline in revenue growth (-63.48% in one year) and exhibits unfavorable profitability with a -36.26% net margin. Its financial ratios show mixed signals, with 42.86% favorable but overall unfavorable metrics, including negative returns on equity and assets. The company carries very low debt and a very high current ratio, but the rating is very unfavorable despite a strong quick ratio and low debt-to-assets.
enCore Energy Corp. (EU) shows a 163.38% revenue growth in the last year but suffers from significant losses, with a -105.24% net margin and unfavorable profitability ratios. Financial ratios are similarly mixed, with 35.71% favorable and 7.14% neutral, but the global evaluation remains unfavorable. EU carries modest debt levels, a solid current ratio, yet its rating is very unfavorable, compounded by distress signals in its Altman Z-score.
Considering ratings and income evaluations, neither company currently shows a favorable overall financial health or profitability. UROY’s lower debt and stronger quick ratio might appeal to more risk-averse investors seeking stability, while EU’s recent revenue growth could attract those with a higher risk tolerance and focus on potential growth despite losses. Both companies display very unfavorable moat conditions, suggesting caution.
Disclaimer: Investment carries a risk of loss of initial capital. The past performance is not a reliable indicator of future results. Be sure to understand risks before making an investment decision.
Go Further
I encourage you to read the complete analyses of Uranium Royalty Corp. and enCore Energy Corp. to enhance your investment decisions: