In the evolving uranium sector, Ur-Energy Inc. and enCore Energy Corp. stand out as key players focused on U.S.-based resource development. Both companies share the same industry and target strategic uranium projects, yet differ in scale and project breadth. This comparison explores their market positioning and innovation approaches to help investors identify which uranium stock could best enrich their portfolio in 2026. Let’s uncover which company offers a more compelling investment opportunity.
Table of contents
Companies Overview
I will begin the comparison between Ur-Energy Inc. and enCore Energy Corp. by providing an overview of these two companies and their main differences.
Ur-Energy Inc. Overview
Ur-Energy Inc. operates in the uranium industry, focusing on the acquisition, exploration, development, and operation of uranium mineral properties. The company holds interests in 12 projects across the United States, with its flagship Lost Creek project covering approximately 48,000 acres in Wyoming. Founded in 2004, Ur-Energy is headquartered in Littleton, Colorado, and is positioned as a key player in domestic uranium mining.
enCore Energy Corp. Overview
enCore Energy Corp. also specializes in uranium acquisition, exploration, and development within the United States. It owns multiple uranium projects in New Mexico, Utah, South Dakota, and Wyoming, with extensive land holdings such as the 300,000-acre Checkerboard mineral rights. Formerly known as Wolfpack Gold Corp., the company changed its name in 2014 and is based in Corpus Christi, Texas.
Key similarities and differences
Both companies operate in the uranium sector and focus on resource acquisition and development in the United States. However, Ur-Energy concentrates on fewer projects with a notable flagship site, while enCore Energy manages a broader portfolio spread across multiple states with significantly larger land positions. Ur-Energy employs about 101 full-time staff, whereas enCore’s workforce size is unspecified.
Income Statement Comparison
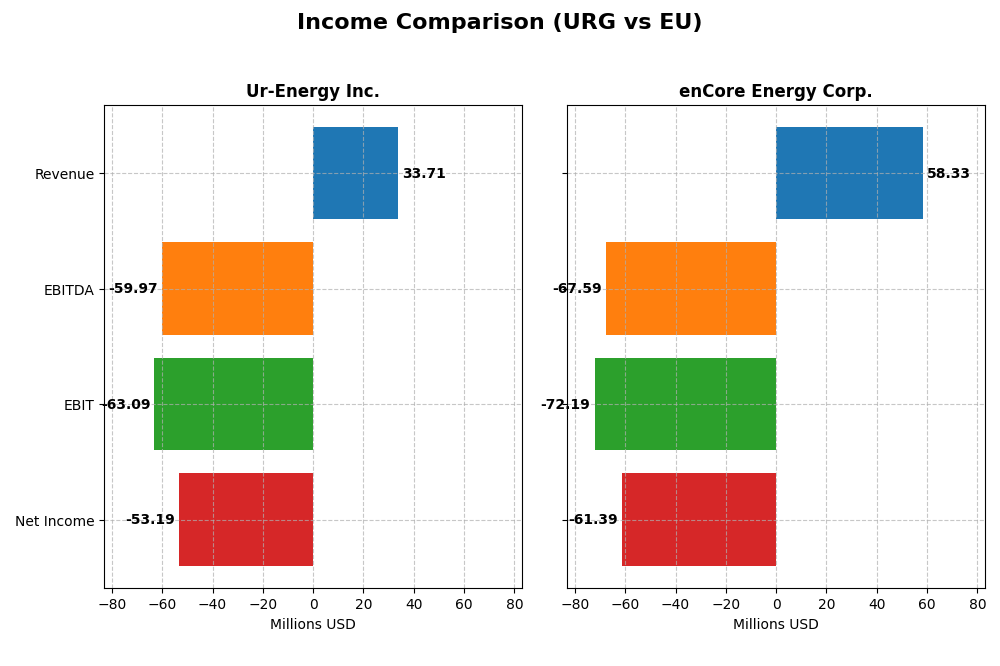
This table presents a side-by-side comparison of the latest fiscal year income statement metrics for Ur-Energy Inc. and enCore Energy Corp., highlighting key financial figures in USD.
| Metric | Ur-Energy Inc. (URG) | enCore Energy Corp. (EU) |
|---|---|---|
| Market Cap | 598M | 519M |
| Revenue | 33.7M | 58.3M |
| EBITDA | -59.97M | -67.59M |
| EBIT | -63.09M | -72.19M |
| Net Income | -53.19M | -61.39M |
| EPS | -0.17 | -0.34 |
| Fiscal Year | 2024 | 2024 |
Income Statement Interpretations
Ur-Energy Inc.
Ur-Energy’s revenue grew significantly by 90.66% in 2024 to $33.7M, continuing a robust overall growth of 305.32% since 2020. However, the company sustained large losses, with net income at -$53.2M and negative margins, including a gross margin of -26.62%. Despite worsening profitability, net margin showed slight improvement in 2024, indicating some operational adjustments.
enCore Energy Corp.
enCore’s revenue surged 163.38% in 2024 to $58.3M, though it remains unprofitable with a net loss of $61.4M and a gross margin of -12.35%. Margins remain under pressure, highlighted by an EBIT margin of -123.75%. The company experienced a sharp decline in EPS and overall net income, reflecting ongoing challenges despite notable revenue gains.
Which one has the stronger fundamentals?
Both Ur-Energy and enCore Energy show unfavorable overall income statement evaluations due to persistent losses and negative margins. Ur-Energy’s stronger revenue growth and slight net margin improvement contrast with enCore’s more severe net income decline and margin pressures. However, both firms face significant profitability risks, with neither demonstrating a clear fundamental advantage based on current financials.
Financial Ratios Comparison
The table below presents a side-by-side comparison of key financial ratios for Ur-Energy Inc. (URG) and enCore Energy Corp. (EU) based on their latest fiscal year 2024 data.
| Ratios | Ur-Energy Inc. (URG) | enCore Energy Corp. (EU) |
|---|---|---|
| ROE | -40.1% | -21.5% |
| ROIC | -36.0% | -17.3% |
| P/E | -6.87 | -10.11 |
| P/B | 2.75 | 2.17 |
| Current Ratio | 5.99 | 2.91 |
| Quick Ratio | 4.91 | 2.21 |
| D/E (Debt-to-Equity) | 0.0093 | 0.0715 |
| Debt-to-Assets | 0.0064 | 0.0520 |
| Interest Coverage | 0 | -41.60 |
| Asset Turnover | 0.17 | 0.15 |
| Fixed Asset Turnover | 0 | 0.20 |
| Payout Ratio | 0 | 0 |
| Dividend Yield | 0 | 0 |
Interpretation of the Ratios
Ur-Energy Inc.
Ur-Energy Inc. shows predominantly unfavorable financial ratios for 2024, with weak profitability indicators such as negative net margin (-157.8%) and return on equity (-40.05%). Liquidity is mixed, with a high current ratio (5.99) deemed unfavorable, but a favorable quick ratio (4.91). The company does not pay dividends, likely due to ongoing losses and reinvestment needs.
enCore Energy Corp.
enCore Energy Corp. also exhibits mostly unfavorable ratios in 2024, including a negative net margin (-105.24%) and return on invested capital (-17.34%). Liquidity ratios are better than Ur-Energy’s, with a current ratio of 2.91 and quick ratio of 2.21, both favorable. The company does not distribute dividends, probably reflecting its investment phase and negative earnings.
Which one has the best ratios?
Both companies have unfavorable overall ratio evaluations, but enCore Energy presents a higher proportion of favorable liquidity and solvency ratios compared to Ur-Energy. However, both show weak profitability and negative returns, indicating challenges in financial performance. Neither company pays dividends, reflecting their current operational and financial conditions.
Strategic Positioning
This section compares the strategic positioning of Ur-Energy Inc. and enCore Energy Corp., including their market position, key segments, and exposure to technological disruption:
Ur-Energy Inc.
- Operates in uranium sector with 12 U.S. projects, facing standard competitive pressure in mining industry.
- Focuses on uranium acquisition, exploration, and operation; flagship Lost Creek project in Wyoming.
- No explicit data on technological disruption exposure; traditional uranium mining operations.
enCore Energy Corp.
- Active uranium exploration and development across multiple U.S. projects with diverse land holdings.
- Concentrates on uranium resource properties in New Mexico, Wyoming, Utah, and South Dakota.
- No explicit data on technological disruption exposure; traditional uranium resource development.
Ur-Energy Inc. vs enCore Energy Corp. Positioning
Ur-Energy focuses on fewer projects primarily in Wyoming, presenting a more concentrated approach, while enCore manages a broader portfolio across several states. Ur-Energy’s scale is moderate; enCore’s diversified holdings may offer broader geographic exposure but complexity.
Which has the best competitive advantage?
Both companies show very unfavorable MOAT evaluations, with declining ROIC trends and value destruction, indicating neither currently sustains a competitive advantage based on efficient capital use and profitability.
Stock Comparison
The stock price movements of Ur-Energy Inc. and enCore Energy Corp. over the past year reveal contrasting bearish trends with notable volatility and differing recent momentum dynamics.
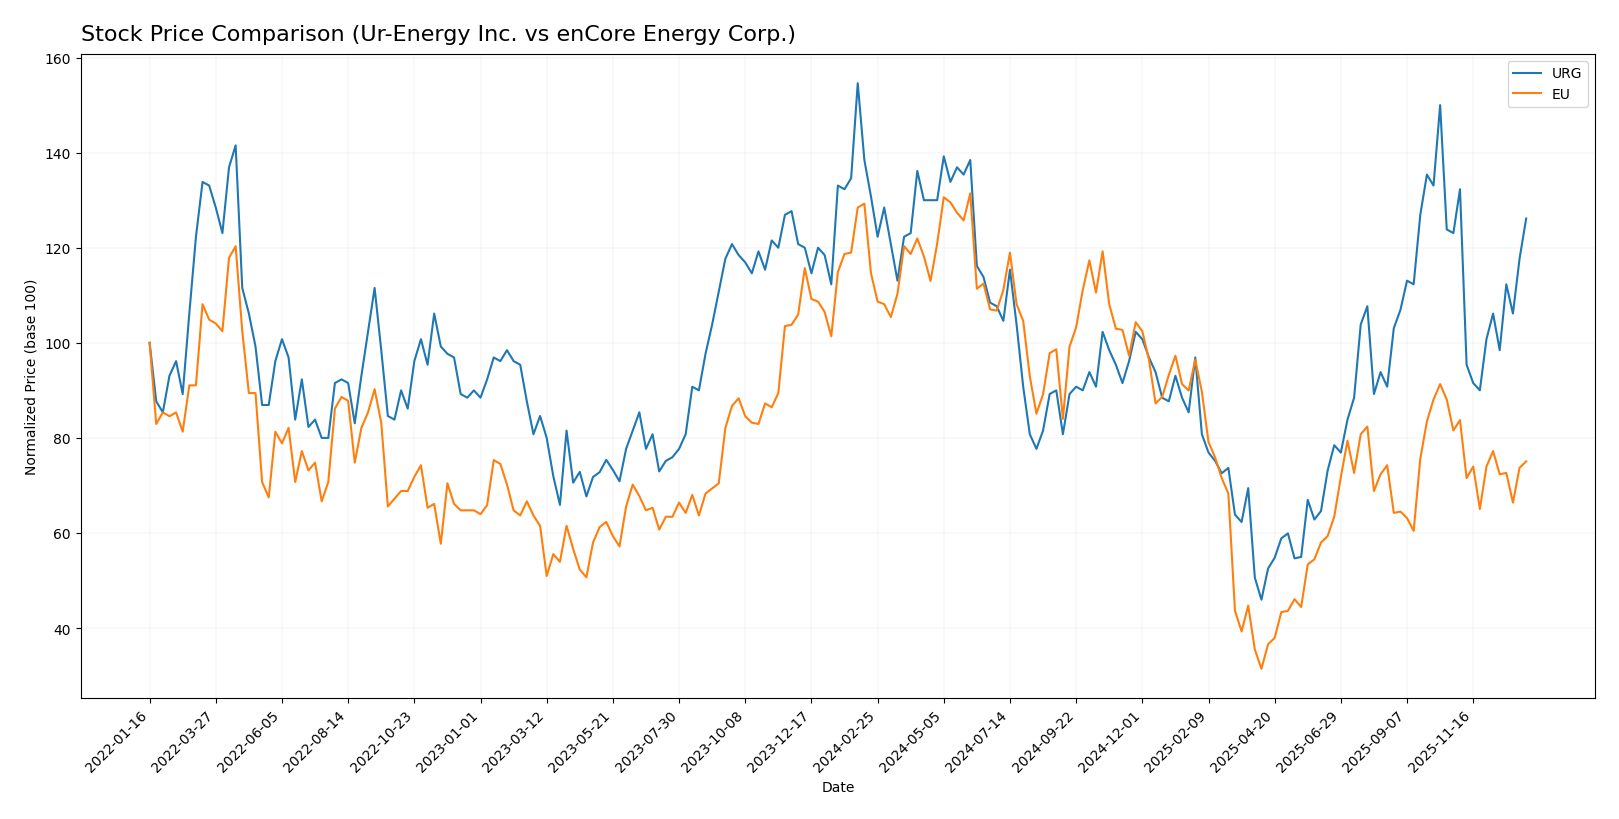
Trend Analysis
Ur-Energy Inc. (URG) experienced a -3.53% price decline over the past 12 months, indicating a bearish trend with accelerating downward momentum and moderate volatility (std dev 0.31). The stock ranged between 0.6 and 1.95 during this period.
enCore Energy Corp. (EU) showed a more pronounced bearish trend with a -34.52% price drop over the past year, accompanied by decelerating negative momentum and higher volatility (std dev 0.92). Its price fluctuated between 1.16 and 4.85.
Comparing both, Ur-Energy Inc. delivered the highest market performance, with a smaller percentage loss and recent positive price movement contrasting enCore’s larger decline and ongoing negative trend.
Target Prices
Analysts present a cautiously optimistic consensus for Ur-Energy Inc. and enCore Energy Corp.
| Company | Target High | Target Low | Consensus |
|---|---|---|---|
| Ur-Energy Inc. | 2.60 | 2.15 | 2.38 |
| enCore Energy Corp. | 3.50 | 3.50 | 3.50 |
The target consensus for Ur-Energy Inc. suggests a potential upside from the current price of 1.64 USD, while enCore Energy Corp.’s consensus price of 3.50 USD indicates a notable expected increase from its 2.77 USD trading level.
Analyst Opinions Comparison
This section compares analysts’ ratings and grades for Ur-Energy Inc. and enCore Energy Corp.:
Rating Comparison
URG Rating
- Rating: D+, considered Very Favorable overall by analysts.
- Discounted Cash Flow Score: 1, indicating a Very Unfavorable valuation score.
- ROE Score: 1, reflecting Very Unfavorable efficiency in generating equity returns.
- ROA Score: 1, showing Very Unfavorable asset utilization.
- Debt To Equity Score: 2, marked as Moderate financial risk.
- Overall Score: 1, assessed as Very Unfavorable financial standing.
EU Rating
- Rating: C-, considered Very Favorable overall by analysts.
- Discounted Cash Flow Score: 1, indicating a Very Unfavorable valuation score.
- ROE Score: 1, reflecting Very Unfavorable efficiency in generating equity returns.
- ROA Score: 1, showing Very Unfavorable asset utilization.
- Debt To Equity Score: 2, marked as Moderate financial risk.
- Overall Score: 1, assessed as Very Unfavorable financial standing.
Which one is the best rated?
Based strictly on the provided data, EU holds a slightly better rating at C- compared to URG’s D+, although both have identical low scores on financial metrics and moderate debt-to-equity risk.
Scores Comparison
The comparison of financial scores for Ur-Energy Inc. and enCore Energy Corp. is as follows:
URG Scores
- Altman Z-Score: 0.60, in distress zone indicating high bankruptcy risk.
- Piotroski Score: 2, categorized as very weak financial strength.
EU Scores
- Altman Z-Score: 1.17, also in distress zone with elevated bankruptcy risk.
- Piotroski Score: 4, considered average financial strength.
Which company has the best scores?
Based on the provided data, enCore Energy Corp. has higher Altman Z-Score and Piotroski Score values than Ur-Energy Inc., indicating relatively better financial stability and strength.
Grades Comparison
Here is the detailed comparison of the latest grades assigned to Ur-Energy Inc. and enCore Energy Corp.:
Ur-Energy Inc. Grades
This table summarizes recent grades from reputable grading companies for Ur-Energy Inc.:
| Grading Company | Action | New Grade | Date |
|---|---|---|---|
| HC Wainwright & Co. | Maintain | Buy | 2025-11-04 |
| B. Riley Securities | Maintain | Buy | 2025-09-25 |
| Roth Capital | Maintain | Buy | 2025-09-23 |
| HC Wainwright & Co. | Maintain | Buy | 2025-04-15 |
| HC Wainwright & Co. | Maintain | Buy | 2025-02-11 |
| Roth MKM | Maintain | Buy | 2024-10-23 |
| B. Riley Securities | Maintain | Buy | 2024-08-20 |
| HC Wainwright & Co. | Maintain | Buy | 2024-08-14 |
| HC Wainwright & Co. | Maintain | Buy | 2024-07-17 |
| Roth MKM | Maintain | Buy | 2024-05-09 |
Ur-Energy Inc. shows a consistent “Buy” rating across multiple respected grading firms with no recent changes to this outlook.
enCore Energy Corp. Grades
Below is the compilation of recent grades from trusted grading companies for enCore Energy Corp.:
| Grading Company | Action | New Grade | Date |
|---|---|---|---|
| HC Wainwright & Co. | Maintain | Buy | 2025-08-12 |
| HC Wainwright & Co. | Maintain | Buy | 2025-05-13 |
| HC Wainwright & Co. | Maintain | Buy | 2025-03-18 |
| HC Wainwright & Co. | Maintain | Buy | 2024-11-19 |
| HC Wainwright & Co. | Maintain | Buy | 2024-10-07 |
| HC Wainwright & Co. | Maintain | Buy | 2024-08-15 |
| HC Wainwright & Co. | Maintain | Buy | 2024-06-14 |
| B. Riley Securities | Maintain | Buy | 2024-05-15 |
enCore Energy Corp. also has a stable “Buy” rating from recognized grading companies, with no downward revisions reported.
Which company has the best grades?
Both Ur-Energy Inc. and enCore Energy Corp. have consistently received “Buy” grades from multiple reputable companies, indicating positive analyst sentiment. Ur-Energy has a broader number of recent evaluations, which could imply greater analyst coverage and confidence. This may influence investor perception and liquidity considerations.
Strengths and Weaknesses
Below is a comparative overview of the key strengths and weaknesses of Ur-Energy Inc. (URG) and enCore Energy Corp. (EU) based on their latest financial and operational data.
| Criterion | Ur-Energy Inc. (URG) | enCore Energy Corp. (EU) |
|---|---|---|
| Diversification | Limited product segmentation; focused on uranium production | Limited product segmentation; focused on uranium production |
| Profitability | Negative net margin (-157.8%), ROIC -36%, declining profitability | Negative net margin (-105.24%), ROIC -17.34%, declining profitability |
| Innovation | No significant data on innovation initiatives | No significant data on innovation initiatives |
| Global presence | Primarily US-focused, limited global reach | Primarily US-focused, limited global reach |
| Market Share | Small market share in uranium sector, no dominant position | Small market share in uranium sector, no dominant position |
Key takeaways: Both companies face significant profitability challenges with negative returns and declining ROIC, indicating value destruction and inefficiencies. Their limited diversification and global presence further constrain growth potential. Investors should exercise caution, focusing on risk management when considering these names.
Risk Analysis
Below is a comparison of key risk factors for Ur-Energy Inc. (URG) and enCore Energy Corp. (EU) based on the most recent data from 2024.
| Metric | Ur-Energy Inc. (URG) | enCore Energy Corp. (EU) |
|---|---|---|
| Market Risk | Beta 1.04 (moderate volatility) | Beta 1.44 (higher volatility) |
| Debt Level | Very low debt (D/E 0.01) | Low debt (D/E 0.07) |
| Regulatory Risk | Moderate uranium mining regulations in US | Similar regulatory environment, multiple projects in New Mexico and Wyoming |
| Operational Risk | 101 employees, limited asset turnover | Operational scale unclear, asset turnover slightly lower than URG |
| Environmental Risk | Uranium mining impact, subject to environmental compliance | Similar uranium-related environmental concerns |
| Geopolitical Risk | US-based operations, relatively stable | US-based operations, stable but project locations dispersed |
Both companies face significant financial distress risks, with Altman Z-Scores placing them in the distress zone, signaling potential bankruptcy risk. enCore shows slightly higher market volatility and a moderate Piotroski score, indicating average financial health compared to Ur-Energy’s very weak score. Operational and environmental risks remain material due to the nature of uranium mining, while regulatory frameworks in the US impose ongoing compliance costs. Investors should weigh these risks carefully, prioritizing financial stability and regulatory exposure.
Which Stock to Choose?
Ur-Energy Inc. (URG) shows a mixed income evolution with strong revenue growth (+305% over 2020-2024) but declining profitability and negative margins. Its financial ratios are mostly unfavorable, with a very unfavorable global evaluation, yet it maintains low debt levels and a very favorable rating of D+. The company’s return on invested capital is below its cost of capital and declining, signaling value destruction.
enCore Energy Corp. (EU) also experiences revenue growth (notably +163% in the last year), but overall income metrics and profitability remain weak with negative margins and unfavorable financial ratios. Debt is slightly higher than URG’s but still low, and its rating is slightly lower at C-. The company similarly shows a declining ROIC below WACC, indicating value erosion.
For investors, URG’s stronger rating and lower debt might appear more favorable for those prioritizing financial stability despite profitability challenges, while EU’s sharper recent revenue growth and moderate rating could appeal to those with a higher risk tolerance seeking growth exposure. Both companies exhibit unfavorable income and ratio profiles, suggesting caution.
Disclaimer: Investment carries a risk of loss of initial capital. The past performance is not a reliable indicator of future results. Be sure to understand risks before making an investment decision.
Go Further
I encourage you to read the complete analyses of Ur-Energy Inc. and enCore Energy Corp. to enhance your investment decisions: