In today’s competitive energy sector, NexGen Energy Ltd. (NXE) and enCore Energy Corp. (EU) stand out as prominent players in uranium exploration and development. Both companies focus on expanding their resource bases in North America, leveraging innovative strategies to meet growing global demand for clean energy. This article will carefully analyze their strengths and risks to help you decide which uranium stock holds the most promise for your investment portfolio.
Table of contents
Companies Overview
I will begin the comparison between NexGen Energy Ltd. and enCore Energy Corp. by providing an overview of these two companies and their main differences.
NexGen Energy Ltd. Overview
NexGen Energy Ltd. is an exploration and development stage company focused on uranium properties in Canada. Its principal asset is the Rook I project, covering 35,065 hectares in Saskatchewan’s Athabasca Basin. NexGen aims to advance uranium exploration and development, positioning itself as a significant player in the Canadian uranium sector. The company is headquartered in Vancouver and listed on the NYSE with a market cap of approximately 7B USD.
enCore Energy Corp. Overview
enCore Energy Corp. engages in uranium acquisition, exploration, and development across multiple projects in the United States. Its portfolio includes interests in New Mexico, Utah, South Dakota, and Wyoming, covering extensive land areas totaling hundreds of thousands of acres. Headquartered in Corpus Christi, Texas, enCore is listed on NASDAQ with a market cap near 520M USD, focusing on expanding its uranium resource base within the U.S. market.
Key similarities and differences
Both NexGen and enCore operate in the uranium industry with a focus on exploration and development of mining properties. NexGen’s activities are concentrated in Canada, while enCore’s projects are spread across multiple U.S. states. NexGen has a significantly larger market capitalization and a single flagship project, whereas enCore holds a diversified portfolio of smaller projects. Both companies are publicly traded and actively advancing uranium resources, but their geographic focus and scale differ markedly.
Income Statement Comparison
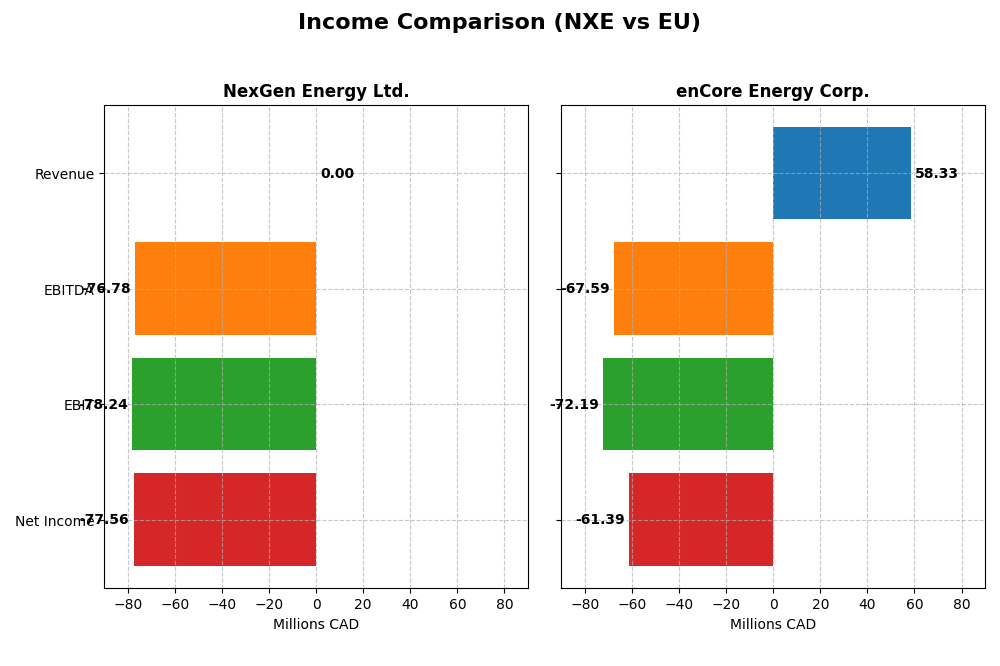
The table below presents the key income statement figures for NexGen Energy Ltd. and enCore Energy Corp. for their most recent fiscal year, providing a clear financial snapshot for comparison.
| Metric | NexGen Energy Ltd. (NXE) | enCore Energy Corp. (EU) |
|---|---|---|
| Market Cap | 7.03B CAD | 519M USD |
| Revenue | 0 CAD | 58.3M USD |
| EBITDA | -76.8M CAD | -67.6M USD |
| EBIT | -78.2M CAD | -72.2M USD |
| Net Income | -77.6M CAD | -61.4M USD |
| EPS | -0.14 CAD | -0.34 USD |
| Fiscal Year | 2024 | 2024 |
Income Statement Interpretations
NexGen Energy Ltd.
NexGen Energy Ltd. has seen no revenue generation over the 2020-2024 period, resulting in persistently negative net income except in 2023, which showed a positive net income of CAD 80.8M. Margins remain unfavorable, with zero gross and EBIT margins reflecting operational challenges. The 2024 fiscal year marked a decline with net income turning sharply negative at CAD -77.6M, indicating a slowdown and margin deterioration.
enCore Energy Corp.
enCore Energy Corp. experienced fluctuating revenue, reaching USD 58.3M in 2024 from USD 22.1M in 2023, but gross profit remained negative at USD -7.2M in 2024. Net income was consistently negative, worsening to USD -61.4M in 2024. Margins have been unfavorable, with EBIT and net margins deepening losses. The latest year saw revenue growth but continued net losses and margin contraction.
Which one has the stronger fundamentals?
Both companies show unfavorable income statement trends with persistent negative margins and net losses, despite some revenue growth for enCore. NexGen’s single profitable year contrasts with enCore’s consistent losses. However, NexGen’s lack of revenue and recurring losses in 2024 weigh against it, while enCore’s revenue growth is offset by deepening negative margins. Overall, neither demonstrates clearly stronger fundamentals based on income statements.
Financial Ratios Comparison
The table below presents the most recent financial ratios for NexGen Energy Ltd. (NXE) and enCore Energy Corp. (EU), reflecting their operational efficiency, profitability, liquidity, and leverage as of fiscal year 2024.
| Ratios | NexGen Energy Ltd. (NXE) | enCore Energy Corp. (EU) |
|---|---|---|
| ROE | -6.58% | -21.49% |
| ROIC | -4.39% | -17.34% |
| P/E | -67.80 | -10.11 |
| P/B | 4.46 | 2.17 |
| Current Ratio | 1.03 | 2.91 |
| Quick Ratio | 1.03 | 2.21 |
| D/E | 0.39 | 0.07 |
| Debt-to-Assets | 27.56% | 5.20% |
| Interest Coverage | -2.33 | -41.60 |
| Asset Turnover | 0 | 0.15 |
| Fixed Asset Turnover | 0 | 0.20 |
| Payout Ratio | 0 | 0 |
| Dividend Yield | 0% | 0% |
Interpretation of the Ratios
NexGen Energy Ltd.
NexGen Energy Ltd. exhibits predominantly unfavorable financial ratios, including negative returns on equity (-6.58%) and invested capital (-4.39%), alongside a zero net margin and weak asset turnover. However, it benefits from favorable leverage ratios such as a debt-to-equity of 0.39 and a quick ratio of 1.03. The company does not pay dividends, likely reflecting its exploration and development stage focus with reinvestment priorities.
enCore Energy Corp.
enCore Energy Corp. shows a mixed profile with several favorable liquidity and leverage ratios, including a current ratio of 2.91 and a debt-to-assets ratio of 5.2%. Nevertheless, profitability metrics remain weak, with a negative net margin (-105.24%) and return on equity (-21.49%). Like NexGen, enCore Energy does not distribute dividends, consistent with its growth and reinvestment strategy in uranium exploration.
Which one has the best ratios?
Both companies carry an overall unfavorable ratio profile, but enCore Energy demonstrates stronger liquidity and lower leverage metrics, which may indicate a more conservative financial structure. NexGen, while showing some favorable leverage ratios, suffers from weaker profitability and asset efficiency. Neither company currently provides shareholder returns through dividends, reflecting their development stage.
Strategic Positioning
This section compares the strategic positioning of NexGen Energy Ltd. and enCore Energy Corp. by market position, key segments, and exposure to technological disruption:
NexGen Energy Ltd.
- Larger market cap of 7B USD, facing industry competition.
- Focused on uranium exploration in Canada’s Athabasca Basin.
- No explicit data on technological disruption exposure.
enCore Energy Corp.
- Smaller market cap of 519M USD, also under sector pressure.
- Uranium exploration across multiple U.S. project areas.
- No explicit data on technological disruption exposure.
NexGen Energy Ltd. vs enCore Energy Corp. Positioning
NexGen is concentrated in a single large Canadian uranium project, while enCore is diversified across multiple U.S. uranium sites. NexGen’s scale suggests stronger market presence; enCore benefits from geographic diversification but operates on a smaller scale.
Which has the best competitive advantage?
Both companies are shedding value with ROIC below WACC, but NexGen shows a slightly unfavorable moat with improving profitability, whereas enCore’s moat is very unfavorable with declining returns, indicating weaker competitive advantage.
Stock Comparison
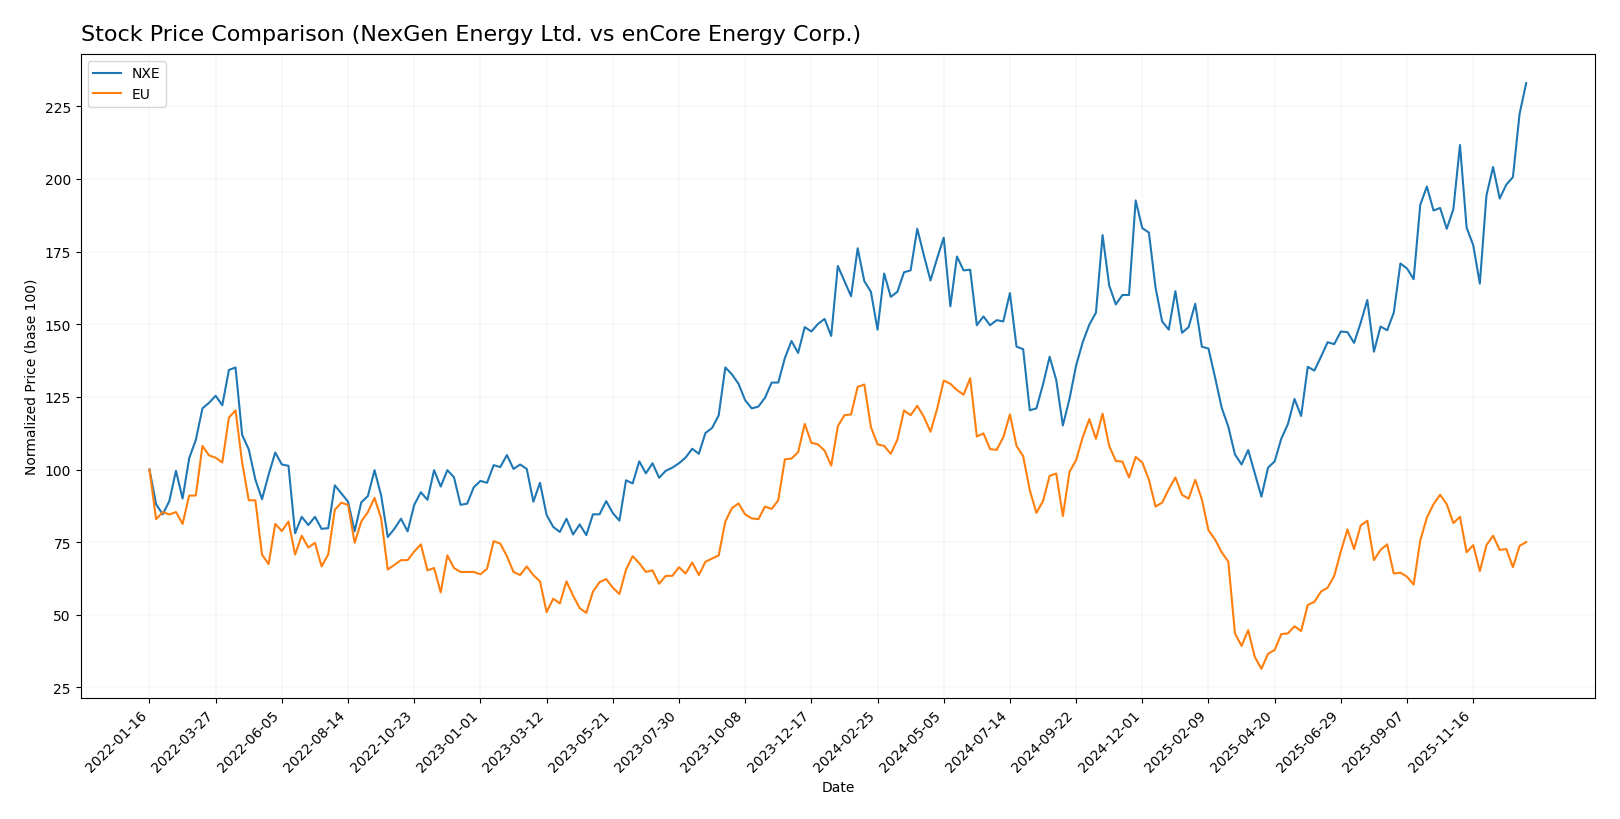
The stock prices of NexGen Energy Ltd. (NXE) and enCore Energy Corp. (EU) have shown contrasting movements over the past 12 months, reflecting divergent investor sentiment and trading dynamics.
Trend Analysis
NexGen Energy Ltd. exhibited a strong bullish trend over the past year, with a 44.55% price increase and accelerating momentum. The stock traded between 4.18 and 10.74, showing low volatility with a 1.3 standard deviation.
enCore Energy Corp. experienced a bearish trend with a 34.52% price decline over the same period, coupled with deceleration. Price ranged from 1.16 to 4.85, and volatility remained moderate at a 0.92 standard deviation.
Comparing both stocks, NexGen Energy Ltd. delivered the highest market performance with significant price gains, while enCore Energy Corp. saw a notable decline in value over the past year.
Target Prices
There is a clear analyst consensus for enCore Energy Corp., while no verified target price data is available for NexGen Energy Ltd.
| Company | Target High | Target Low | Consensus |
|---|---|---|---|
| enCore Energy Corp. | 3.5 | 3.5 | 3.5 |
For enCore Energy Corp., analysts expect the stock to reach 3.5 USD, which is above the current price of 2.77 USD, indicating potential upside. No verified target price data is available from recognized analysts for NexGen Energy Ltd.
Analyst Opinions Comparison
This section compares analysts’ ratings and grades for NexGen Energy Ltd. and enCore Energy Corp.:
Rating Comparison
NexGen Energy Ltd. Rating
- Rating: D+ indicating a very favorable stance by analysts.
- Discounted Cash Flow Score: 2, a moderate outlook on valuation.
- ROE Score: 1, showing a very unfavorable efficiency in equity.
- ROA Score: 1, very unfavorable asset utilization.
- Debt To Equity Score: 1, very unfavorable financial risk.
- Overall Score: 1, very unfavorable overall financial health.
enCore Energy Corp. Rating
- Rating: C- also reflecting a very favorable analyst view.
- Discounted Cash Flow Score: 1, considered very unfavorable.
- ROE Score: 1, similarly very unfavorable for equity returns.
- ROA Score: 1, also very unfavorable asset usage.
- Debt To Equity Score: 2, moderate financial risk profile.
- Overall Score: 1, very unfavorable overall financial health.
Which one is the best rated?
Based strictly on provided data, NexGen Energy Ltd. and enCore Energy Corp. share the same very unfavorable overall score of 1. NexGen fares better in discounted cash flow, while enCore has a moderately better debt-to-equity score, showing mixed strengths.
Scores Comparison
Here is a comparison of the Altman Z-Score and Piotroski Score for NexGen Energy Ltd. and enCore Energy Corp.:
NexGen Energy Ltd. Scores
- Altman Z-Score: 6.89, indicating a safe zone with low bankruptcy risk.
- Piotroski Score: 1, classified as very weak financial strength.
enCore Energy Corp. Scores
- Altman Z-Score: 1.17, placing the company in the distress zone with higher bankruptcy risk.
- Piotroski Score: 4, considered average financial strength.
Which company has the best scores?
NexGen Energy Ltd. has a significantly higher Altman Z-Score, suggesting stronger financial stability, while enCore Energy Corp. has a better Piotroski Score, indicating comparatively stronger financial health. Each company shows strength in different scoring metrics based on the available data.
Grades Comparison
Here is the comparison of the available grades and ratings for NexGen Energy Ltd. and enCore Energy Corp.:
NexGen Energy Ltd. Grades
The following table summarizes the consensus grades for NexGen Energy Ltd. from verified sources.
| Grading Company | Action | New Grade | Date |
|---|---|---|---|
| Consensus | Buy | Buy | N/A |
NexGen Energy Ltd. holds a consensus “Buy” rating based on 4 buy recommendations and no sell or hold ratings.
enCore Energy Corp. Grades
Below is a summary of the recent grades for enCore Energy Corp. from established grading firms.
| Grading Company | Action | New Grade | Date |
|---|---|---|---|
| HC Wainwright & Co. | Maintain | Buy | 2025-08-12 |
| HC Wainwright & Co. | Maintain | Buy | 2025-05-13 |
| HC Wainwright & Co. | Maintain | Buy | 2025-03-18 |
| HC Wainwright & Co. | Maintain | Buy | 2024-11-19 |
| HC Wainwright & Co. | Maintain | Buy | 2024-10-07 |
| HC Wainwright & Co. | Maintain | Buy | 2024-08-15 |
| HC Wainwright & Co. | Maintain | Buy | 2024-06-14 |
| B. Riley Securities | Maintain | Buy | 2024-05-15 |
enCore Energy Corp. consistently receives “Buy” ratings from HC Wainwright & Co. and B. Riley Securities over the last two years.
Which company has the best grades?
Both NexGen Energy Ltd. and enCore Energy Corp. have a consensus “Buy” rating; however, enCore Energy Corp. benefits from multiple consistent buy grades by reputable firms, potentially indicating stronger analyst confidence, which may influence investor sentiment positively.
Strengths and Weaknesses
Below is a comparative overview of NexGen Energy Ltd. (NXE) and enCore Energy Corp. (EU) based on their diversification, profitability, innovation, global presence, and market share using the most recent data.
| Criterion | NexGen Energy Ltd. (NXE) | enCore Energy Corp. (EU) |
|---|---|---|
| Diversification | Limited product range, focused on uranium | Limited product range, focused on uranium |
| Profitability | Negative ROIC, shedding value but improving | Negative ROIC, shedding value with declining profitability |
| Innovation | Moderate, with growing ROIC trend | Limited, with declining ROIC trend |
| Global presence | Primarily North America | Primarily North America |
| Market Share | Small, niche market position | Small, niche market position |
Key takeaways: Both companies operate in a niche uranium sector with limited diversification and global presence. NexGen shows improving profitability trends despite current value destruction, while enCore faces worsening profitability. Caution is advised as both have unfavorable overall financial health.
Risk Analysis
Below is a comparative table of key risks for NexGen Energy Ltd. (NXE) and enCore Energy Corp. (EU) based on the most recent data from 2024:
| Metric | NexGen Energy Ltd. (NXE) | enCore Energy Corp. (EU) |
|---|---|---|
| Market Risk | High beta 1.86 indicates high volatility | Beta 1.44, moderate volatility |
| Debt level | Moderate debt-to-assets 27.56%, DE 0.39, manageable | Low debt-to-assets 5.2%, DE 0.07, low leverage |
| Regulatory Risk | Exposure to Canadian uranium regulations, subject to mining permits | US uranium mining subject to federal and state regulations |
| Operational Risk | Exploration-stage with no current revenue, negative margins and ROE | Early development with significant losses, negative profitability metrics |
| Environmental Risk | Uranium mining with environmental sensitivity in Athabasca Basin | Operations in multiple US sites with potential environmental impact |
| Geopolitical Risk | Canadian base, relatively stable geopolitical environment | US operations, stable but subject to US political shifts |
In synthesis, both companies face significant operational and financial risks due to their early-stage development status and negative profitability in 2024. NXE has higher market volatility but more substantial asset backing, while EU has a lower debt burden but is closer to financial distress per its Altman Z-Score. Regulatory and environmental risks are inherent in uranium mining but remain manageable within stable North American jurisdictions. Investors should weigh these risks carefully, focusing on financial stability and operational progress.
Which Stock to Choose?
NexGen Energy Ltd. (NXE) shows a flat income evolution with unfavorable profitability and financial ratios overall, despite slight improvements in net income growth and ROIC trend. Its debt level remains moderate, but the rating is very unfavorable.
enCore Energy Corp. (EU) exhibits volatile income with strong revenue growth last year but negative net income growth overall. Financial ratios are generally unfavorable, though liquidity and low debt are favorable. Its rating is also very unfavorable.
For risk-tolerant investors focused on growth, NXE’s improving ROIC trend and bullish price momentum may appear more attractive, while those prioritizing liquidity and lower leverage might view EU’s balance sheet favorably despite declining profitability and bearish trend.
Disclaimer: Investment carries a risk of loss of initial capital. The past performance is not a reliable indicator of future results. Be sure to understand risks before making an investment decision.
Go Further
I encourage you to read the complete analyses of NexGen Energy Ltd. and enCore Energy Corp. to enhance your investment decisions: