Emerson Electric Co. (EMR) and Xylem Inc. (XYL) are two leading players in the industrial machinery sector, both delivering innovative solutions that address critical infrastructure and environmental challenges. Emerson’s broad automation and commercial product portfolio contrasts with Xylem’s specialized focus on water technology and smart infrastructure. This article will help you evaluate which company presents the most compelling investment opportunity in today’s evolving industrial landscape.
Table of contents
Companies Overview
I will begin the comparison between Emerson Electric Co. and Xylem Inc. by providing an overview of these two companies and their main differences.
Emerson Electric Co. Overview
Emerson Electric Co. is a technology and engineering firm serving industrial, commercial, and residential markets globally. It operates mainly through Automation Solutions and Commercial & Residential Solutions segments, providing measurement instruments, process control systems, HVAC products, and environmental controls. Headquartered in Saint Louis, Missouri, Emerson focuses on diverse sectors such as oil and gas, power generation, and municipal water supplies.
Xylem Inc. Overview
Xylem Inc. specializes in engineered products and solutions for water and wastewater applications worldwide. Its business is divided into Water Infrastructure, Applied Water, and Measurement & Control Solutions segments, offering pumps, treatment equipment, smart meters, and cloud-based analytics. Based in Rye Brook, New York, Xylem serves residential, commercial, and industrial customers with an emphasis on water transportation, treatment, and management.
Key similarities and differences
Both Emerson and Xylem operate in the industrial machinery sector with a strong focus on engineered solutions. Emerson has a broader market reach across various industries including commercial HVAC and industrial automation, while Xylem concentrates specifically on water-related infrastructure and technology. Emerson’s product portfolio is more diversified, whereas Xylem emphasizes water treatment, measurement, and smart infrastructure services.
Income Statement Comparison
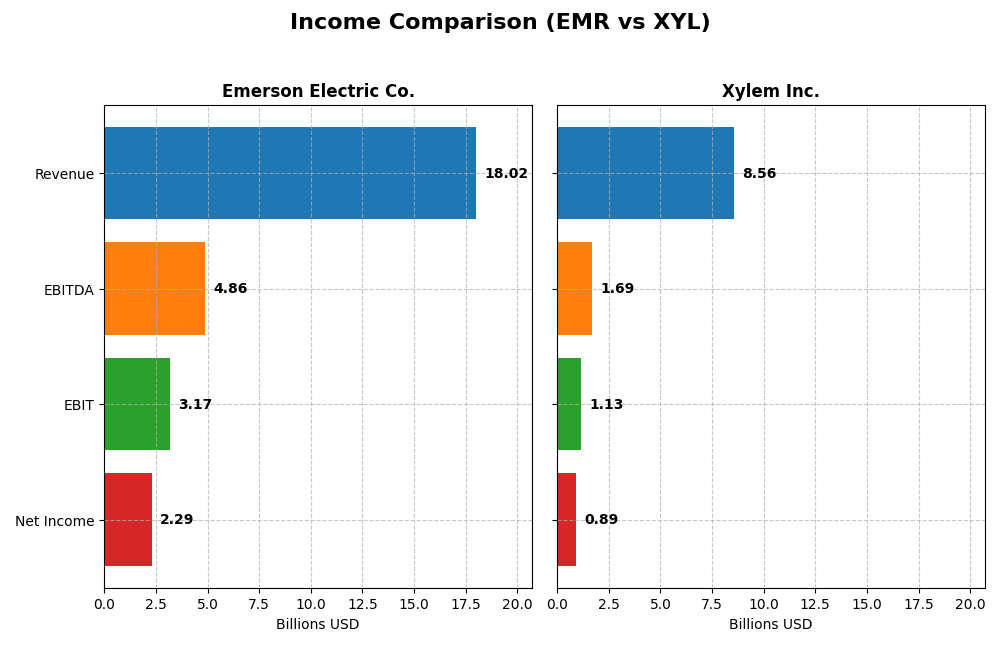
The table below presents a factual comparison of the latest fiscal year income statement metrics for Emerson Electric Co. and Xylem Inc., providing key financial insights side by side.
| Metric | Emerson Electric Co. | Xylem Inc. |
|---|---|---|
| Market Cap | 81B | 34B |
| Revenue | 18.0B | 8.56B |
| EBITDA | 4.86B | 1.69B |
| EBIT | 3.17B | 1.13B |
| Net Income | 2.29B | 890M |
| EPS | 4.06 | 3.67 |
| Fiscal Year | 2025 | 2024 |
Income Statement Interpretations
Emerson Electric Co.
Emerson Electric Co. showed steady revenue growth of 3.0% in the most recent year, continuing a positive trend over 2021-2025 with a 39.31% increase overall. Gross and EBIT margins remain favorable at 52.84% and 17.6%, respectively, while net margin improved to 12.73%. Despite a slight overall net income decline, 2025 saw a solid EBIT jump of 35.34% and EPS growth of 17.83%.
Xylem Inc.
Xylem Inc. experienced strong revenue growth of 16.27% in the latest fiscal year, continuing a robust trend since 2020 with a total increase of 75.59%. Margins are stable and favorable, with a gross margin of 37.51% and EBIT margin at 13.21%. Net margin improved significantly by 25.69%, alongside a 30.82% EPS increase, reflecting strong operational performance in 2024.
Which one has the stronger fundamentals?
Both companies demonstrate favorable income statement fundamentals with solid margin profiles and positive growth trends. Emerson boasts higher margins and stability, while Xylem shows superior top-line and net income growth rates and consistent margin improvements. Emerson’s slight net income decline contrasts with Xylem’s robust overall increases, highlighting different growth dynamics in each firm’s financial performance.
Financial Ratios Comparison
The table below presents a side-by-side comparison of key financial ratios for Emerson Electric Co. (EMR) and Xylem Inc. (XYL) based on their most recent fiscal year data.
| Ratios | Emerson Electric Co. (EMR) | Xylem Inc. (XYL) |
|---|---|---|
| ROE | 11.30% | 8.36% |
| ROIC | 4.62% | 5.78% |
| P/E | 32.42 | 31.63 |
| P/B | 3.66 | 2.64 |
| Current Ratio | 0.88 | 1.75 |
| Quick Ratio | 0.65 | 1.33 |
| D/E (Debt-to-Equity) | 0.65 | 0.20 |
| Debt-to-Assets | 31.3% | 12.9% |
| Interest Coverage | 9.44 | 22.93 |
| Asset Turnover | 0.43 | 0.52 |
| Fixed Asset Turnover | 6.28 | 7.43 |
| Payout ratio | 52.0% | 39.3% |
| Dividend yield | 1.60% | 1.24% |
Interpretation of the Ratios
Emerson Electric Co.
Emerson Electric shows a mixed ratio profile with strong net margin (12.73%) and interest coverage (13.38), indicating solid profitability and debt servicing ability. However, unfavorable return on invested capital (4.62%), valuation multiples (PE 32.42, PB 3.66), and liquidity ratios (current ratio 0.88, quick ratio 0.65) raise concerns about efficiency and short-term solvency. The company offers a moderate dividend yield of 1.6%, reflecting a balanced shareholder return approach.
Xylem Inc.
Xylem presents a generally favorable ratio profile with strong liquidity (current ratio 1.75, quick ratio 1.33), low leverage (debt-to-assets 12.88%), and high interest coverage (25.7), supporting financial stability. While net margin is solid at 10.39%, weaker return on equity (8.36%) and a high PE ratio (31.63) suggest moderate profitability and valuation pressure. The dividend yield stands at 1.24%, maintaining shareholder returns modestly.
Which one has the best ratios?
Xylem’s ratios are more favorable overall, with half rated positively and fewer unfavorable metrics, reflecting stronger liquidity, leverage, and coverage ratios. Emerson’s profile is slightly unfavorable due to weaker liquidity and capital efficiency despite better net margin. Thus, Xylem demonstrates a more balanced ratio set compared to Emerson’s mixed performance.
Strategic Positioning
This section compares the strategic positioning of Emerson Electric Co. and Xylem Inc., including market position, key segments, and exposure to technological disruption:
Emerson Electric Co.
- Large industrial machinery player with broad global reach facing moderate competitive pressure.
- Diversified segments: Automation Solutions and Commercial & Residential Solutions drive revenue.
- Exposure to technological disruption through software, control systems, and smart device innovation.
Xylem Inc.
- Mid-sized industrial machinery firm focused on water solutions with moderate competition.
- Concentrated on water infrastructure, applied water, and measurement & control segments.
- Invests in smart meters, remote monitoring, and digital water management solutions.
Emerson Electric Co. vs Xylem Inc. Positioning
Emerson displays a diversified industrial portfolio spanning automation and residential solutions, providing multiple revenue streams. Xylem concentrates on water-related technologies and services, offering focused expertise but less diversification. Each approach carries different operational scope and market risk profiles.
Which has the best competitive advantage?
Both companies currently shed value as ROIC remains below WACC. Xylem shows improving profitability trends, while Emerson experiences declining returns, suggesting a slightly stronger moat durability for Xylem despite ongoing value destruction.
Stock Comparison
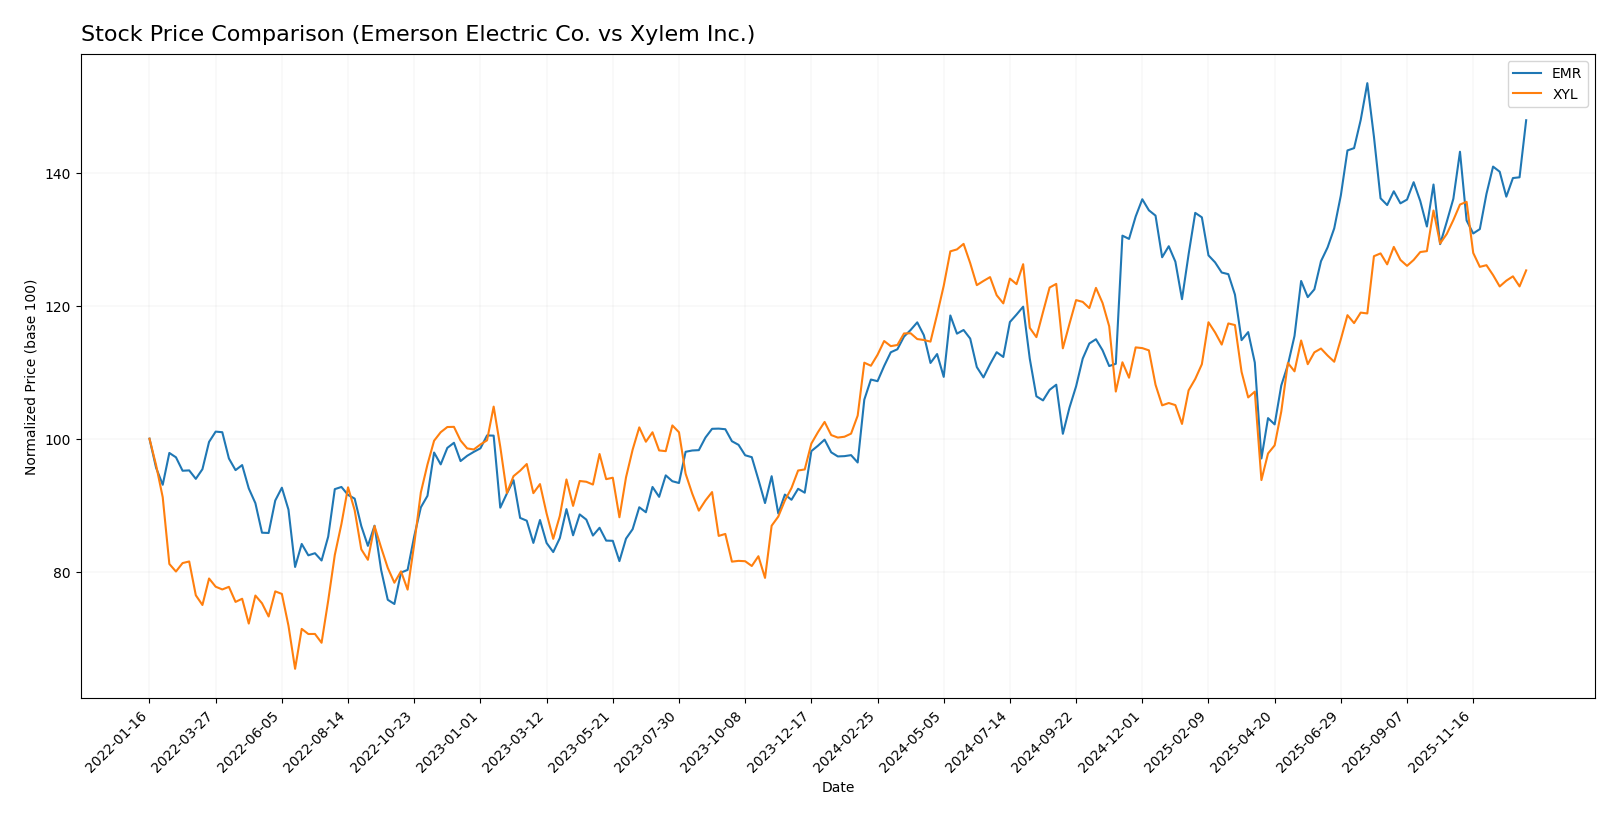
The stock price chart highlights Emerson Electric Co. (EMR) and Xylem Inc. (XYL) performance over the past year, showing significant price movements with EMR demonstrating stronger bullish momentum and XYL experiencing a recent downturn despite overall gains.
Trend Analysis
Emerson Electric Co. (EMR) recorded a 35.84% price increase over the past 12 months, indicating a bullish trend with acceleration. The stock ranged between 94.57 and 149.63, showing notable volatility with a standard deviation of 12.39.
Xylem Inc. (XYL) gained 12.93% over the same period, also bullish but with deceleration. Its price fluctuated between 104.6 and 151.31, with a 9.45 standard deviation. The recent trend shows a 5.7% decline indicating short-term weakness.
Comparing both, EMR outperformed XYL in market performance over the past year, displaying stronger price appreciation and positive momentum despite higher volatility.
Target Prices
Analysts present a bullish consensus with solid upside potential for both Emerson Electric Co. and Xylem Inc.
| Company | Target High | Target Low | Consensus |
|---|---|---|---|
| Emerson Electric Co. | 170 | 125 | 149.67 |
| Xylem Inc. | 178 | 150 | 169.43 |
The consensus targets exceed current prices, suggesting moderate to strong analyst confidence in future gains for Emerson and Xylem, with Xylem showing a higher potential upside relative to its current market price.
Analyst Opinions Comparison
This section compares analysts’ ratings and grades for Emerson Electric Co. and Xylem Inc.:
Rating Comparison
Emerson Electric Co. Rating
- Rating: B, considered Very Favorable by analysts.
- Discounted Cash Flow Score: 3, indicating a moderate valuation.
- ROE Score: 3, reflecting moderate efficiency in generating profit from equity.
- ROA Score: 4, showing favorable asset utilization.
- Debt To Equity Score: 2, suggesting moderate financial risk.
- Overall Score: 3, a moderate overall financial standing.
Xylem Inc. Rating
- Rating: B, also considered Very Favorable.
- Discounted Cash Flow Score: 3, similarly moderate valuation.
- ROE Score: 3, matching moderate efficiency.
- ROA Score: 4, equally favorable asset utilization.
- Debt To Equity Score: 3, indicating a slightly stronger balance sheet.
- Overall Score: 3, also moderate overall financial standing.
Which one is the best rated?
Both Emerson Electric Co. and Xylem Inc. share the same overall rating of B and equal scores for discounted cash flow, ROE, and ROA. Xylem holds a marginally higher debt-to-equity score, indicating a slightly stronger balance sheet compared to Emerson.
Scores Comparison
Here is a comparison of the Altman Z-Score and Piotroski Score for Emerson Electric Co. (EMR) and Xylem Inc. (XYL):
EMR Scores
- Altman Z-Score: 2.68, in the grey zone indicating moderate bankruptcy risk.
- Piotroski Score: 7, classified as strong financial health.
XYL Scores
- Altman Z-Score: 4.89, in the safe zone indicating low bankruptcy risk.
- Piotroski Score: 8, classified as very strong financial health.
Which company has the best scores?
Based on the provided data, XYL has the best scores with a higher Altman Z-Score in the safe zone and a very strong Piotroski Score of 8, compared to EMR’s grey zone Z-Score and strong Piotroski Score of 7.
Grades Comparison
Here is the comparison of the latest grades and ratings from recognized financial institutions for Emerson Electric Co. and Xylem Inc.:
Emerson Electric Co. Grades
The following table summarizes recent grades from major financial firms for Emerson Electric Co.:
| Grading Company | Action | New Grade | Date |
|---|---|---|---|
| Wells Fargo | Maintain | Equal Weight | 2026-01-07 |
| Barclays | Maintain | Equal Weight | 2026-01-07 |
| UBS | Upgrade | Buy | 2026-01-05 |
| Jefferies | Downgrade | Hold | 2025-12-10 |
| JP Morgan | Maintain | Neutral | 2025-11-10 |
| RBC Capital | Maintain | Outperform | 2025-11-06 |
| Barclays | Maintain | Equal Weight | 2025-11-06 |
| RBC Capital | Maintain | Outperform | 2025-10-16 |
| JP Morgan | Maintain | Neutral | 2025-10-15 |
| Wells Fargo | Downgrade | Equal Weight | 2025-10-06 |
Emerson Electric’s grades show a mix of “Equal Weight,” “Neutral,” and “Outperform” ratings, with recent upgrades and downgrades indicating a somewhat mixed but generally stable outlook.
Xylem Inc. Grades
The following table shows recent grades from reputable grading companies for Xylem Inc.:
| Grading Company | Action | New Grade | Date |
|---|---|---|---|
| Barclays | Maintain | Overweight | 2026-01-07 |
| Mizuho | Maintain | Neutral | 2026-01-05 |
| TD Cowen | Maintain | Hold | 2025-12-05 |
| UBS | Maintain | Buy | 2025-11-06 |
| RBC Capital | Maintain | Outperform | 2025-10-29 |
| Stifel | Maintain | Buy | 2025-10-29 |
| Barclays | Maintain | Overweight | 2025-10-29 |
| Citigroup | Maintain | Buy | 2025-10-29 |
| Citigroup | Maintain | Buy | 2025-10-09 |
| Mizuho | Maintain | Neutral | 2025-09-12 |
Xylem’s grades are mostly positive, featuring multiple “Buy,” “Outperform,” and “Overweight” ratings, suggesting a broadly favorable view from analysts.
Which company has the best grades?
Emerson Electric holds a mixed consensus with a “Buy” consensus overall, while Xylem Inc. has a “Hold” consensus despite more frequent “Buy” and “Outperform” ratings. Investors may interpret Emerson’s consistent “Equal Weight” and “Neutral” grades as moderate risk, while Xylem’s higher number of positive ratings indicates stronger analyst confidence, potentially influencing portfolio positioning differently.
Strengths and Weaknesses
Below is a comparison of key strengths and weaknesses for Emerson Electric Co. (EMR) and Xylem Inc. (XYL) based on their recent financial and operational data:
| Criterion | Emerson Electric Co. (EMR) | Xylem Inc. (XYL) |
|---|---|---|
| Diversification | Highly diversified with Intelligent Devices and Software & Control segments generating $12.4B and $5.7B in 2025 | Moderate diversification focused on Applied Water, Measurement & Control, and Water Infrastructure segments with revenues around $1.8B to $2.6B in 2024 |
| Profitability | Net margin favorable at 12.7%, but ROIC unfavorable at 4.6% below WACC (8.8%) indicating value destruction | Net margin favorable at 10.4%, ROIC at 5.8% near WACC (8.9%) showing slight value shedding but improving profitability |
| Innovation | Moderate: High fixed asset turnover (6.3) suggests operational efficiency, but declining ROIC trend (-43%) signals challenges in innovation impact | Growing ROIC (+32%) and favorable operational ratios indicate improving innovation and efficiency |
| Global presence | Strong global footprint with broad industrial automation and climate tech exposure | Focused global presence in water solutions and infrastructure markets |
| Market Share | Large market share in automation solutions and intelligent devices with $12B+ revenue | Significant player in water technology sectors, but smaller scale compared to EMR |
In summary, Emerson Electric shows strong diversification and market presence but faces challenges with declining profitability and value destruction. Xylem, while smaller, demonstrates improving profitability trends and financial health, making it a cautiously attractive option for investors focused on water technology innovation.
Risk Analysis
Below is a comparative table presenting key risks for Emerson Electric Co. (EMR) and Xylem Inc. (XYL) based on the latest available data from 2025 and 2024 respectively:
| Metric | Emerson Electric Co. (EMR) | Xylem Inc. (XYL) |
|---|---|---|
| Market Risk | Beta 1.254, moderate volatility | Beta 1.172, moderate volatility |
| Debt level | Debt/Equity 0.65, neutral | Debt/Equity 0.20, favorable |
| Regulatory Risk | Moderate, industrial sector exposure | Moderate, water infrastructure focus |
| Operational Risk | Unfavorable asset turnover (0.43) | Neutral asset turnover (0.52) |
| Environmental Risk | Exposure to energy-intensive markets | Focus on water and wastewater solutions |
| Geopolitical Risk | Global presence in multiple regions | Global operations, but less diversified |
Emerson faces higher operational and market risks due to lower asset turnover and higher beta, with moderate debt levels. Xylem benefits from a stronger balance sheet and safer financial scores, but faces moderate regulatory risks related to water infrastructure. The most impactful risk for Emerson lies in operational efficiency, while for Xylem, maintaining regulatory compliance and environmental standards is crucial.
Which Stock to Choose?
Emerson Electric Co. (EMR) shows a mixed income evolution with favorable gross and EBIT margins, but revenue growth is slightly unfavorable recently. Its profitability is moderate, with a neutral ROE of 11.3%, while debt levels and liquidity ratios appear neutral to unfavorable. The company holds a very favorable rating despite some unfavorable financial ratios and is currently shedding value with declining ROIC.
Xylem Inc. (XYL) demonstrates strong income growth, including revenue and net income, with consistently favorable margins. Profitability ratios are less robust than EMR’s, with an unfavorable ROE of 8.36%, but the company maintains favorable debt ratios and liquidity. XYL’s rating is very favorable overall, supported by a slightly unfavorable moat due to shedding value but with improving profitability.
For investors, EMR might appear more attractive for those prioritizing stable ratings and current profitability despite value erosion, while XYL could be seen as suitable for those favoring growth and improving returns amid moderate financial risk. The choice might depend on whether the investor values current financial stability or growth potential with improving profitability.
Disclaimer: Investment carries a risk of loss of initial capital. The past performance is not a reliable indicator of future results. Be sure to understand risks before making an investment decision.
Go Further
I encourage you to read the complete analyses of Emerson Electric Co. and Xylem Inc. to enhance your investment decisions: