In today’s rapidly evolving industrial machinery sector, Emerson Electric Co. and Symbotic Inc. stand out for their innovative approaches to automation and efficiency. Emerson, a century-old giant, serves diverse global markets with broad engineering solutions, while Symbotic, a younger company, focuses on cutting-edge warehouse robotics. Their shared industry and distinct strategies make this comparison essential for investors seeking growth balanced with stability. Let’s explore which company offers the most compelling investment opportunity.
Table of contents
Companies Overview
I will begin the comparison between Emerson Electric Co. and Symbotic Inc. by providing an overview of these two companies and their main differences.
Emerson Electric Co. Overview
Emerson Electric Co. is a technology and engineering company serving industrial, commercial, and residential markets globally. Operating through Automation Solutions and Commercial & Residential Solutions segments, it delivers instrumentation, process control software, HVAC products, and environmental control systems. With a broad market presence, Emerson targets industries like oil and gas, power generation, and food and beverage, leveraging a workforce of 73K employees from its headquarters in Saint Louis, Missouri.
Symbotic Inc. Overview
Symbotic Inc. specializes in automation technology focused on improving efficiency for U.S. retailers and wholesalers. Its core offering, the Symbotic System, is a comprehensive warehouse automation solution designed to reduce costs and optimize inventory management. Founded recently and headquartered in Wilmington, Massachusetts, Symbotic employs about 1.6K people and operates primarily in the industrial machinery sector, emphasizing robotics and technology for logistics.
Key similarities and differences
Both Emerson and Symbotic operate in the industrial machinery sector and focus on automation technologies. Emerson has a more diversified portfolio spanning several industries and global markets, while Symbotic concentrates on warehouse automation for retail and wholesale clients in the U.S. Emerson’s large scale and extensive product range contrast with Symbotic’s niche specialization and smaller workforce, reflecting distinct business models within industrial automation.
Income Statement Comparison
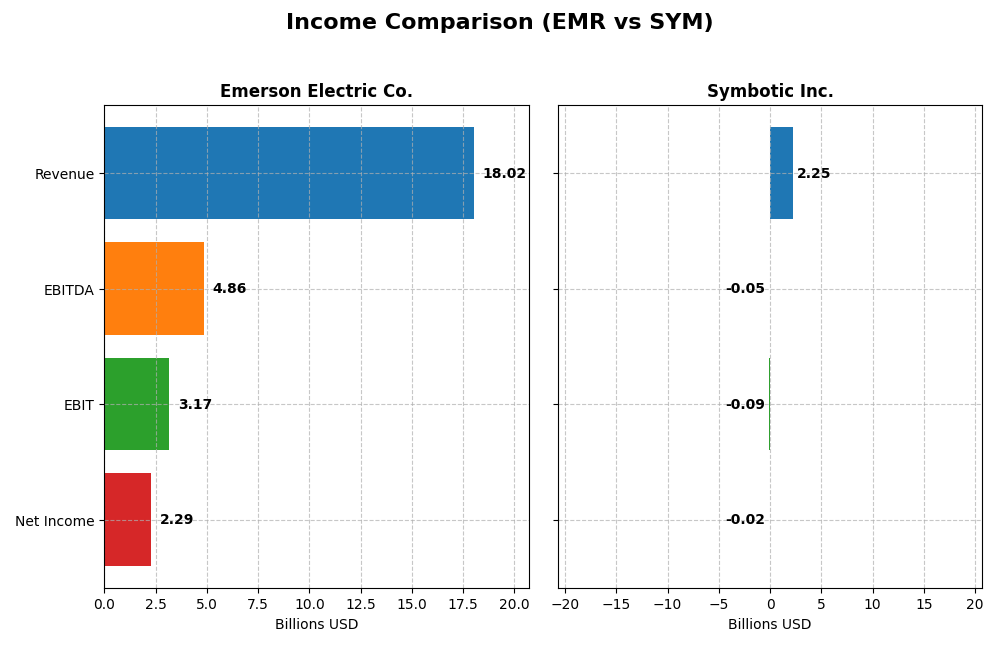
The table below compares the key income statement metrics for Emerson Electric Co. and Symbotic Inc. for the fiscal year 2025, highlighting differences in revenue, profitability, and earnings per share.
| Metric | Emerson Electric Co. | Symbotic Inc. |
|---|---|---|
| Market Cap | 81B | 43B |
| Revenue | 18.0B | 2.25B |
| EBITDA | 4.86B | -48M |
| EBIT | 3.17B | -92M |
| Net Income | 2.29B | -17M |
| EPS | 4.06 | -0.16 |
| Fiscal Year | 2025 | 2025 |
Income Statement Interpretations
Emerson Electric Co.
Over the 2021-2025 period, Emerson Electric Co. showed steady revenue growth of 39.3%, while net income slightly declined by 0.43%. Margins remain robust, with gross margin at 52.8% and net margin at 12.7%, both favorable. In 2025, revenue growth slowed to 3.0%, but improvements in EBIT and net margin indicate better profitability and operational efficiency.
Symbotic Inc.
Symbotic Inc. experienced rapid revenue growth of 792% from 2021 to 2025, accompanied by an 86% increase in net income. However, margins remain weak with a negative EBIT margin of -4.1% and a net margin of -0.75%, signaling ongoing profitability challenges. In 2025, revenue and gross profit rose strongly, but EBIT declined 10.6%, reflecting elevated operating expenses.
Which one has the stronger fundamentals?
Emerson Electric displays stronger fundamentals with stable high margins, positive net income, and efficient cost management despite slower revenue growth. Symbotic shows impressive top-line expansion and improving net income but faces persistent negative operating margins and net losses. Consequently, Emerson’s income statement metrics reflect more consistent and favorable financial health.
Financial Ratios Comparison
The table below presents a side-by-side comparison of key financial ratios for Emerson Electric Co. (EMR) and Symbotic Inc. (SYM), based on their most recent full fiscal year data for 2025.
| Ratios | Emerson Electric Co. (EMR) | Symbotic Inc. (SYM) |
|---|---|---|
| ROE | 11.30% | -7.65% |
| ROIC | 4.62% | -16.63% |
| P/E | 32.42 | -334.54 |
| P/B | 3.66 | 25.60 |
| Current Ratio | 0.88 | 1.08 |
| Quick Ratio | 0.65 | 0.99 |
| D/E | 0.65 | 0.14 |
| Debt-to-Assets | 31.26% | 1.32% |
| Interest Coverage | 9.44 | 0 |
| Asset Turnover | 0.43 | 0.94 |
| Fixed Asset Turnover | 6.28 | 15.92 |
| Payout ratio | 52.0% | 0% |
| Dividend yield | 1.60% | 0% |
Interpretation of the Ratios
Emerson Electric Co.
Emerson Electric shows a mixed ratio profile with favorable net margin (12.73%) and interest coverage (13.38), but weaker returns on invested capital (4.62%) and asset turnover (0.43). Its liquidity ratios are below 1, indicating potential short-term solvency concerns. Dividend yield stands at 1.6%, supported by steady payouts and moderate shareholder returns, reflecting a balanced capital return policy with manageable risks.
Symbotic Inc.
Symbotic presents predominantly unfavorable profitability ratios, including negative net margin (-0.75%), ROE (-7.65%), and ROIC (-16.63%), alongside a high weighted average cost of capital (13.8%). The company does not pay dividends, consistent with its negative earnings and reinvestment focus in R&D and growth. Debt metrics are favorable, but interest coverage is zero, signaling financial stress in interest servicing.
Which one has the best ratios?
Both Emerson Electric and Symbotic have slightly unfavorable overall ratio profiles. Emerson’s strengths in profitability and interest coverage contrast with its liquidity weaknesses. Symbotic faces significant profitability and financial coverage challenges but benefits from low leverage. Neither demonstrates a clearly superior ratio set, reflecting distinct operational and financial profiles in their sector.
Strategic Positioning
This section compares the strategic positioning of Emerson Electric Co. and Symbotic Inc., focusing on Market position, Key segments, and Exposure to technological disruption:
Emerson Electric Co.
- Large market cap of 81B, facing competitive pressure in industrial machinery.
- Diversified segments: Automation Solutions, Commercial & Residential Solutions, serving multiple industries globally.
- Moderate exposure through automation and control software; legacy industrial base.
Symbotic Inc.
- Mid-size market cap of 43B, operating in niche warehouse automation market.
- Concentrated on warehouse automation systems and services for US retailers and wholesalers.
- High exposure as a robotics and technology provider innovating warehouse efficiency.
Emerson Electric Co. vs Symbotic Inc. Positioning
Emerson adopts a diversified approach across multiple industrial and commercial segments worldwide, offering stability but facing broad market competition. Symbotic’s concentrated focus on warehouse automation provides specialization but limits market breadth and scale.
Which has the best competitive advantage?
Both companies exhibit very unfavorable MOAT evaluations with declining ROIC trends, indicating value destruction and limited sustainable competitive advantage based on recent capital efficiency metrics.
Stock Comparison
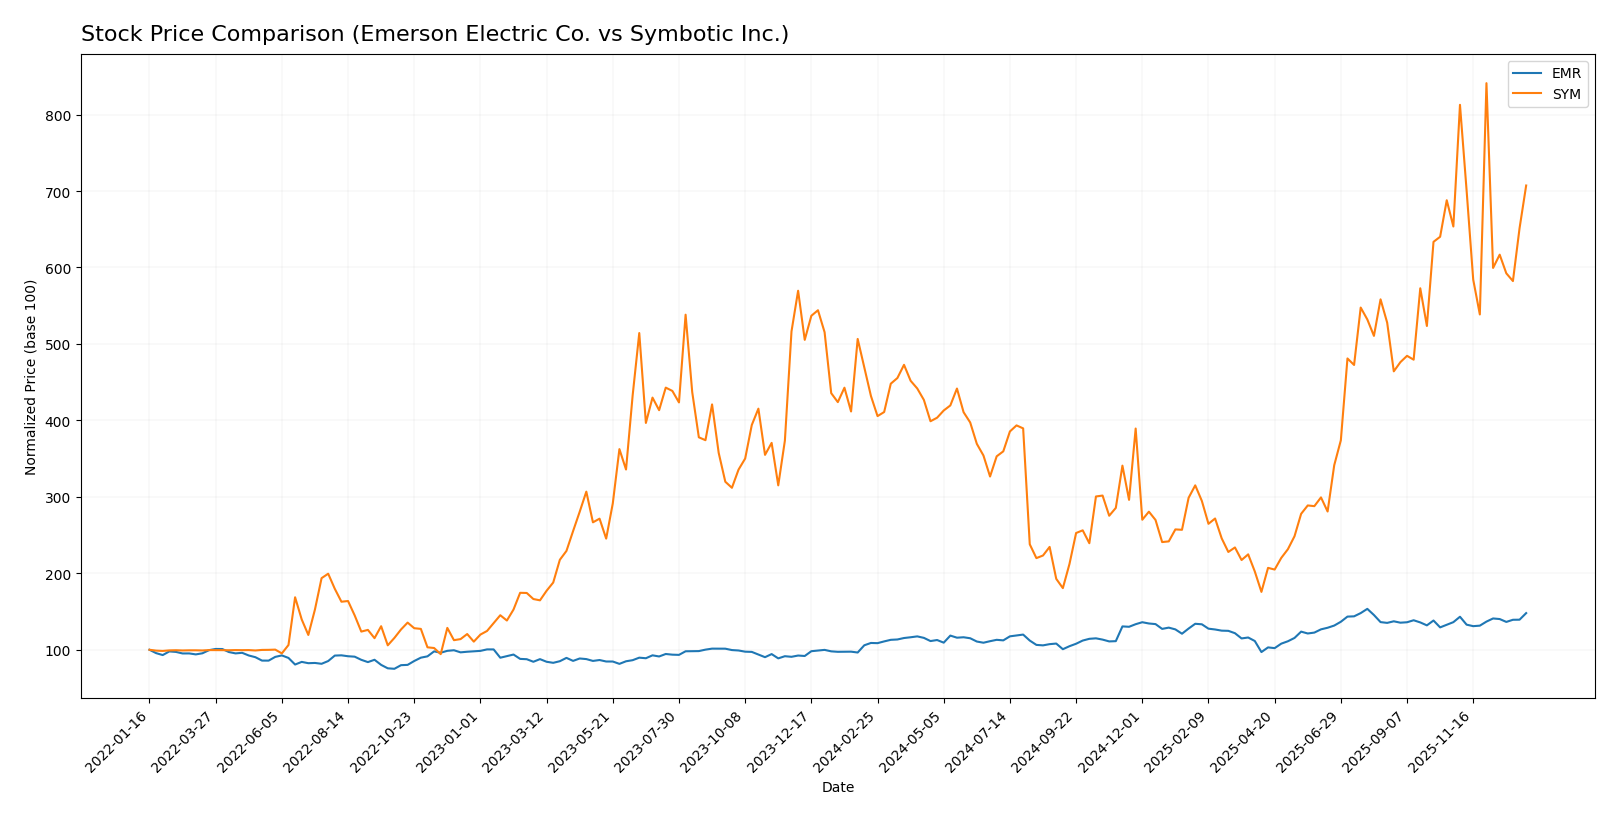
The stock price chart highlights significant bullish trends for both Emerson Electric Co. and Symbotic Inc. over the past 12 months, reflecting strong upward momentum with contrasting acceleration patterns and recent trading dynamics.
Trend Analysis
Emerson Electric Co. (EMR) exhibited a 35.86% price increase over the past year, indicating a bullish trend with accelerating momentum. The stock reached a high of 149.63 and maintained a relatively moderate volatility with a standard deviation of 12.39.
Symbotic Inc. (SYM) showed a stronger 63.7% price increase over the same period, confirming a bullish trend but with deceleration in momentum. The stock experienced higher volatility, reflected by a standard deviation of 15.14, and a peak price of 83.77.
Comparing both, Symbotic Inc. delivered the highest market performance with a 63.7% gain versus Emerson’s 35.86%, despite a recent deceleration in trend acceleration.
Target Prices
The consensus target prices indicate moderate upside potential for both Emerson Electric Co. and Symbotic Inc.
| Company | Target High | Target Low | Consensus |
|---|---|---|---|
| Emerson Electric Co. | 170 | 125 | 149.67 |
| Symbotic Inc. | 83 | 41 | 65.11 |
Analysts expect Emerson Electric’s price to slightly exceed its current 144.19 USD, while Symbotic’s consensus target is below its current 70.85 USD, suggesting mixed expectations.
Analyst Opinions Comparison
This section compares analysts’ ratings and grades for Emerson Electric Co. and Symbotic Inc.:
Rating Comparison
EMR Rating
- Rating: B, considered very favorable by analysts.
- Discounted Cash Flow Score: 3, a moderate assessment of valuation based on future cash flows.
- ROE Score: 3, moderate efficiency in generating profit from shareholders’ equity.
- ROA Score: 4, favorable use of assets to generate earnings.
- Debt To Equity Score: 2, moderate financial risk with some reliance on debt.
- Overall Score: 3, moderate overall financial standing.
SYM Rating
- Rating: C+, also considered very favorable by analysts.
- Discounted Cash Flow Score: 5, very favorable, indicating strong future cash flow projections.
- ROE Score: 1, very unfavorable, showing poor profit generation efficiency.
- ROA Score: 1, very unfavorable, indicating weak asset utilization for earnings.
- Debt To Equity Score: 3, moderate financial risk but slightly higher than EMR’s score.
- Overall Score: 2, moderate but lower overall financial standing compared to EMR.
Which one is the best rated?
Based on the provided data, EMR holds a higher overall rating and better scores in ROE, ROA, and overall financial standing. SYM has a stronger discounted cash flow score but weaker profitability and asset utilization metrics. EMR is better rated overall.
Scores Comparison
Here is a comparison of the Altman Z-Score and Piotroski Score for Emerson Electric Co. and Symbotic Inc.:
EMR Scores
- Altman Z-Score: 2.68, in the grey zone indicating moderate bankruptcy risk.
- Piotroski Score: 7, considered strong financial health.
SYM Scores
- Altman Z-Score: 13.05, in the safe zone indicating low bankruptcy risk.
- Piotroski Score: 3, considered very weak financial health.
Which company has the best scores?
Symbotic Inc. has a significantly higher Altman Z-Score, indicating stronger bankruptcy safety, but a much lower Piotroski Score compared to Emerson Electric Co. Each company shows strengths in different financial measures.
Grades Comparison
The following presents a comparison of recent grades assigned to Emerson Electric Co. and Symbotic Inc.:
Emerson Electric Co. Grades
Here are the recent grades and rating actions from major financial institutions for Emerson Electric Co.:
| Grading Company | Action | New Grade | Date |
|---|---|---|---|
| Wells Fargo | Maintain | Equal Weight | 2026-01-07 |
| Barclays | Maintain | Equal Weight | 2026-01-07 |
| UBS | Upgrade | Buy | 2026-01-05 |
| Jefferies | Downgrade | Hold | 2025-12-10 |
| JP Morgan | Maintain | Neutral | 2025-11-10 |
| RBC Capital | Maintain | Outperform | 2025-11-06 |
| Barclays | Maintain | Equal Weight | 2025-11-06 |
| RBC Capital | Maintain | Outperform | 2025-10-16 |
| JP Morgan | Maintain | Neutral | 2025-10-15 |
| Wells Fargo | Downgrade | Equal Weight | 2025-10-06 |
Emerson Electric Co. shows a broadly neutral to moderately positive trend, with multiple “Equal Weight” and “Neutral” grades, alongside several “Outperform” and “Buy” ratings.
Symbotic Inc. Grades
Below are the recent grades and rating actions from financial institutions for Symbotic Inc.:
| Grading Company | Action | New Grade | Date |
|---|---|---|---|
| Goldman Sachs | Downgrade | Sell | 2025-12-02 |
| Barclays | Maintain | Underweight | 2025-11-26 |
| Baird | Maintain | Neutral | 2025-11-26 |
| Craig-Hallum | Upgrade | Buy | 2025-11-25 |
| Northland Capital | Maintain | Outperform | 2025-11-25 |
| Needham | Maintain | Buy | 2025-11-25 |
| Cantor Fitzgerald | Maintain | Overweight | 2025-11-25 |
| DA Davidson | Maintain | Neutral | 2025-11-25 |
| Citigroup | Maintain | Buy | 2025-11-25 |
| UBS | Downgrade | Sell | 2025-09-23 |
Symbotic Inc.’s grades reveal a mixed pattern, with several “Buy” and “Outperform” ratings contrasted by recent downgrades to “Sell” and persistent “Neutral” or “Underweight” positions.
Which company has the best grades?
Emerson Electric Co. generally holds steadier and more consistent moderate-to-positive ratings compared to Symbotic Inc., which exhibits greater volatility in grades. This suggests Emerson Electric Co. may be viewed as a more stable option by analysts, while Symbotic’s mixed ratings could imply higher risk and uncertainty for investors.
Strengths and Weaknesses
Below is a comparative overview of key strengths and weaknesses for Emerson Electric Co. (EMR) and Symbotic Inc. (SYM) based on the latest financial and operational data.
| Criterion | Emerson Electric Co. (EMR) | Symbotic Inc. (SYM) |
|---|---|---|
| Diversification | Highly diversified with Automation, Climate Technologies, Intelligent Devices, and Software segments generating multi-billion revenues. | Less diversified, focused mainly on Systems and Operation Services with smaller revenue base (~2.2B total). |
| Profitability | Moderate profitability: net margin 12.7%, ROE 11.3%, but ROIC (4.6%) below WACC (8.8%), indicating value erosion. | Negative profitability: net margin -0.75%, ROE -7.65%, and ROIC strongly negative (-16.6%), value destroying. |
| Innovation | Investment in software and control systems growing, but ROIC trend declining, suggesting innovation impact is limited. | Strong fixed asset turnover (15.9) hints at operational efficiency, but overall declining ROIC and negative earnings limit innovation benefits. |
| Global presence | Established global footprint with significant sales in multiple industrial sectors. | Smaller scale, likely more regional with focus on automation and robotics in supply chains. |
| Market Share | Strong presence in industrial automation and control markets with revenues above $18B in 2025. | Emerging player in robotics and automation with revenues just over $2.1B in 2025, smaller market share. |
In summary, Emerson Electric demonstrates broad diversification and solid profitability metrics but faces challenges with declining ROIC and value destruction over recent years. Symbotic, while operationally efficient in asset use, struggles with negative profitability and a less diversified revenue base, signaling higher investment risk. Both companies require cautious evaluation given their unfavorable ROIC trends.
Risk Analysis
The table below summarizes key risks for Emerson Electric Co. (EMR) and Symbotic Inc. (SYM) based on recent financial and operational data for 2025.
| Metric | Emerson Electric Co. (EMR) | Symbotic Inc. (SYM) |
|---|---|---|
| Market Risk | Moderate (Beta: 1.25) | High (Beta: 2.14) |
| Debt level | Moderate (D/E: 0.65, neutral) | Low (D/E: 0.14, favorable) |
| Regulatory Risk | Moderate (Global industrial presence) | Moderate (US-focused automation) |
| Operational Risk | Moderate (Legacy and innovation balance) | High (R&D intensive, scale-up phase) |
| Environmental Risk | Moderate (Industrial emissions controls) | Moderate (Tech hardware manufacturing) |
| Geopolitical Risk | Moderate (Global markets exposure) | Low (Primarily US operations) |
Emerson faces moderate market and operational risks due to its global industrial footprint and legacy system transitions, while Symbotic’s higher beta and operational scaling present elevated market and operational risks. Symbotic’s low debt reduces financial risk but its unfavorable profitability metrics indicate caution.
Which Stock to Choose?
Emerson Electric Co. (EMR) shows a generally favorable income statement with a 12.73% net margin and solid EBIT margin growth, though revenue growth is moderate. Financial ratios reveal mixed signals: strong interest coverage but low liquidity ratios and a slightly unfavorable ROIC. Its rating is very favorable with a “B” grade, supported by a strong Altman Z-Score in the grey zone and a solid Piotroski score.
Symbotic Inc. (SYM) presents favorable income growth metrics overall but suffers from negative profitability and returns, with a -0.75% net margin and negative ROE and ROIC. Financial ratios are largely unfavorable, except for low debt levels and a high PE score. It holds a very favorable rating with a “C+” grade but shows a safe zone Altman Z-Score paired with a weak Piotroski score, indicating financial instability.
For investors, EMR might appear more suitable for those prioritizing stable profitability and moderate risk given its consistent income performance and balanced rating. Conversely, SYM could be of interest to risk-tolerant investors focused on growth potential despite profitability challenges and declining returns, as indicated by its financial profile and rating. Both companies exhibit slightly unfavorable financial ratios and very unfavorable moat evaluations signaling value destruction.
Disclaimer: Investment carries a risk of loss of initial capital. The past performance is not a reliable indicator of future results. Be sure to understand risks before making an investment decision.
Go Further
I encourage you to read the complete analyses of Emerson Electric Co. and Symbotic Inc. to enhance your investment decisions: