Home > Comparison > Industrials > EMR vs ROP
The strategic rivalry between Emerson Electric Co. and Roper Technologies, Inc. shapes the industrial machinery landscape. Emerson operates as a capital-intensive industrial stalwart with diversified automation and commercial solutions. In contrast, Roper excels as a high-margin software and engineered products provider with strong niche positioning. This analysis will assess which business model delivers superior risk-adjusted returns amid evolving industrial demands, guiding investors toward the most resilient portfolio allocation.
Table of contents
Companies Overview
Emerson Electric Co. and Roper Technologies, Inc. stand as key industrial players with distinct market impacts and strategic approaches.
Emerson Electric Co.: Industrial Automation Powerhouse
Emerson Electric Co. dominates the industrial machinery sector with a focus on automation solutions and commercial/residential systems. It generates revenue through instrumentation, valves, and process control software serving diverse markets, including oil and gas and life sciences. In 2026, Emerson prioritizes technological innovation and integrated facility services to enhance energy efficiency and operational reliability.
Roper Technologies, Inc.: Software-Driven Industrial Innovator
Roper Technologies excels as a designer of software and engineered products across multiple industries. Its revenue streams rely on cloud-based management software, diagnostic tools, and precision instruments for healthcare, insurance, and utilities. The company’s 2026 strategy centers on expanding cloud analytics and automation solutions to strengthen recurring revenue and customer retention.
Strategic Collision: Similarities & Divergences
Both companies operate in industrial machinery but differ fundamentally: Emerson emphasizes hardware-driven automation with a broad market reach, while Roper leverages software and cloud technology to disrupt traditional industrial applications. Their main battleground is industrial digital transformation, where Emerson competes on integrated solutions and Roper on scalable software platforms. Investors face contrasting profiles: Emerson offers industrial scale and stability, while Roper provides growth via software innovation.
Income Statement Comparison
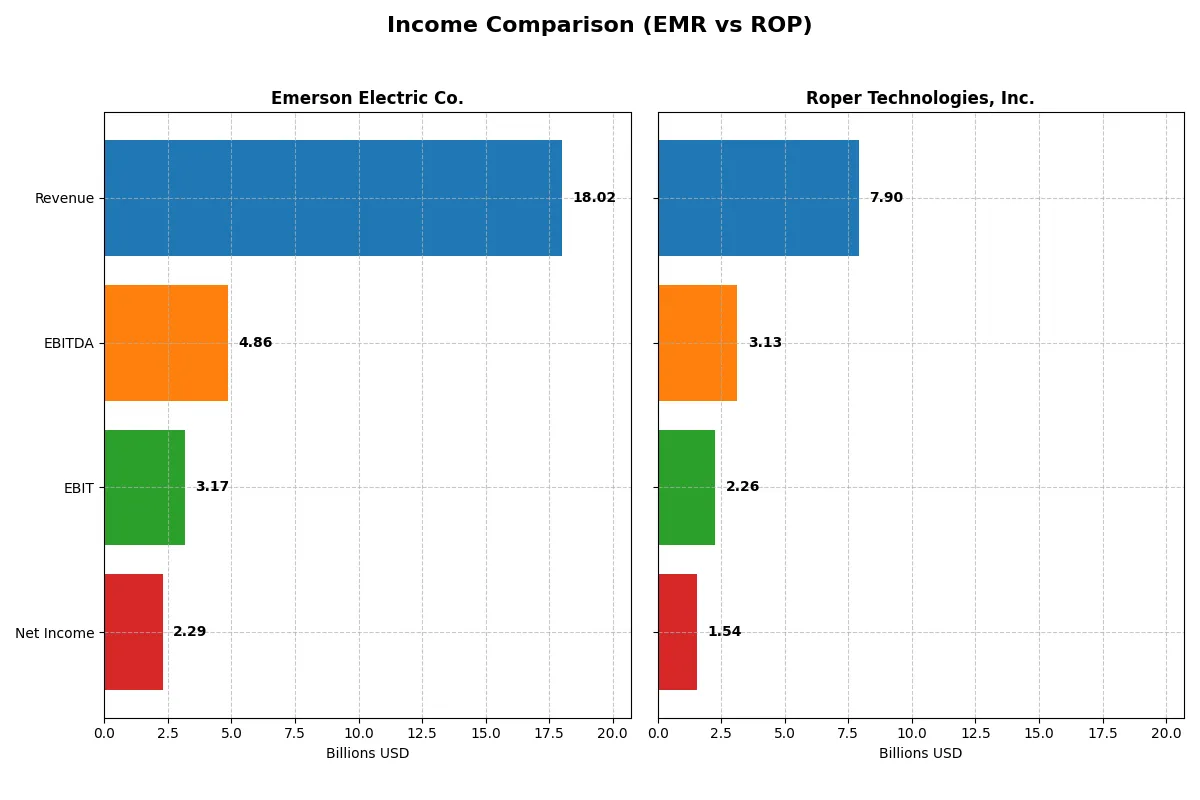
The following data dissects the core profitability and scalability of both corporate engines to reveal who dominates the bottom line:
| Metric | Emerson Electric Co. (EMR) | Roper Technologies, Inc. (ROP) |
|---|---|---|
| Revenue | 18.0B | 7.9B |
| Cost of Revenue | 8.5B | 2.4B |
| Operating Expenses | 7.3B | 3.2B |
| Gross Profit | 9.5B | 5.5B |
| EBITDA | 4.9B | 3.1B |
| EBIT | 3.2B | 2.3B |
| Interest Expense | 237M | 325M |
| Net Income | 2.3B | 1.5B |
| EPS | 4.06 | 14.31 |
| Fiscal Year | 2025 | 2025 |
Income Statement Analysis: The Bottom-Line Duel
This income statement comparison reveals which company converts revenue into profits with superior efficiency and margin stability.
Emerson Electric Co. Analysis
Emerson’s revenue rose steadily from $12.9B in 2021 to $18.0B in 2025, showing solid top-line growth of 39%. Net income fluctuated, peaking unusually in 2023 due to discontinued operations but settling at $2.3B in 2025. Gross margins remain healthy around 53%, and net margins improved to 12.7%, signaling enhanced cost control and operational leverage in 2025.
Roper Technologies, Inc. Analysis
Roper’s revenue surged 63% over five years, reaching $7.9B in 2025, outpacing Emerson’s growth rate. Net income climbed consistently to $1.5B, supported by a strong 19.4% net margin. Roper boasts superior gross margin at 69%, reflecting premium pricing or efficient operations. Despite a slight net margin dip in 2025, its profitability profile remains robust and steadily improving.
Margin Strength vs. Growth Momentum
Emerson delivers consistent revenue expansion with respectable margins, but its net income volatility and lower margins contrast with Roper’s higher profitability and rapid growth. Roper’s superior margin efficiency and EPS growth mark it as the fundamental winner in operational performance. Investors seeking strong margin profiles may find Roper’s model more attractive for sustained returns.
Financial Ratios Comparison
These vital ratios act as a diagnostic tool to expose the underlying fiscal health, valuation premiums, and capital efficiency of the companies compared below:
| Ratios | Emerson Electric Co. (EMR) | Roper Technologies, Inc. (ROP) |
|---|---|---|
| ROE | 11.3% | N/A |
| ROIC | 4.6% | N/A |
| P/E | 32.4 | 31.1 |
| P/B | 3.67 | N/A |
| Current Ratio | 0.88 | 0 |
| Quick Ratio | 0.65 | 0 |
| D/E | 0.68 | 0 |
| Debt-to-Assets | 32.8% | 0 |
| Interest Coverage | 9.44 | 6.88 |
| Asset Turnover | 0.43 | 0 |
| Fixed Asset Turnover | 5.14 | 0 |
| Payout ratio | 52.0% | 23.1% |
| Dividend yield | 1.60% | 0.74% |
| Fiscal Year | 2025 | 2025 |
Efficiency & Valuation Duel: The Vital Signs
Financial ratios act as a company’s DNA, uncovering hidden risks and operational strengths that shape investor decisions.
Emerson Electric Co.
Emerson shows moderate profitability with an 11.3% ROE and a solid 12.7% net margin, but its valuation is stretched at a 32.4 P/E. The company maintains a 1.6% dividend yield, balancing shareholder returns with reinvestment in operations. However, a low current ratio of 0.88 signals liquidity concerns.
Roper Technologies, Inc.
Roper posts a higher net margin at 19.4% but reports no ROE or ROIC data, clouding profitability assessment. It trades at a slightly lower 31.1 P/E but pays a modest 0.74% dividend yield. Favorable debt ratios contrast with limited liquidity metrics, reflecting mixed operational efficiency.
Premium Valuation vs. Operational Safety
Emerson’s balanced profitability and dividend appeal come with liquidity red flags and stretched valuation. Roper’s higher margin and stronger debt profile are offset by incomplete profitability data and weaker dividends. Emerson suits investors prioritizing steady income; Roper fits those seeking growth with caution over incomplete metrics.
Which one offers the Superior Shareholder Reward?
I see Emerson Electric (EMR) delivers a 1.6% dividend yield with a 52% payout ratio, reflecting strong free cash flow coverage (86%). EMR pairs dividends with moderate buybacks, balancing income and capital return. Roper Technologies (ROP) yields just 0.74% but reinvests heavily in growth, with a lower 23% payout and aggressive buybacks fueling share accretion. Historically, EMR’s steady dividends suit income-focused investors, while ROP’s capital allocation aims for capital gains. In 2026, I judge EMR’s sustainable income plus buybacks offer a superior total return profile for cautious investors seeking reliability.
Comparative Score Analysis: The Strategic Profile
The radar chart reveals the fundamental DNA and trade-offs of Emerson Electric Co. and Roper Technologies, Inc.:
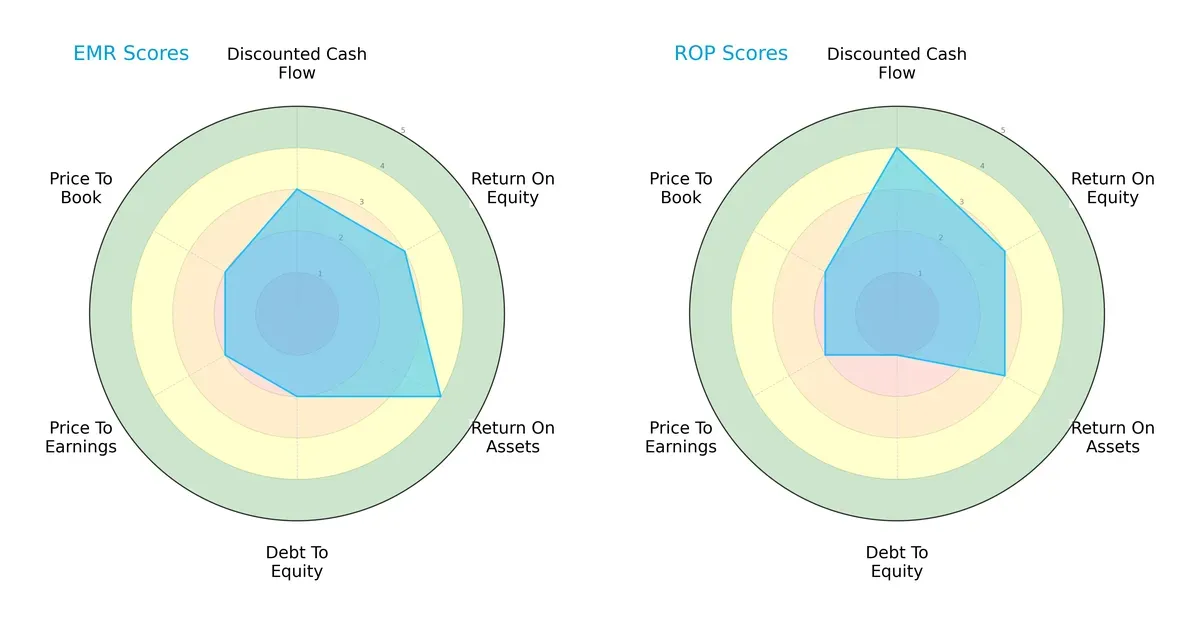
Emerson Electric shows a more balanced profile with moderate DCF, ROE, and ROA scores, though its debt-to-equity and valuation scores are only moderate. Roper excels in discounted cash flow but suffers a very unfavorable debt-to-equity score, indicating higher leverage risk. Emerson relies on steady asset efficiency; Roper leans on cash flow strengths amid leverage concerns.
Bankruptcy Risk: Solvency Showdown
Emerson Electric’s Altman Z-Score of 4.3 places it firmly in the safe zone, while Roper’s 2.7 lands in the grey zone:
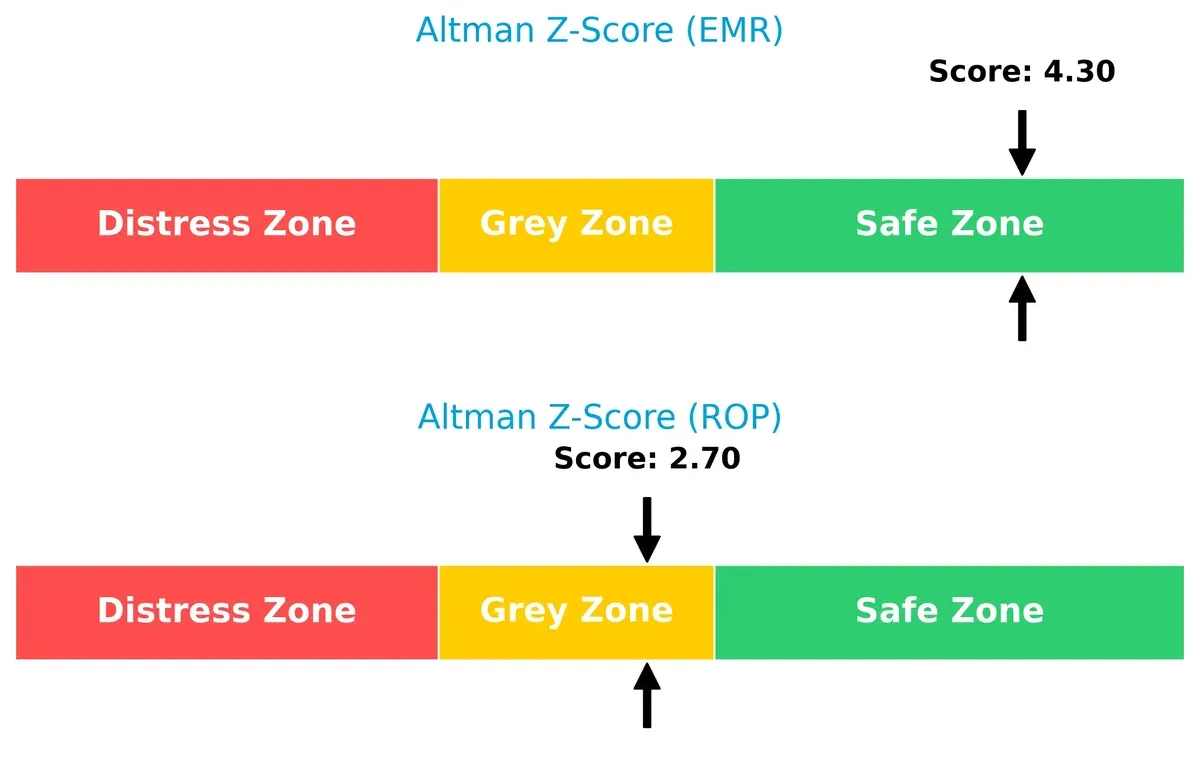
This gap signals Emerson’s stronger solvency and lower bankruptcy risk in this cycle. Roper’s moderate score warns of elevated financial stress under adverse market conditions.
Financial Health: Quality of Operations
Roper’s Piotroski F-Score of 9 outperforms Emerson’s 7, indicating superior financial health and operational quality:
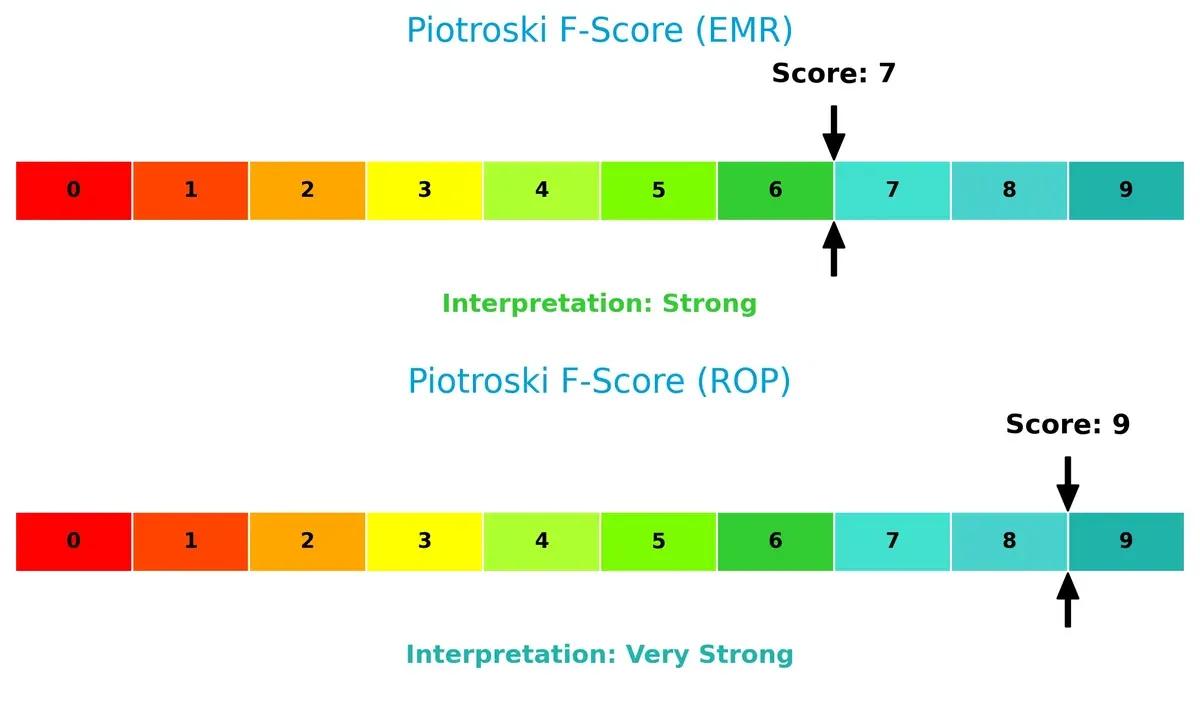
Roper demonstrates peak internal metrics with no red flags, while Emerson, though strong, shows more room for improvement in profitability and efficiency measures.
How are the two companies positioned?
This section dissects the operational DNA of Emerson Electric Co. and Roper Technologies by comparing their revenue distribution and internal dynamics. The objective is to confront their economic moats and identify the more resilient, sustainable competitive advantage today.
Revenue Segmentation: The Strategic Mix
This visual comparison dissects how Emerson Electric Co. and Roper Technologies diversify their income streams and where their primary sector bets lie:
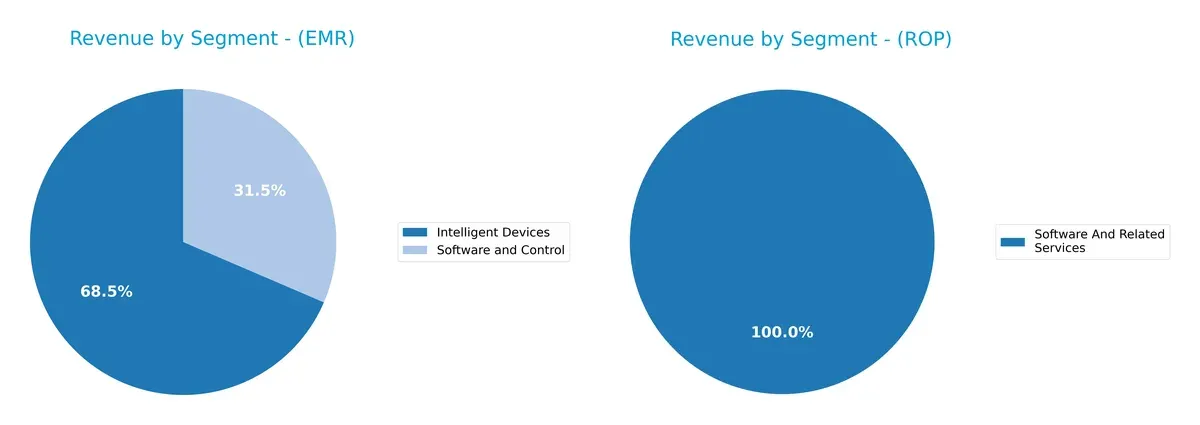
Emerson Electric anchors its revenue in Intelligent Devices with $12.4B, followed by Software and Control at $5.7B, showing moderate diversification. Roper leans heavily on Software and Related Services with $10.7B, but its 2023 data reveals a more balanced spread across Application Software ($3.2B), Network Systems ($1.4B), and Technology Products ($1.6B). Emerson’s focus suggests infrastructure dominance, while Roper pivots toward software ecosystem lock-in, reducing concentration risk.
Strengths and Weaknesses Comparison
This table compares the Strengths and Weaknesses of Emerson Electric Co. and Roper Technologies, Inc.:
Emerson Electric Co. Strengths
- Diversified revenue streams in Intelligent Devices and Software
- Global presence across Americas, Asia, and Europe
- Favorable net margin and interest coverage
- Strong fixed asset turnover
Roper Technologies, Inc. Strengths
- High net margin and favorable debt metrics
- Favorable price-to-book ratio
- Global revenue exposure with strong US base
- Favorable interest coverage
Emerson Electric Co. Weaknesses
- Unfavorable ROIC below WACC indicating weak capital efficiency
- Unfavorable liquidity ratios below 1
- Unfavorable P/E and P/B valuations
- Moderate asset turnover
Roper Technologies, Inc. Weaknesses
- Unavailable or zero key ratios including ROE and ROIC
- Unfavorable current and quick ratios indicating liquidity risk
- Unfavorable asset turnover and dividend yield
- Higher percentage of unfavorable ratios overall
Emerson shows solid diversification and operational efficiency but struggles with capital returns and liquidity. Roper boasts strong profitability and capital structure but faces gaps in key financial disclosures and liquidity metrics. Both companies have global reach but differ in financial health robustness, impacting strategic flexibility.
The Moat Duel: Analyzing Competitive Defensibility
A structural moat is the only protection for long-term profits against relentless competitive erosion in industrial sectors:
Emerson Electric Co.: Operational Scale & Diversification Moat
Emerson’s competitive edge stems from broad industrial diversification and scale economies, reflected in stable 12.7% net margins. However, a declining ROIC signals margin pressure, risking moat erosion by 2026 amid global market shifts.
Roper Technologies, Inc.: Niche Software & Intellectual Property Moat
Roper leverages specialized software and IP-driven solutions, boasting superior 19.4% net margins and rapid revenue growth. Despite unavailable ROIC data, its innovation focus should deepen competitive defensibility amid digital transformation opportunities.
Moat Strength Face-Off: Industrial Scale vs. Software Specialization
Emerson’s wide operational scale contrasts with Roper’s deeper niche moat fueled by software IP. I see Roper better positioned to defend and grow its market share in 2026’s tech-driven industrial landscape.
Which stock offers better returns?
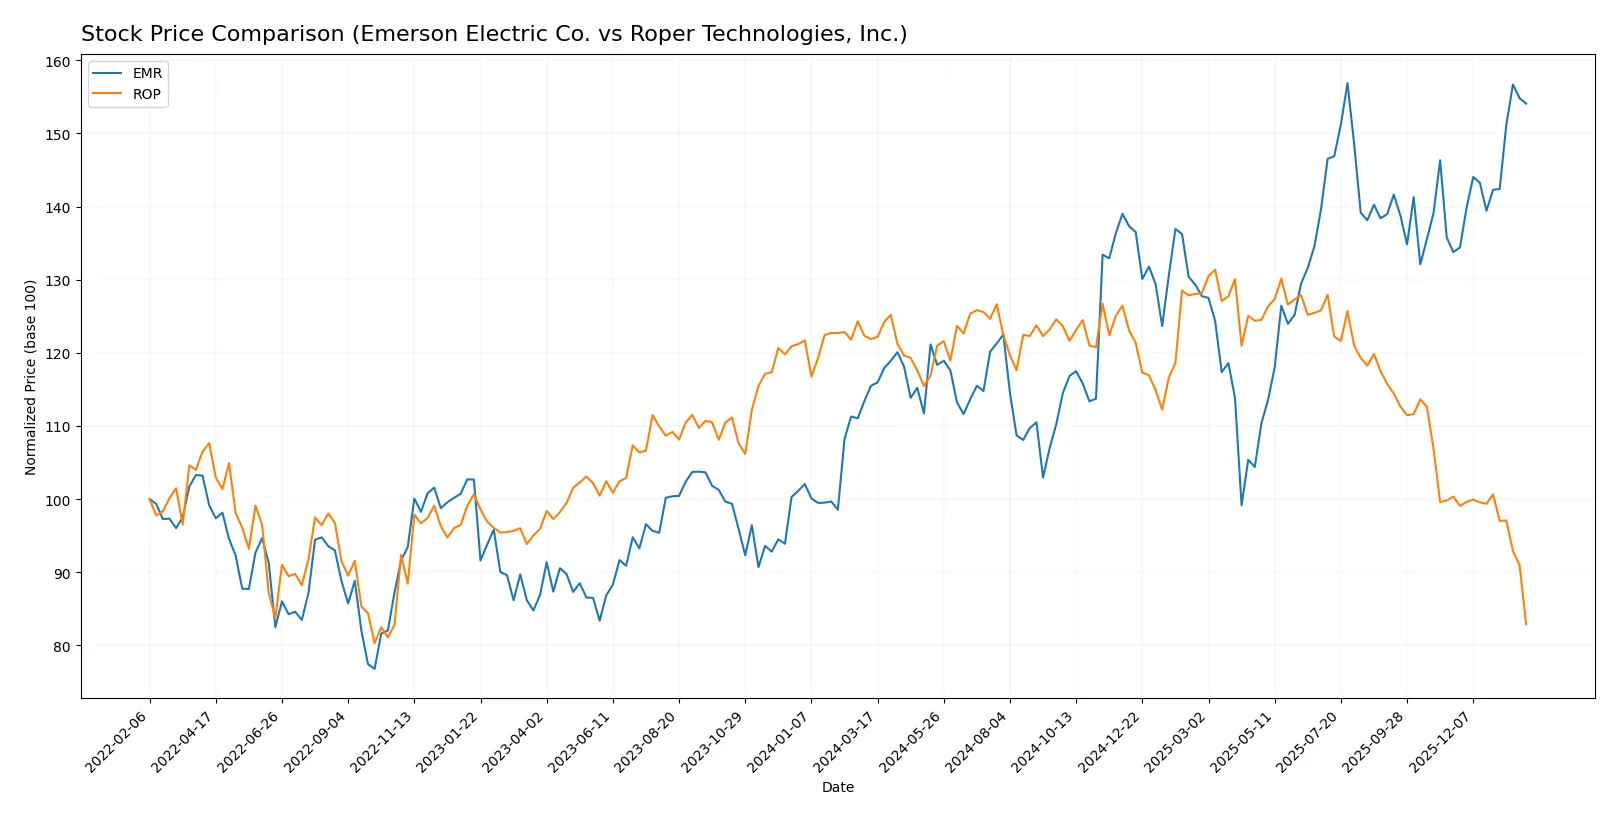
Stock price movements over the past year reveal contrasting dynamics: Emerson Electric Co. shows strong gains with accelerating momentum, while Roper Technologies, Inc. faces a significant decline and deceleration in trend.
Trend Comparison
Emerson Electric Co.’s stock gained 33.42% over the past year, displaying a bullish trend with accelerating momentum and a high near 150. Volatility remains moderate with a standard deviation of 13.03.
Roper Technologies, Inc. declined 32.0% over the same period, marking a bearish trend with deceleration. The stock experienced high volatility, reflected by a standard deviation of 44.8, and a low around 371.
Emerson Electric Co. outperformed Roper Technologies, delivering the highest market return and a clear upward trajectory over the last 12 months.
Target Prices
Analysts present a bullish consensus for Emerson Electric Co. and Roper Technologies, Inc., reflecting confidence in their industrial machinery segments.
| Company | Target Low | Target High | Consensus |
|---|---|---|---|
| Emerson Electric Co. | 125 | 170 | 149.67 |
| Roper Technologies, Inc. | 365 | 575 | 475.5 |
Emerson trades near its consensus target, signaling limited upside; Roper’s target suggests significant growth potential from current levels.

Don’t Let Luck Decide Your Entry Point
Optimize your entry points with our advanced ProRealTime indicators. You’ll get efficient buy signals with precise price targets for maximum performance. Start outperforming now!
How do institutions grade them?
Emerson Electric Co. Grades
The following table summarizes recent analyst grades for Emerson Electric Co.:
| Grading Company | Action | New Grade | Date |
|---|---|---|---|
| Oppenheimer | Downgrade | Perform | 2026-01-27 |
| JP Morgan | Maintain | Neutral | 2026-01-16 |
| Barclays | Maintain | Equal Weight | 2026-01-07 |
| Wells Fargo | Maintain | Equal Weight | 2026-01-07 |
| UBS | Upgrade | Buy | 2026-01-05 |
| Jefferies | Downgrade | Hold | 2025-12-10 |
| JP Morgan | Maintain | Neutral | 2025-11-10 |
| Barclays | Maintain | Equal Weight | 2025-11-06 |
| RBC Capital | Maintain | Outperform | 2025-11-06 |
| RBC Capital | Maintain | Outperform | 2025-10-16 |
Roper Technologies, Inc. Grades
The following table summarizes recent analyst grades for Roper Technologies, Inc.:
| Grading Company | Action | New Grade | Date |
|---|---|---|---|
| Goldman Sachs | Maintain | Neutral | 2026-01-29 |
| Argus Research | Downgrade | Hold | 2026-01-28 |
| Truist Securities | Maintain | Buy | 2026-01-28 |
| Mizuho | Maintain | Underperform | 2026-01-28 |
| Oppenheimer | Downgrade | Perform | 2026-01-28 |
| RBC Capital | Maintain | Sector Perform | 2026-01-28 |
| Barclays | Maintain | Underweight | 2026-01-28 |
| Stifel | Downgrade | Hold | 2026-01-28 |
| Citigroup | Maintain | Buy | 2026-01-28 |
| JP Morgan | Maintain | Underweight | 2026-01-28 |
Which company has the best grades?
Emerson Electric holds more favorable ratings overall, including several Outperform and Buy grades. Roper Technologies shows mixed to cautious sentiment, with multiple Hold and Underperform grades. This disparity may influence investors toward Emerson’s perceived stability and growth prospects.
Risks specific to each company
The following categories highlight critical pressure points and systemic threats facing Emerson Electric Co. and Roper Technologies in the 2026 market environment:
1. Market & Competition
Emerson Electric Co.
- Faces intense competition in industrial machinery with moderate market share pressures.
Roper Technologies, Inc.
- Operates in niche engineered products and software with less direct competition but higher innovation demands.
2. Capital Structure & Debt
Emerson Electric Co.
- Maintains moderate debt (D/E 0.68) with strong interest coverage (13.38), signaling manageable leverage risk.
Roper Technologies, Inc.
- Shows very low reported debt but questionable data; interest coverage moderate (6.96) raising transparency concerns.
3. Stock Volatility
Emerson Electric Co.
- Beta at 1.25 indicates above-market volatility, increasing risk in turbulent markets.
Roper Technologies, Inc.
- Beta under 1 (0.94) suggests lower volatility and relative stability against market swings.
4. Regulatory & Legal
Emerson Electric Co.
- Exposure to global industrial regulations and compliance costs in multiple sectors.
Roper Technologies, Inc.
- Faces complex regulatory environments due to software and medical device segments, increasing compliance risk.
5. Supply Chain & Operations
Emerson Electric Co.
- Global supply chain susceptible to disruptions impacting industrial manufacturing and component availability.
Roper Technologies, Inc.
- Relies on specialized suppliers and technology providers, creating operational vulnerability but with diversification.
6. ESG & Climate Transition
Emerson Electric Co.
- Industrial footprint requires aggressive ESG initiatives to meet evolving climate regulations and investor expectations.
Roper Technologies, Inc.
- Technology focus offers ESG opportunities but potential risks in data privacy and energy consumption of cloud services.
7. Geopolitical Exposure
Emerson Electric Co.
- Broad international presence exposes it to geopolitical tensions and trade policy uncertainties.
Roper Technologies, Inc.
- Primarily US-based but with international sales, facing moderate geopolitical risk mainly through supply chains.
Which company shows a better risk-adjusted profile?
Emerson’s key risk lies in liquidity and valuation pressures, reflected by weak current and quick ratios and an unfavorable P/E and P/B. Roper’s most significant risk is unclear capital structure and weak profitability metrics. Despite Emerson’s liquidity concerns, its Altman Z-Score (4.3) places it safely above bankruptcy risk, while Roper’s (2.7) sits in the grey zone. Emerson’s higher beta signals greater volatility but stronger interest coverage and asset turnover metrics support operational stability. Overall, Emerson Electric shows a marginally better risk-adjusted profile due to clearer capital management and safer financial distress indicators despite valuation challenges.
Final Verdict: Which stock to choose?
Emerson Electric Co. (EMR) shines with its operational resilience and strong cash flow generation. Its superpower lies in maintaining solid profitability despite a challenging macro environment. The key point of vigilance is its weakening return on invested capital, signaling efficiency erosion. EMR suits portfolios seeking steady, income-oriented industrial exposure.
Roper Technologies, Inc. (ROP) benefits from a strategic moat rooted in high-margin, recurring revenue streams bolstered by innovation. It offers a safer balance sheet profile compared to EMR’s weaker liquidity ratios. ROP fits well within GARP portfolios aiming for growth tempered by solid business models, despite recent stock volatility.
If you prioritize consistent cash flow and dividend reliability, Emerson Electric Co. presents a compelling scenario due to its robust income statement and operational discipline. However, if you seek growth with a technological edge and recurring revenues, Roper Technologies offers better stability and strategic moat, albeit at a higher valuation risk.
Disclaimer: Investment carries a risk of loss of initial capital. The past performance is not a reliable indicator of future results. Be sure to understand risks before making an investment decision.
Go Further
I encourage you to read the complete analyses of Emerson Electric Co. and Roper Technologies, Inc. to enhance your investment decisions: