Emerson Electric Co. and Rockwell Automation, Inc. are two leading players in the industrial machinery sector, each driving innovation in automation and control technologies. While Emerson offers broad engineering solutions across multiple markets, Rockwell specializes in industrial automation and digital transformation. This comparison explores their strategies, market positions, and growth prospects to help you identify which company stands out as the more compelling investment opportunity.

Table of contents
Companies Overview
I will begin the comparison between Emerson Electric Co. and Rockwell Automation, Inc. by providing an overview of these two companies and their main differences.
Emerson Electric Co. Overview
Emerson Electric Co. is a technology and engineering company that delivers solutions across industrial, commercial, and residential markets globally. Operating through Automation Solutions and Commercial & Residential Solutions segments, Emerson serves sectors such as oil and gas, power generation, and HVAC systems. Founded in 1890 and headquartered in Saint Louis, Missouri, it holds a strong position in industrial machinery with a market cap of approximately 81B USD.
Rockwell Automation, Inc. Overview
Rockwell Automation, Inc. specializes in industrial automation and digital transformation, serving various discrete, hybrid, and process end markets worldwide. Its operations are divided into Intelligent Devices, Software & Control, and Lifecycle Services segments. Founded in 1903 and based in Milwaukee, Wisconsin, Rockwell Automation has a market cap near 46B USD and focuses heavily on hardware, software, and professional services within industrial automation.
Key similarities and differences
Both Emerson and Rockwell Automation operate within the industrial machinery sector, providing automation-related products and services globally. Emerson’s business is more diversified, including commercial and residential solutions, while Rockwell Automation emphasizes digital transformation and lifecycle services. Emerson employs about 73K people compared to Rockwell’s 27K, reflecting differences in scale and operational focus.
Income Statement Comparison
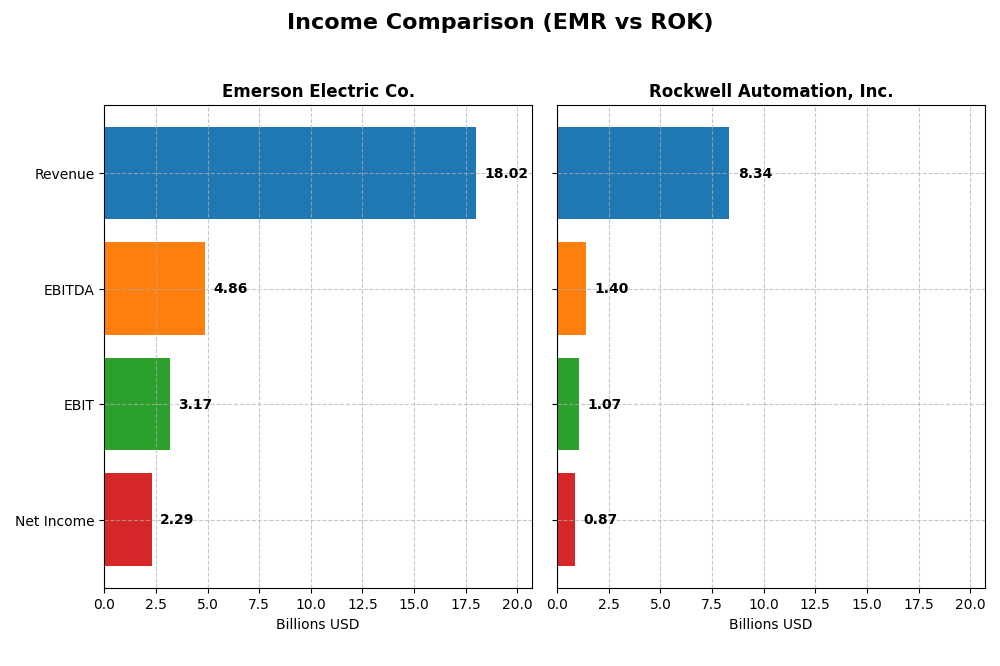
The table below presents a side-by-side comparison of key income statement metrics for Emerson Electric Co. and Rockwell Automation, Inc. for the fiscal year 2025.
| Metric | Emerson Electric Co. | Rockwell Automation, Inc. |
|---|---|---|
| Market Cap | 81.1B | 46.1B |
| Revenue | 18.0B | 8.3B |
| EBITDA | 4.9B | 1.4B |
| EBIT | 3.2B | 1.1B |
| Net Income | 2.3B | 0.87B |
| EPS | 4.06 | 7.69 |
| Fiscal Year | 2025 | 2025 |
Income Statement Interpretations
Emerson Electric Co.
Emerson Electric Co. exhibited a steady revenue increase from $12.9B in 2021 to $18.0B in 2025, reflecting a 39.3% growth over the period. Net income remained roughly flat overall but showed volatility due to discontinued operations, with a net margin contraction of 28.5%. In 2025, revenue growth slowed to 3.0%, yet EBIT and net margin improved significantly, indicating enhanced profitability despite slower top-line expansion.
Rockwell Automation, Inc.
Rockwell Automation’s revenue rose from $7.0B in 2021 to $8.3B in 2025, a 19.2% increase, with net income declining by 36.0% over the same period. Margins showed a downward trend, with net margin shrinking by 46.3%. In 2025, revenue growth was modest at 1.0%, while EBIT and net margin declined, reflecting challenges in maintaining operational efficiency and profitability in the most recent year.
Which one has the stronger fundamentals?
Emerson Electric Co. demonstrates stronger fundamentals, supported by favorable gross, EBIT, interest, and net margin percentages, alongside positive EBIT and net margin growth in the latest year. Conversely, Rockwell Automation’s weaker margin trends, declining profitability, and unfavorable growth indicators suggest more fundamental challenges. Therefore, Emerson’s income statement metrics present a more robust financial profile.
Financial Ratios Comparison
The table below presents a side-by-side comparison of key financial ratios for Emerson Electric Co. (EMR) and Rockwell Automation, Inc. (ROK) based on the most recent fiscal year 2025 data.
| Ratios | Emerson Electric Co. (EMR) | Rockwell Automation, Inc. (ROK) |
|---|---|---|
| ROE | 11.3% | 23.8% |
| ROIC | 4.6% | 13.7% |
| P/E | 32.4 | 45.3 |
| P/B | 3.66 | 10.8 |
| Current Ratio | 0.88 | 1.14 |
| Quick Ratio | 0.65 | 0.77 |
| D/E (Debt-to-Equity) | 0.65 | 1.00 |
| Debt-to-Assets | 31.3% | 32.5% |
| Interest Coverage | 9.44 | 9.12 |
| Asset Turnover | 0.43 | 0.74 |
| Fixed Asset Turnover | 6.28 | 6.95 |
| Payout ratio | 52.0% | 68.0% |
| Dividend yield | 1.60% | 1.50% |
Interpretation of the Ratios
Emerson Electric Co.
Emerson Electric shows a mixed ratio profile with favorable net margin (12.7%) and interest coverage (13.4), but weak liquidity ratios (current ratio 0.88, quick ratio 0.65) and valuation multiples (PE 32.4, PB 3.66) indicating some financial stress and potential overvaluation. The company pays dividends with a neutral yield around 1.6%, suggesting moderate shareholder returns without aggressive payout risks.
Rockwell Automation, Inc.
Rockwell Automation presents stronger profitability metrics with favorable net margin (10.4%), ROE (23.8%), and ROIC (13.7%), but faces challenges in cost of capital (WACC 10.4%) and valuation (PE 45.3, PB 10.8). Liquidity is moderate (current ratio 1.14), though quick ratio is unfavorable (0.77). Dividend yield is neutral at 1.5%, reflecting steady but not excessive shareholder distributions.
Which one has the best ratios?
Rockwell Automation displays a more favorable overall ratio profile, particularly in profitability and capital returns, despite some valuation and liquidity concerns. Emerson Electric’s ratios are slightly unfavorable, weighed down by weaker liquidity and valuation metrics. Thus, Rockwell holds an edge in financial health based on these key ratios.
Strategic Positioning
This section compares the strategic positioning of Emerson Electric Co. and Rockwell Automation, including market position, key segments, and exposure to technological disruption:
Emerson Electric Co.
- Large industrial machinery player with 81B market cap facing moderate competitive pressure.
- Diverse segments: Automation Solutions, Commercial & Residential Solutions driving revenues.
- Exposure to industrial automation and control technologies with broad market applications.
Rockwell Automation, Inc.
- Mid-sized industrial machinery firm with 46B market cap and higher beta, indicating greater volatility.
- Focused on three segments: Intelligent Devices, Software & Control, Lifecycle Services.
- Strong focus on digital transformation and industrial automation software solutions.
Emerson Electric Co. vs Rockwell Automation, Inc. Positioning
Emerson pursues a diversified approach serving industrial, commercial, and residential markets with broad product lines, while Rockwell concentrates on industrial automation and digital solutions, emphasizing software and services. Emerson’s scale contrasts with Rockwell’s more specialized segment focus.
Which has the best competitive advantage?
Rockwell Automation demonstrates a durable competitive advantage with growing profitability and efficient capital use, while Emerson is currently shedding value with declining returns, indicating weaker competitive positioning based on MOAT evaluation.
Stock Comparison
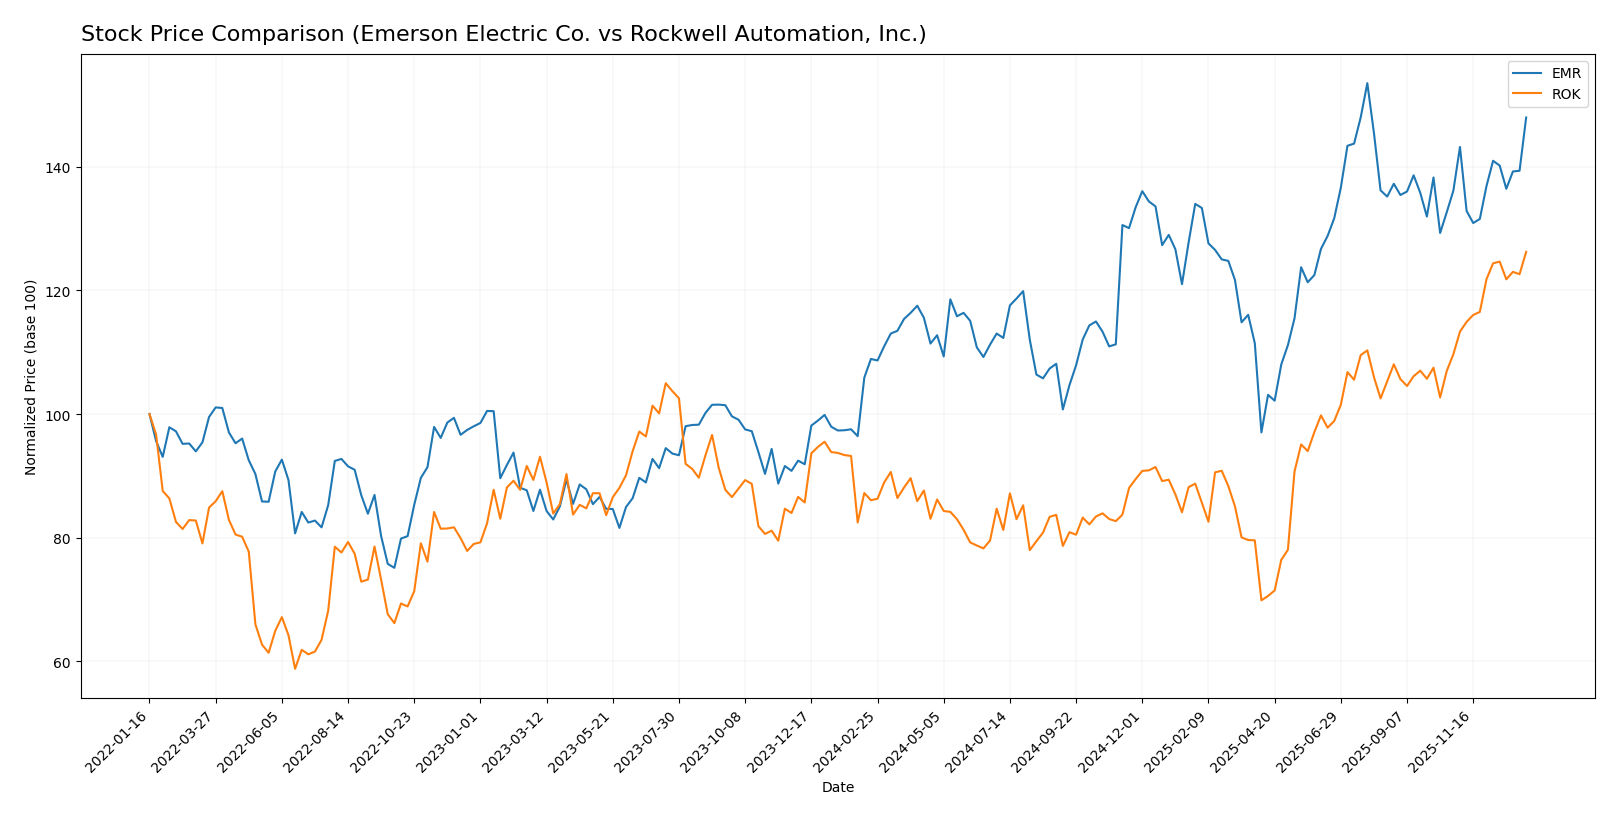
The stock prices of Emerson Electric Co. (EMR) and Rockwell Automation, Inc. (ROK) have shown significant bullish momentum over the past 12 months, with notable acceleration in their upward trends and marked price growth.
Trend Analysis
Emerson Electric Co. exhibited a 35.86% price increase over the past year, indicating a bullish trend with accelerating momentum. The price ranged between 94.57 and 149.63, and the recent quarterly trend shows continued positive slope with moderate volatility.
Rockwell Automation, Inc. recorded a 46.68% price gain over the same period, also reflecting a bullish and accelerating trend. Its price fluctuated between 227.11 and 410.29, with higher volatility and a stronger recent upward slope compared to EMR.
Comparing both stocks, ROK delivered the highest market performance with a 46.68% increase, outperforming EMR’s 35.86% gain during the past 12 months.
Target Prices
The current analyst consensus shows a moderately optimistic outlook for Emerson Electric Co. and Rockwell Automation, Inc.
| Company | Target High | Target Low | Consensus |
|---|---|---|---|
| Emerson Electric Co. | 170 | 125 | 149.67 |
| Rockwell Automation, Inc. | 470 | 380 | 421.57 |
Analysts expect Emerson Electric’s stock to trade slightly above its current price of $144.27, while Rockwell Automation is seen with upside potential above its current price of $410.66.
Analyst Opinions Comparison
This section compares analysts’ ratings and financial scores for Emerson Electric Co. (EMR) and Rockwell Automation, Inc. (ROK):
Rating Comparison
EMR Rating
- Rated B, considered Very Favorable overall.
- Discounted Cash Flow Score of 3, indicating a Moderate valuation.
- Return on Equity Score of 3, reflecting Moderate profitability.
- Return on Assets Score of 4, considered Favorable asset utilization.
- Debt to Equity Score of 2, moderate financial risk.
- Overall Score of 3, a Moderate overall financial standing.
ROK Rating
- Rated B-, also Very Favorable in overall rating.
- Discounted Cash Flow Score of 3, showing Moderate valuation.
- Return on Equity Score of 5, indicating Very Favorable profitability.
- Return on Assets Score of 4, also Favorable asset utilization.
- Debt to Equity Score of 1, indicating Very Unfavorable financial risk.
- Overall Score of 3, also Moderate overall financial standing.
Which one is the best rated?
Both EMR and ROK share a Moderate overall score of 3 and Moderate DCF scores, but ROK outperforms EMR on Return on Equity with a score of 5 versus 3. However, ROK’s debt to equity score of 1 indicates higher financial risk compared to EMR’s score of 2.
Scores Comparison
Here is a comparison of the Altman Z-Score and Piotroski Score for both companies:
EMR Scores
- Altman Z-Score: 2.68, in the grey zone indicating moderate bankruptcy risk.
- Piotroski Score: 7, categorized as strong financial health.
ROK Scores
- Altman Z-Score: 5.32, in the safe zone indicating low bankruptcy risk.
- Piotroski Score: 8, categorized as very strong financial health.
Which company has the best scores?
ROK has higher Altman Z-Score and Piotroski Score values than EMR, indicating stronger financial stability and better overall financial health based on the provided data.
Grades Comparison
Here is a comparison of the recent grades and ratings awarded to Emerson Electric Co. and Rockwell Automation, Inc.:
Emerson Electric Co. Grades
The following table summarizes recent grades from reputable grading companies for Emerson Electric Co.:
| Grading Company | Action | New Grade | Date |
|---|---|---|---|
| Wells Fargo | Maintain | Equal Weight | 2026-01-07 |
| Barclays | Maintain | Equal Weight | 2026-01-07 |
| UBS | Upgrade | Buy | 2026-01-05 |
| Jefferies | Downgrade | Hold | 2025-12-10 |
| JP Morgan | Maintain | Neutral | 2025-11-10 |
| RBC Capital | Maintain | Outperform | 2025-11-06 |
| Barclays | Maintain | Equal Weight | 2025-11-06 |
| RBC Capital | Maintain | Outperform | 2025-10-16 |
| JP Morgan | Maintain | Neutral | 2025-10-15 |
| Wells Fargo | Downgrade | Equal Weight | 2025-10-06 |
Emerson Electric’s grades show a mix of Hold, Equal Weight, Neutral, and Outperform ratings with a slight recent upgrade to Buy by UBS, indicating a generally cautious to moderately positive outlook.
Rockwell Automation, Inc. Grades
The following table summarizes recent grades from reputable grading companies for Rockwell Automation, Inc.:
| Grading Company | Action | New Grade | Date |
|---|---|---|---|
| Wells Fargo | Maintain | Equal Weight | 2026-01-07 |
| Barclays | Maintain | Overweight | 2026-01-07 |
| Goldman Sachs | Upgrade | Neutral | 2025-12-16 |
| Jefferies | Maintain | Buy | 2025-12-10 |
| Citigroup | Maintain | Buy | 2025-12-08 |
| Barclays | Maintain | Overweight | 2025-12-04 |
| Baird | Maintain | Outperform | 2025-11-21 |
| B of A Securities | Maintain | Buy | 2025-11-20 |
| JP Morgan | Maintain | Neutral | 2025-11-11 |
| Morgan Stanley | Maintain | Overweight | 2025-11-10 |
Rockwell Automation’s grades lean towards Buy, Outperform, and Overweight ratings, suggesting a more optimistic analyst sentiment compared to Emerson Electric.
Which company has the best grades?
Rockwell Automation has generally received higher grades, including multiple Buy and Overweight ratings, compared to Emerson Electric’s more mixed ratings centered around Hold and Equal Weight. This difference may influence investors seeking stronger analyst confidence.
Strengths and Weaknesses
Below is a comparative table highlighting the key strengths and weaknesses of Emerson Electric Co. (EMR) and Rockwell Automation, Inc. (ROK) based on the most recent data from 2025.
| Criterion | Emerson Electric Co. (EMR) | Rockwell Automation, Inc. (ROK) |
|---|---|---|
| Diversification | Broad product mix including Intelligent Devices ($12.4B) and Software & Control ($5.7B) | Focused segments: Intelligent Devices ($3.8B), Software & Control ($2.4B), Lifecycle Services ($2.2B) |
| Profitability | Net margin 12.7% (favorable), ROIC 4.6% (unfavorable), declining ROIC trend, slightly unfavorable overall | Net margin 10.4% (favorable), ROIC 13.7% (favorable), growing ROIC trend, slightly favorable overall |
| Innovation | Moderate investment in software and control, but ROIC decline suggests inefficiencies | Strong growth in software and lifecycle services, indicating innovation focus and value creation |
| Global presence | Established global industrial footprint with diverse product lines | Global automation leader with durable competitive advantage and increasing profitability |
| Market Share | Large presence in automation solutions with $12B+ revenue segment | Leading market share in automation and control with balanced product and service revenue |
Key takeaways: Rockwell Automation shows a durable competitive advantage with strong profitability growth and innovation focus, making it a more favorable investment. Emerson Electric, despite its broad diversification and good margins, struggles with declining ROIC and value destruction, warranting cautious consideration.
Risk Analysis
Below is a comparison of key risks for Emerson Electric Co. (EMR) and Rockwell Automation, Inc. (ROK) based on their latest financial and operational data for 2025.
| Metric | Emerson Electric Co. (EMR) | Rockwell Automation, Inc. (ROK) |
|---|---|---|
| Market Risk | Beta 1.25, moderate volatility | Beta 1.52, higher volatility |
| Debt level | Debt/Equity 0.65, moderate | Debt/Equity 1.0, higher leverage |
| Regulatory Risk | Moderate, industrial sector | Moderate, industrial sector |
| Operational Risk | Supply chain complexity, large workforce (73K) | Focus on digital transformation, smaller workforce (27K) |
| Environmental Risk | Exposure to energy and manufacturing sectors | Exposure to eco-industrial and renewable sectors |
| Geopolitical Risk | Global operations, diverse regions | Global operations, diverse regions |
Emerson Electric shows moderate market and debt risks but benefits from favorable interest coverage, suggesting manageable debt service. Rockwell Automation carries higher market volatility and leverage, increasing financial risk. Both face operational risks linked to global supply chains and sector-specific regulatory environments. Rockwell’s stronger Altman Z-score and Piotroski score reflect better financial health despite elevated leverage. Investors should weigh Emerson’s slightly unfavorable financial ratios against Rockwell’s higher risk profile but stronger profitability and financial stability scores.
Which Stock to Choose?
Emerson Electric Co. (EMR) shows a favorable income statement with strong margins and recent growth in EBIT and net margin, though overall net income and ROIC trends are declining. Financial ratios present a slightly unfavorable picture with some weak liquidity metrics but favorable interest coverage and fixed asset turnover. Its rating is very favorable with moderate overall scores.
Rockwell Automation, Inc. (ROK) displays a less favorable income statement marked by declining EBIT, net margin, and EPS over the period despite stable gross margin. Its financial ratios are slightly favorable, supported by strong ROE and ROIC, though challenged by high valuation multiples and mixed liquidity. The rating is very favorable but with notable weaknesses in debt and valuation scores.
For investors prioritizing durable profitability and value creation, ROK’s growing ROIC and favorable financial ratios might appear more attractive. Conversely, those focused on stable income metrics and a moderate rating profile could view EMR’s performance as more consistent despite its value destruction signals. Each stock’s suitability might depend on individual risk tolerance and investment focus.
Disclaimer: Investment carries a risk of loss of initial capital. The past performance is not a reliable indicator of future results. Be sure to understand risks before making an investment decision.
Go Further
I encourage you to read the complete analyses of Emerson Electric Co. and Rockwell Automation, Inc. to enhance your investment decisions: