Home > Comparison > Industrials > EMR vs PNR
The strategic rivalry between Emerson Electric Co. and Pentair plc shapes the industrial machinery sector’s future. Emerson, a broad technology and engineering powerhouse, integrates automation and commercial solutions globally. Pentair focuses on specialized water and fluid management systems with a leaner operational footprint. This analysis pits Emerson’s diversified scale against Pentair’s niche expertise to determine which offers the superior risk-adjusted return for a diversified portfolio in 2026.
Table of contents
Companies Overview
Emerson Electric Co. and Pentair plc command significant stakes in the industrial machinery landscape.
Emerson Electric Co.: Global Industrial Technology Leader
Emerson Electric Co. stands as a global technology and engineering powerhouse in industrial machinery. Its core revenue stems from Automation Solutions and Commercial & Residential Solutions, serving diverse sectors like oil, gas, and power generation. In 2026, Emerson sharpened its strategic focus on expanding automation and control technologies to optimize industrial efficiency worldwide.
Pentair plc: Water Solutions Specialist
Pentair plc specializes in water treatment and fluid management solutions globally. It generates revenue through Consumer Solutions and Industrial & Flow Technologies, offering filtration, pumps, and valves for residential, commercial, and industrial use. In 2026, Pentair emphasized innovation in water filtration and sustainable fluid technologies to enhance water quality and operational reliability.
Strategic Collision: Similarities & Divergences
Both companies operate in industrial machinery but pursue distinct philosophies: Emerson drives broad technological integration across industries, while Pentair narrows in on specialized water and fluid management. Their primary battleground lies in industrial process optimization and environmental control solutions. Emerson’s scale and diversity contrast with Pentair’s focused niche, framing unique risk and growth profiles for investors.
Income Statement Comparison
This detailed data dissects the core profitability and scalability of both corporate engines to reveal who dominates the bottom line:
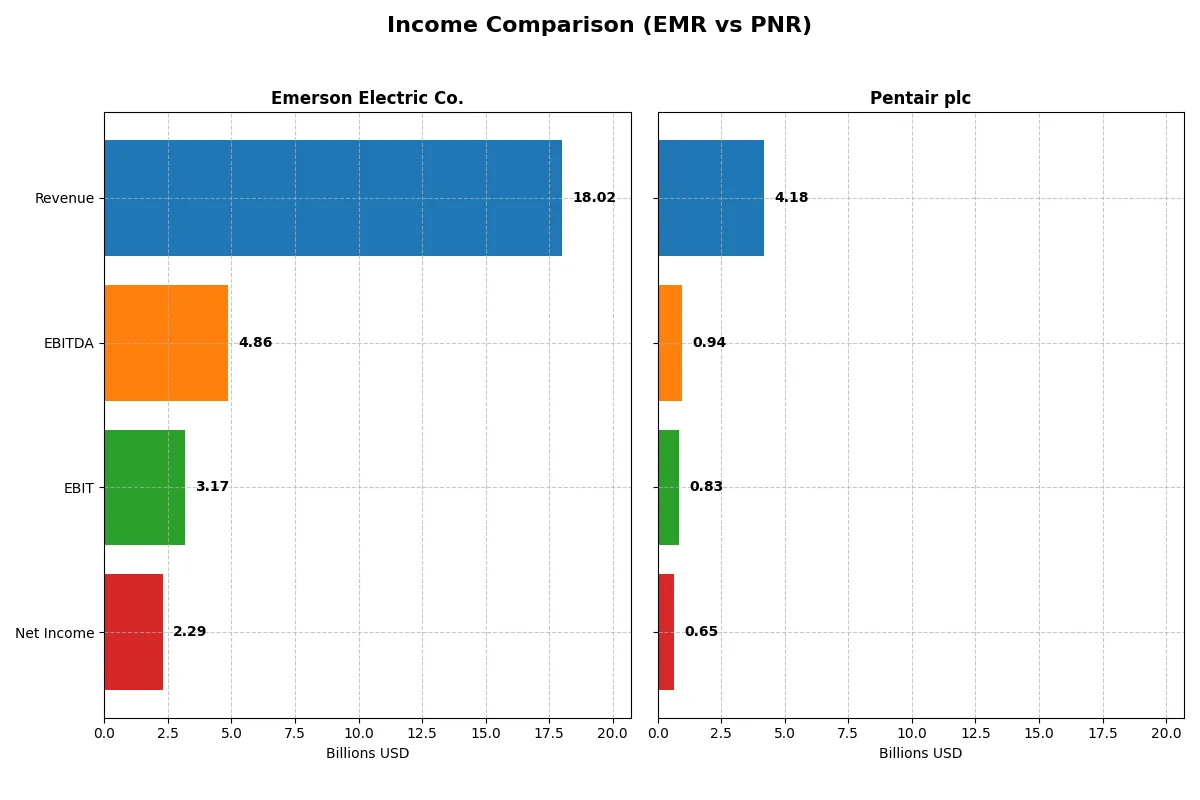
| Metric | Emerson Electric Co. (EMR) | Pentair plc (PNR) |
|---|---|---|
| Revenue | 18.0B | 4.2B |
| Cost of Revenue | 8.5B | 2.5B |
| Operating Expenses | 7.3B | 0.8B |
| Gross Profit | 9.5B | 1.7B |
| EBITDA | 4.9B | 0.9B |
| EBIT | 3.2B | 0.8B |
| Interest Expense | 0.4B | 0.07B |
| Net Income | 2.3B | 0.65B |
| EPS | 4.06 | 3.99 |
| Fiscal Year | 2025 | 2025 |
Income Statement Analysis: The Bottom-Line Duel
The following income statement comparison reveals which company operates with superior efficiency and stronger profitability momentum in their respective markets.
Emerson Electric Co. Analysis
Emerson’s revenue climbed steadily to $18.0B in 2025, reflecting a 3% annual rise, though slightly below ideal growth benchmarks. The company boasts a robust gross margin of 52.8% and a net margin of 12.7%, both favorable and indicative of effective cost control. In 2025, net income surged 17.8% to $2.29B, driven by a 35% jump in EBIT, signaling improving operational efficiency despite slower top-line momentum.
Pentair plc Analysis
Pentair posted $4.18B in revenue for 2025, growing at a moderate 2.3% pace, consistent with sector expectations. Gross margin stands at a solid 40.5%, while the net margin impresses at 15.7%, illustrating strong bottom-line discipline. Net income rose 5.9% to $654M, supported by stable EBIT growth. Pentair’s steady margin expansion and 20% EPS growth over five years reflect disciplined capital allocation and operational stability.
Profitability Strength vs. Growth Momentum
Emerson delivers higher absolute revenue and a superior gross margin, yet faces a flat net income trend over five years. Pentair shows less scale but sustains consistent net income and margin growth. For investors prioritizing margin resilience and earnings momentum, Pentair’s profile appears more attractive. Emerson appeals to those valuing scale with improving efficiency but must address margin contraction risks.
Financial Ratios Comparison
These vital ratios act as a diagnostic tool to expose the underlying fiscal health, valuation premiums, and capital efficiency of the two companies compared below:
| Ratios | Emerson Electric Co. (EMR) | Pentair plc (PNR) |
|---|---|---|
| ROE | 11.31% | 16.90% |
| ROIC | 4.60% | 12.46% |
| P/E | 32.42 | 26.14 |
| P/B | 3.67 | 4.42 |
| Current Ratio | 0.88 | 1.61 |
| Quick Ratio | 0.65 | 0.95 |
| D/E | 0.68 | 0.42 |
| Debt-to-Assets | 32.79% | 23.86% |
| Interest Coverage | 5.78 | 12.36 |
| Asset Turnover | 0.43 | 0.61 |
| Fixed Asset Turnover | 5.14 | 11.08 |
| Payout Ratio | 51.98% | 25.13% |
| Dividend Yield | 1.60% | 0.96% |
| Fiscal Year | 2025 | 2025 |
Efficiency & Valuation Duel: The Vital Signs
Financial ratios serve as a company’s DNA, unveiling hidden risks and operational strengths that inform investor decisions.
Emerson Electric Co.
Emerson Electric shows moderate profitability with an 11.3% ROE and a solid 12.7% net margin. Its valuation appears stretched, trading at a high 32.4 P/E and 3.7 P/B, signaling premium pricing. The company yields a modest 1.6% dividend, reflecting a balanced shareholder return approach amid mixed efficiency ratios.
Pentair plc
Pentair delivers stronger profitability, boasting a 16.9% ROE and a 15.7% net margin. The stock trades at a somewhat lower, yet still elevated, 26.1 P/E and 4.4 P/B. Pentair’s favorable cash flow and debt ratios contrast with a lower 1.0% dividend yield, suggesting a focus on operational efficiency over income distribution.
Valuation Stretch vs. Operational Strength
Pentair offers superior profitability and healthier liquidity, balancing risk and reward better than Emerson Electric. Investors prioritizing growth and operational stability may favor Pentair, while those seeking moderate dividends in a stretched valuation might consider Emerson.
Which one offers the Superior Shareholder Reward?
I observe Emerson Electric (EMR) pays a higher dividend yield of 1.60% with a 52% payout ratio, supported by strong free cash flow coverage (1.91x). Emerson also executes moderate buybacks, enhancing shareholder returns sustainably. Pentair (PNR) yields 0.96% with a conservative 25% payout ratio and robust buyback activity, favoring growth reinvestment. I find Emerson’s balanced dividend with solid cash coverage and steady buybacks offers a superior total return profile for 2026 investors.
Comparative Score Analysis: The Strategic Profile
The radar chart reveals the fundamental DNA and trade-offs of Emerson Electric Co. and Pentair plc, highlighting their core financial strengths and vulnerabilities:
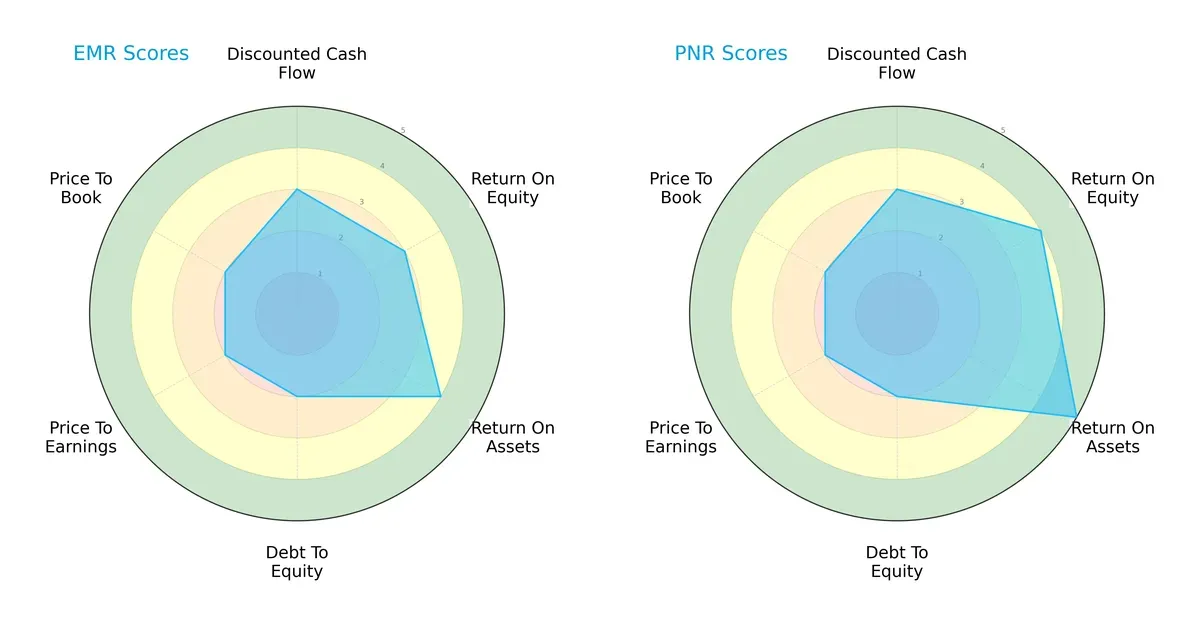
Pentair edges Emerson with stronger profitability metrics, scoring 4 in ROE and 5 in ROA versus Emerson’s 3 and 4. Both share moderate DCF scores of 3 and identical debt-to-equity risk at 2, reflecting balance sheet caution. Emerson lags on valuation metrics (PE/PB scores of 2), mirroring Pentair’s undervaluation signals, but Pentair’s higher returns suggest a more balanced profile. Emerson relies more heavily on asset efficiency, while Pentair combines profitability and asset use more effectively.
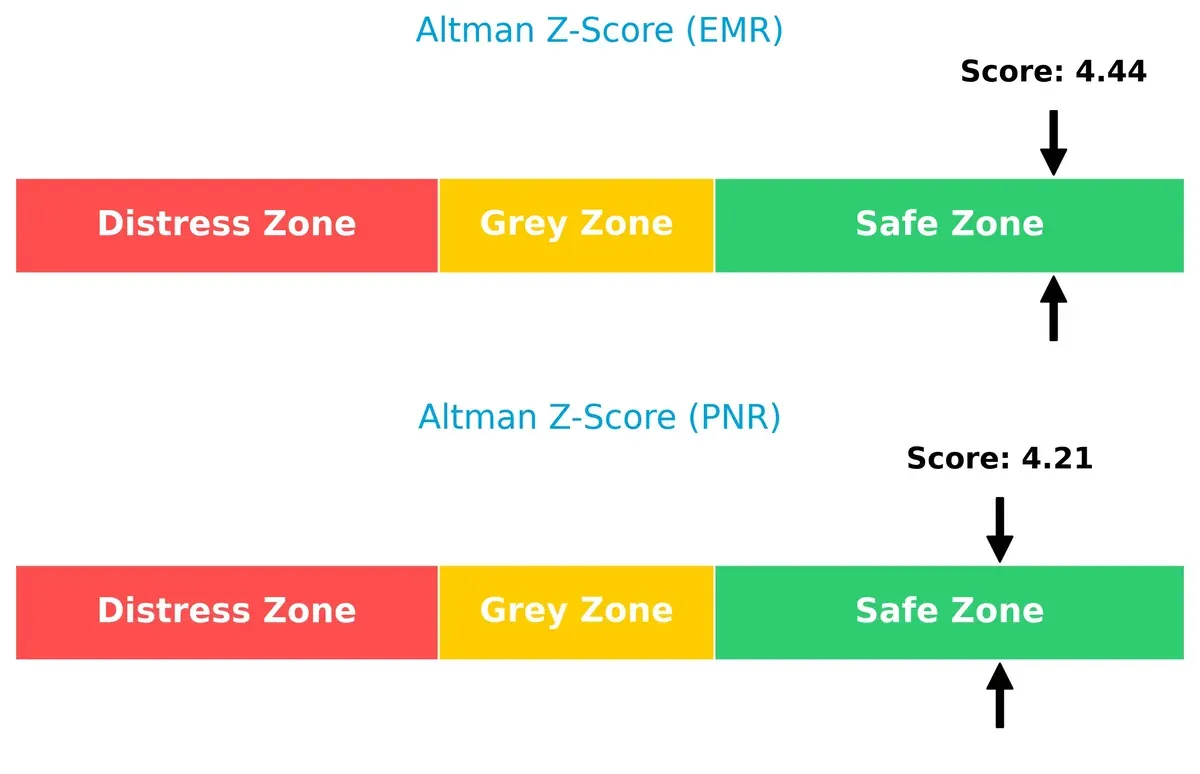
Bankruptcy Risk: Solvency Showdown
Pentair and Emerson both score safely above 4 on the Altman Z-Score, signaling robust solvency and low bankruptcy risk amid current cycle pressures:
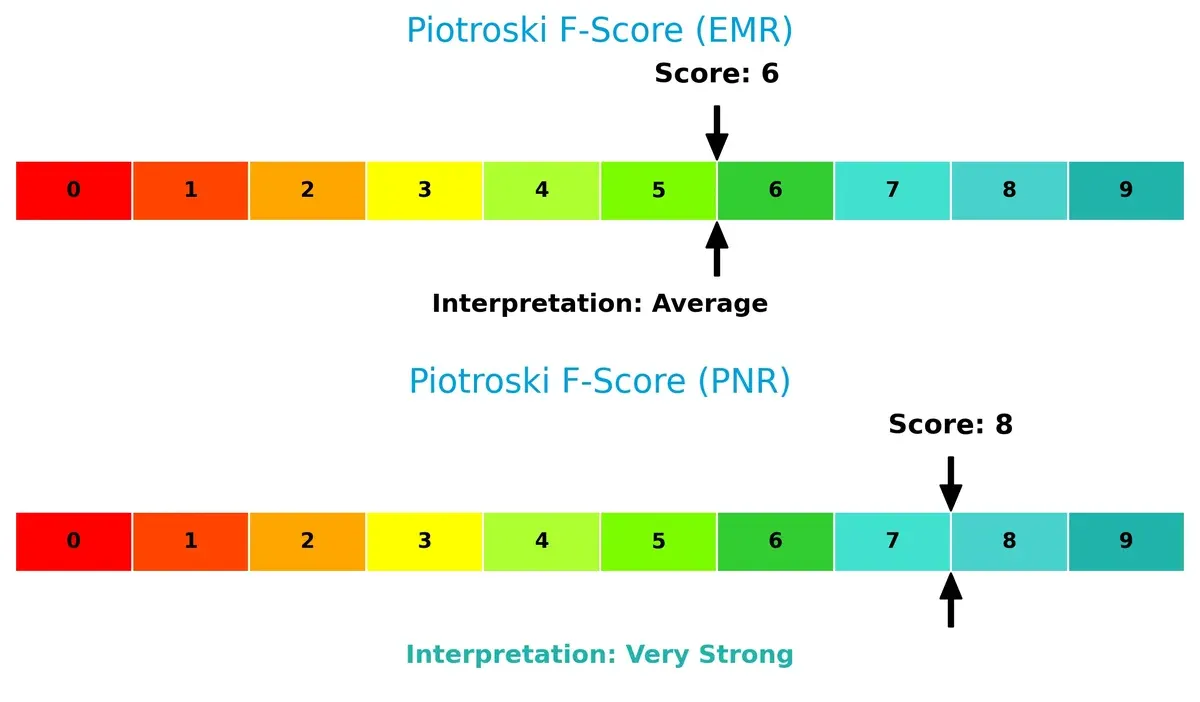
Financial Health: Quality of Operations
Pentair outperforms Emerson with a Piotroski F-Score of 8, indicating very strong operational health. Emerson’s 6 suggests average financial quality with potential red flags in internal efficiency compared to Pentair:
How are the two companies positioned?
This section dissects the operational DNA of Emerson Electric and Pentair by comparing their revenue distribution and internal strengths and weaknesses. The goal is to confront their economic moats and identify which model delivers the most resilient, sustainable competitive advantage today.
Revenue Segmentation: The Strategic Mix
This visual comparison dissects how Emerson Electric Co. and Pentair plc diversify their income streams and where their primary sector bets lie:
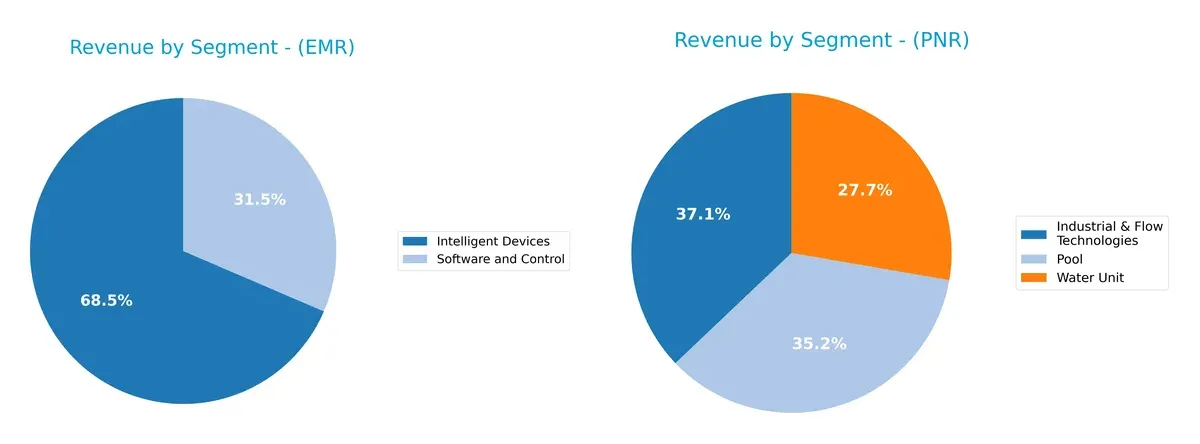
Emerson Electric Co. anchors revenue in “Intelligent Devices” with $12.4B, complemented by $5.7B in “Software and Control,” showing a clear two-segment dominance. Pentair plc displays a more balanced mix across “Industrial & Flow Technologies” ($1.5B), “Pool” ($1.4B), and “Water Unit” ($1.1B), reflecting a diversified approach. Emerson’s concentration suggests a strategic push on automation infrastructure, while Pentair’s spread reduces single-segment risk but limits scale advantage.
Strengths and Weaknesses Comparison
This table compares the strengths and weaknesses of Emerson Electric Co. and Pentair plc:
Emerson Electric Co. Strengths
- Diverse product segments including Intelligent Devices and Software and Control
- Strong presence in Americas, Asia, Europe
- Favorable net margin and interest coverage
- High fixed asset turnover
Pentair plc Strengths
- Favorable net margin, ROE, and ROIC indicate solid profitability
- Strong current ratio and low debt-to-assets
- High fixed asset turnover and interest coverage
- Diversified segments like Industrial & Flow Technologies and Pool
Emerson Electric Co. Weaknesses
- Low current and quick ratios indicate liquidity risk
- Unfavorable ROIC vs WACC suggests weak capital efficiency
- High P/E and P/B ratios may signal overvaluation
- Low asset turnover
Pentair plc Weaknesses
- Elevated P/E and P/B ratios suggest valuation concerns
- Dividend yield is unfavorable compared to peers
- Quick ratio is only neutral, showing moderate liquidity
- Less revenue from developing countries compared to US dominance
Emerson shows broader product and geographic diversification but faces liquidity and capital efficiency challenges. Pentair displays stronger profitability and financial health, yet valuation and dividend yield raise caution. These differences shape each company’s strategic priorities and risk management.
The Moat Duel: Analyzing Competitive Defensibility
A structural moat is the only thing protecting long-term profits from the erosion of competition. Let’s dissect the economic moats of Emerson Electric and Pentair:
Emerson Electric Co.: Diversified Industrial Intangible Assets Moat
Emerson relies on intangible assets like proprietary engineering and process control software. This shows in stable 17.6% EBIT margins but a concerning ROIC decline signals weakening capital efficiency in 2026.
Pentair plc: Focused Water Solutions Cost Advantage Moat
Pentair’s moat stems from cost advantages in water treatment technology, reflected in a strong 19.8% EBIT margin and positive ROIC vs. WACC. Though ROIC is declining, Pentair maintains value creation with expansion potential.
Value Creation vs. Capital Efficiency: Emerson’s Intangibles Clash with Pentair’s Cost Edge
Pentair holds a deeper moat with its ROIC comfortably above WACC, signaling sustained value creation. Emerson’s negative ROIC spread warns of value destruction, leaving Pentair better equipped to defend and grow market share.
Which stock offers better returns?
The past year saw Emerson Electric Co. surge 42.3%, accelerating gains with strong buyer dominance. Pentair plc gained 20.7%, but recent months show deceleration and seller dominance.
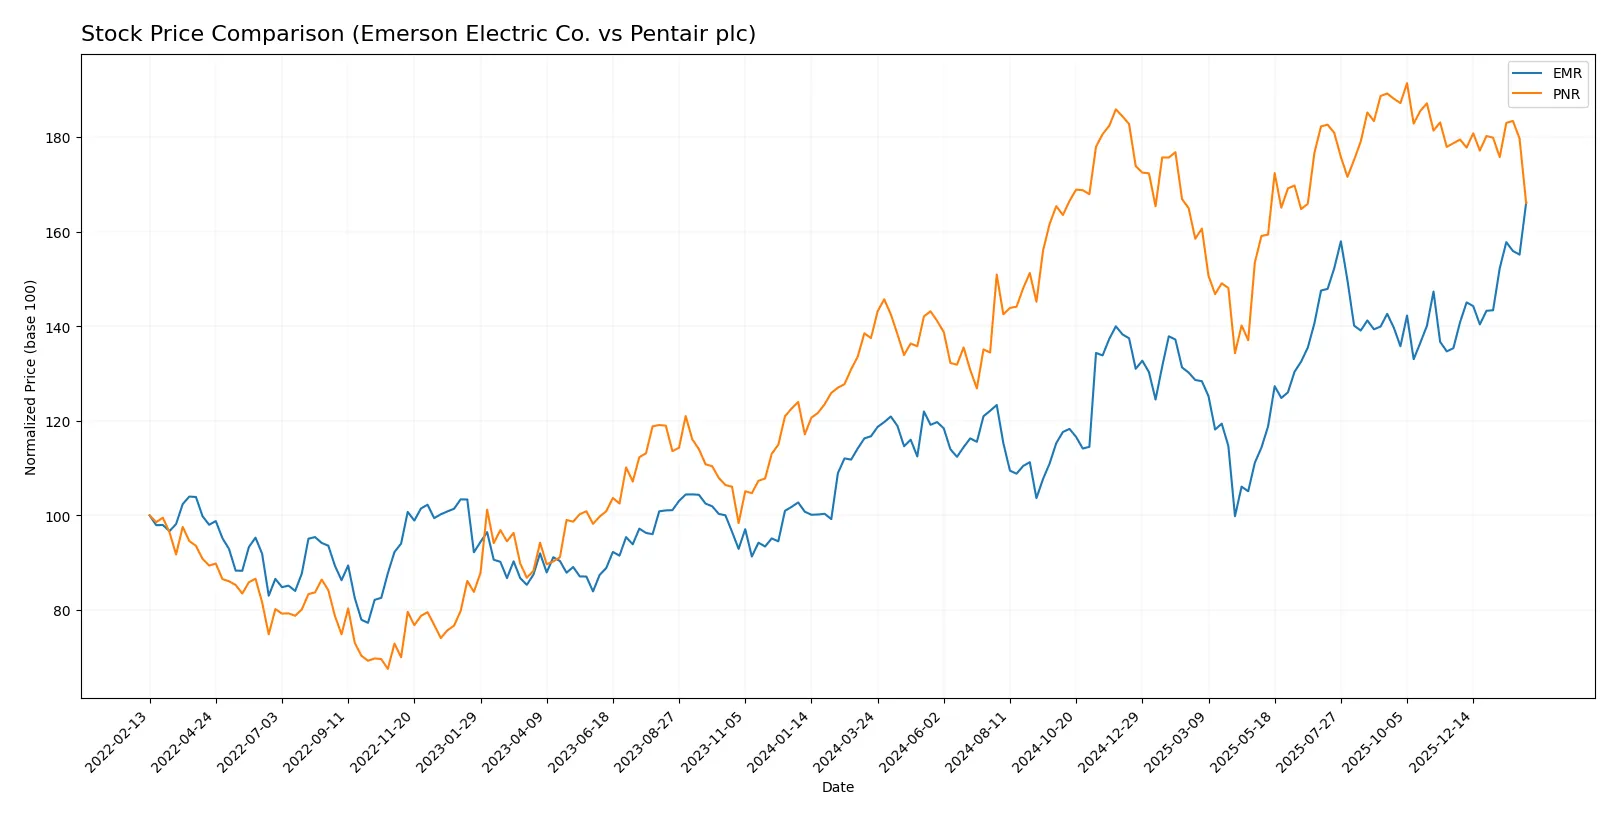
Trend Comparison
Emerson Electric Co. posted a 42.3% price rise over 12 months, confirming a bullish trend with accelerating momentum and volatility at 13.47%. The stock hit a high of 157.38 and a low of 94.57.
Pentair plc rose 20.7% over the same period, also bullish but with decelerating gains. Recent months show a 7.1% decline, seller dominance, and lower volatility of 10.7%.
Emerson Electric Co. clearly outperformed Pentair plc in total returns and momentum, maintaining buyer dominance unlike Pentair’s recent seller-driven trend.
Target Prices
Analysts present a positive outlook with solid upside potential for both Emerson Electric Co. and Pentair plc.
| Company | Target Low | Target High | Consensus |
|---|---|---|---|
| Emerson Electric Co. | 125 | 185 | 163.64 |
| Pentair plc | 90 | 135 | 118.56 |
Emerson’s target consensus of 163.64 suggests modest upside from its current 157.38 price, reflecting confidence in its industrial machinery leadership. Pentair’s 118.56 target consensus indicates significant appreciation potential above its 97.35 share price.

Don’t Let Luck Decide Your Entry Point
Optimize your entry points with our advanced ProRealTime indicators. You’ll get efficient buy signals with precise price targets for maximum performance. Start outperforming now!
How do institutions grade them?
Here is a summary of the latest institutional grades for Emerson Electric Co. and Pentair plc:
Emerson Electric Co. Grades
The table below shows recent grade actions from reputable grading firms on Emerson Electric Co.:
| Grading Company | Action | New Grade | Date |
|---|---|---|---|
| Evercore ISI Group | Maintain | Outperform | 2026-02-05 |
| Deutsche Bank | Downgrade | Hold | 2026-02-05 |
| Wells Fargo | Maintain | Equal Weight | 2026-02-04 |
| Citigroup | Maintain | Buy | 2026-02-04 |
| Oppenheimer | Downgrade | Perform | 2026-01-27 |
| JP Morgan | Maintain | Neutral | 2026-01-16 |
| Wells Fargo | Maintain | Equal Weight | 2026-01-07 |
| Barclays | Maintain | Equal Weight | 2026-01-07 |
| UBS | Upgrade | Buy | 2026-01-05 |
| Jefferies | Downgrade | Hold | 2025-12-10 |
Pentair plc Grades
Below is a summary of recent institutional grades for Pentair plc:
| Grading Company | Action | New Grade | Date |
|---|---|---|---|
| Citigroup | Maintain | Buy | 2026-02-04 |
| Oppenheimer | Maintain | Outperform | 2026-02-04 |
| JP Morgan | Maintain | Overweight | 2026-01-16 |
| Citigroup | Maintain | Buy | 2026-01-12 |
| BNP Paribas Exane | Downgrade | Underperform | 2026-01-07 |
| TD Cowen | Downgrade | Sell | 2026-01-05 |
| Jefferies | Upgrade | Buy | 2025-12-10 |
| Barclays | Downgrade | Equal Weight | 2025-12-04 |
| Oppenheimer | Maintain | Outperform | 2025-11-20 |
| UBS | Maintain | Buy | 2025-10-22 |
Which company has the best grades?
Pentair generally maintains stronger buy and outperform ratings from institutions than Emerson Electric. Emerson’s grades reveal more downgrades and neutral holds. Investors may see Pentair as having greater current institutional confidence.
Risks specific to each company
The following categories identify the critical pressure points and systemic threats facing both firms in the 2026 market environment:
1. Market & Competition
Emerson Electric Co.
- Faces intense competition in industrial machinery with pressure from technological shifts.
Pentair plc
- Competes in water solutions with strong demand but niche market constraints.
2. Capital Structure & Debt
Emerson Electric Co.
- Moderate debt levels with debt-to-assets at 32.8%, interest coverage solid at 8.2x.
Pentair plc
- Lower leverage, debt-to-assets at 23.9%, interest coverage stronger at 11.9x.
3. Stock Volatility
Emerson Electric Co.
- Beta of 1.25 indicates above-market volatility; stock price range wider.
Pentair plc
- Slightly lower beta at 1.22; tighter trading range implies more stability.
4. Regulatory & Legal
Emerson Electric Co.
- Subject to diverse industrial and environmental regulations globally; regulatory compliance costs rising.
Pentair plc
- Faces water treatment regulations, especially in Europe; compliance risks increasing but manageable.
5. Supply Chain & Operations
Emerson Electric Co.
- Complex global supply chain vulnerable to geopolitical disruptions and raw material price fluctuations.
Pentair plc
- More focused supply chain with less complexity; operational risks moderate but linked to water tech inputs.
6. ESG & Climate Transition
Emerson Electric Co.
- Transition risks due to energy-intensive industrial processes; ESG compliance rising in cost and scrutiny.
Pentair plc
- Positioned better with water sustainability focus; ESG efforts align with climate trends, reducing transition risk.
7. Geopolitical Exposure
Emerson Electric Co.
- Global exposure across Americas, Asia, Middle East, with risks from trade tensions and regional instability.
Pentair plc
- Primarily exposed to European and North American markets; geopolitical risks lower but still present.
Which company shows a better risk-adjusted profile?
Emerson’s biggest risk lies in its complex global supply chain and low liquidity ratios, raising operational and financial red flags. Pentair’s primary concern is regulatory and competitive pressures in its water solutions niche. Overall, Pentair presents a stronger risk-adjusted profile, supported by superior liquidity, higher profitability, and a very strong Piotroski score. Emerson’s liquidity constraints and unfavorable ROIC versus WACC highlight structural weaknesses despite its scale.
Final Verdict: Which stock to choose?
Emerson Electric Co. (EMR) excels as a cash-generating industrial powerhouse with strong operational margins and a bullish price trend. Its main point of vigilance is a current ratio below 1, signaling potential short-term liquidity pressure. EMR suits portfolios targeting resilient industrial exposure with an appetite for cyclical value play.
Pentair plc (PNR) boasts a strategic moat rooted in efficient capital use and recurring revenue streams, reflected in a favorable ROIC above WACC. It maintains better liquidity and lower leverage than EMR, offering a comparatively safer profile. PNR fits well in balanced growth portfolios seeking steady value creation with moderate risk.
If you prioritize robust cash flow and industrial sector leverage, EMR presents a compelling scenario due to its operational efficiency despite liquidity caution. However, if you seek stronger capital returns and financial stability, PNR outshines EMR with superior moat metrics and a safer balance sheet, appealing to risk-aware growth investors.
Disclaimer: Investment carries a risk of loss of initial capital. The past performance is not a reliable indicator of future results. Be sure to understand risks before making an investment decision.
Go Further
I encourage you to read the complete analyses of Emerson Electric Co. and Pentair plc to enhance your investment decisions: