Emerson Electric Co. and Parsons Corporation stand out as key players in the industrial machinery sector, each driving innovation through distinct yet overlapping markets. Emerson focuses on automation and commercial solutions, while Parsons leads in defense and critical infrastructure technologies. Their shared emphasis on advanced engineering and global reach makes this comparison essential. Join me as we explore which company offers the most compelling investment opportunity in 2026.

Table of contents
Companies Overview
I will begin the comparison between Emerson Electric Co. and Parsons Corporation by providing an overview of these two companies and their main differences.
Emerson Electric Co. Overview
Emerson Electric Co. is a technology and engineering company serving industrial, commercial, and residential markets globally. It operates through two segments: Automation Solutions, offering instrumentation and process control systems, and Commercial & Residential Solutions, providing heating, air conditioning, and environmental control products. With a market cap of 81B USD and 73K employees, Emerson positions itself as a diversified industrial leader headquartered in Saint Louis, Missouri.
Parsons Corporation Overview
Parsons Corporation delivers integrated solutions in defense, intelligence, and critical infrastructure sectors. It operates Federal Solutions and Critical Infrastructure segments, offering cybersecurity, space and missile defense, transportation management, and environmental services. With a market cap of 7.5B USD and 20K employees, Parsons focuses on government and private-sector clients, headquartered in Centreville, Virginia, emphasizing technology-driven critical infrastructure.
Key similarities and differences
Both companies operate in the industrial machinery sector with a focus on providing technological solutions. Emerson targets a broader market including residential and commercial sectors, while Parsons specializes in defense, intelligence, and critical infrastructure. Emerson’s larger scale and diversified product range contrast with Parsons’ niche focus on cybersecurity, defense platforms, and infrastructure management, reflecting different strategic priorities within the industrial space.
Income Statement Comparison
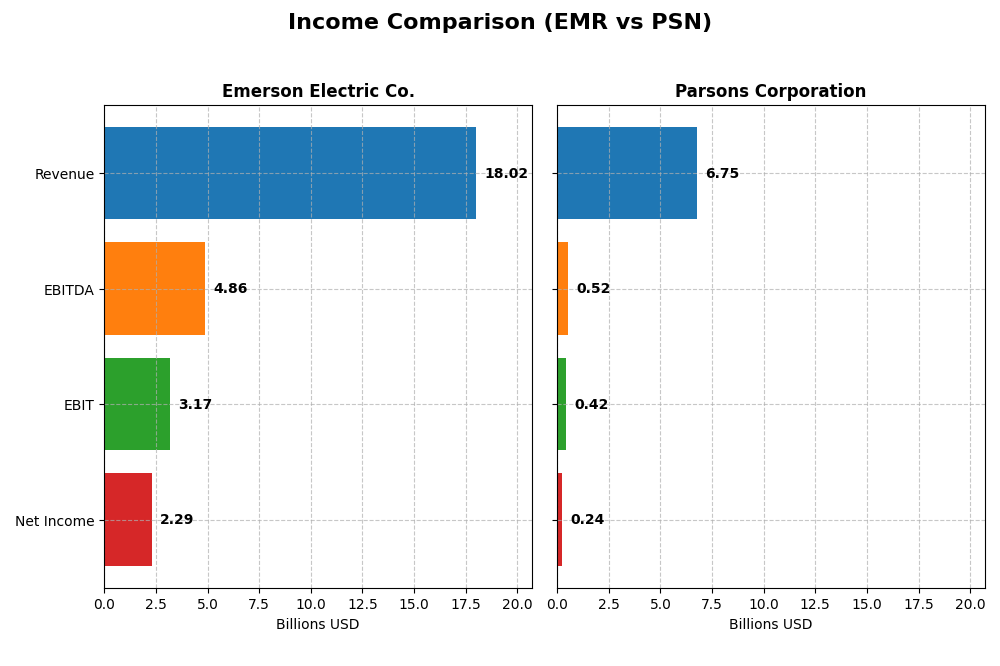
This table compares the key income statement metrics for Emerson Electric Co. and Parsons Corporation for their most recent fiscal years, highlighting their financial performance in USD.
| Metric | Emerson Electric Co. (EMR) | Parsons Corporation (PSN) |
|---|---|---|
| Market Cap | 81B | 7.5B |
| Revenue | 18.0B | 6.75B |
| EBITDA | 4.86B | 518M |
| EBIT | 3.17B | 419M |
| Net Income | 2.29B | 238M |
| EPS | 4.06 | 2.21 |
| Fiscal Year | 2025 | 2024 |
Income Statement Interpretations
Emerson Electric Co.
Emerson Electric Co. showed a solid revenue increase of 39.3% from 2021 to 2025, though net income slightly declined by 0.43% over the same period. Margins remain strong, with a favorable gross margin of 52.84% and a net margin of 12.73%. In 2025, revenue growth slowed to 3%, but EBIT and net margin improved significantly, reflecting enhanced profitability.
Parsons Corporation
Parsons Corporation experienced robust revenue growth of 72.25% and net income growth of 138.53% from 2020 to 2024. Its gross margin stands at 20.83%, with a neutral EBIT margin of 6.21%. The latest fiscal year showed strong momentum with a 24% revenue increase and a 42% jump in EBIT, alongside a substantial rise in EPS by 49.3%, indicating operational and earnings expansion.
Which one has the stronger fundamentals?
Both companies exhibit favorable income statements, yet Parsons demonstrates higher overall growth rates across revenue, net income, and EPS, with 85.7% favorable metrics and no unfavorable indicators. Emerson shows higher margins but some unfavorable trends in recent revenue growth and net income. Thus, Parsons currently reflects stronger growth fundamentals, while Emerson maintains solid profitability.
Financial Ratios Comparison
This table presents the latest available financial ratios for Emerson Electric Co. (EMR) and Parsons Corporation (PSN) for fiscal year 2025 and 2024 respectively, offering a snapshot of their performance metrics.
| Ratios | Emerson Electric Co. (2025) | Parsons Corporation (2024) |
|---|---|---|
| ROE | 11.3% | 9.7% |
| ROIC | 4.6% | 8.3% |
| P/E | 32.4 | 41.7 |
| P/B | 3.66 | 4.06 |
| Current Ratio | 0.88 | 1.29 |
| Quick Ratio | 0.65 | 1.29 |
| D/E (Debt-to-Equity) | 0.65 | 0.59 |
| Debt-to-Assets | 31.3% | 25.9% |
| Interest Coverage | 9.44 | 8.30 |
| Asset Turnover | 0.43 | 1.23 |
| Fixed Asset Turnover | 6.28 | 25.51 |
| Payout ratio | 52.0% | 0% |
| Dividend yield | 1.60% | 0% |
Interpretation of the Ratios
Emerson Electric Co.
Emerson Electric shows a mixed ratio profile with 21.43% favorable and 42.86% unfavorable ratios, leading to a slightly unfavorable overall opinion. Strong points include a favorable net margin of 12.73% and interest coverage of 13.38, but concerns arise from low liquidity ratios (current ratio at 0.88) and high valuation multiples (PE at 32.42, PB at 3.66). Dividend yield is moderate at 1.6%, indicating steady shareholder returns.
Parsons Corporation
Parsons Corporation presents a more favorable ratio set, with 42.86% favorable and 35.71% unfavorable metrics, reflecting a slightly favorable global opinion. The company benefits from strong asset turnover (1.23) and fixed asset turnover (25.51), with a solid interest coverage of 8.13. However, net margin is weak at 3.48%. Parsons does not pay dividends, likely due to reinvestment priorities or growth phase.
Which one has the best ratios?
Parsons Corporation holds a slight edge in ratio quality, with a higher proportion of favorable metrics and better operational efficiency ratios. Emerson Electric, despite some strong profitability and dividend yield, shows weaknesses in liquidity and valuation measures. Overall, Parsons’s ratios suggest a marginally stronger financial position in this comparison.
Strategic Positioning
This section compares the strategic positioning of Emerson Electric Co. (EMR) and Parsons Corporation (PSN) regarding market position, key segments, and exposure to technological disruption:
Emerson Electric Co. (EMR)
- Large market cap of 81B with broad industrial machinery presence and moderate competitive pressure.
- Diversified segments including Automation Solutions and Commercial & Residential Solutions driving revenues.
- Exposure to technological disruption through industrial automation and control software innovation.
Parsons Corporation (PSN)
- Smaller market cap of 7.5B, focused on defense and critical infrastructure markets.
- Concentrated on Federal Solutions and Critical Infrastructure segments, mainly defense-related.
- Exposure through cyber security, intelligence, and advanced defense technologies.
EMR vs PSN Positioning
EMR pursues a diversified strategy across multiple industrial and residential markets, providing stability but facing complex competition. PSN focuses on specialized defense and infrastructure sectors, offering niche expertise but with narrower market coverage.
Which has the best competitive advantage?
Based on MOAT evaluation, PSN shows a very favorable durable competitive advantage with growing ROIC and value creation, while EMR has a very unfavorable position with declining ROIC and value destruction.
Stock Comparison
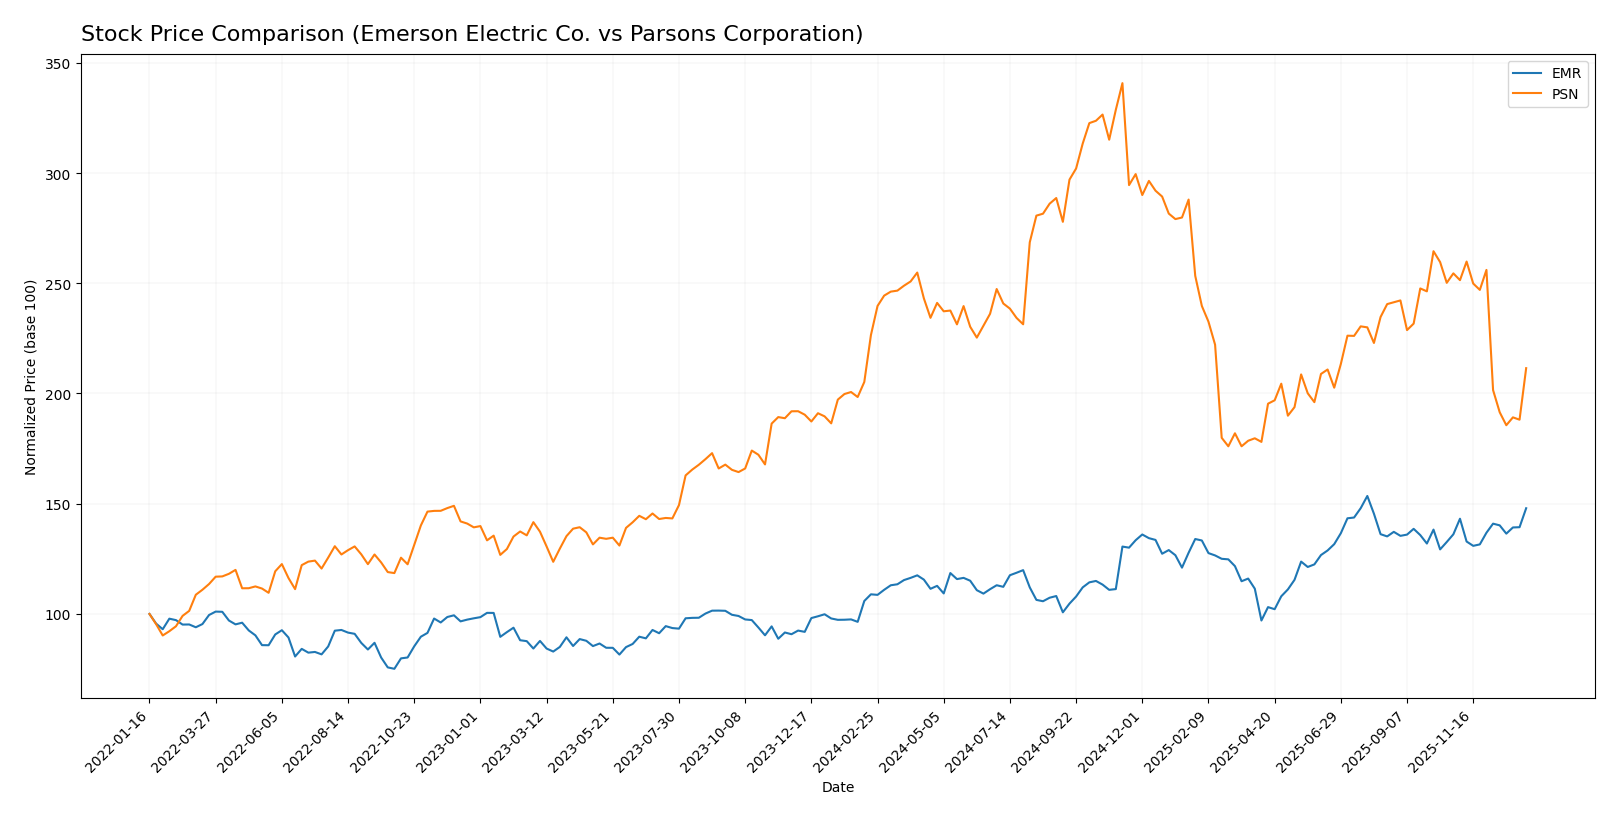
The stock prices of Emerson Electric Co. and Parsons Corporation have exhibited contrasting dynamics over the past year, with Emerson showing strong upward momentum while Parsons experienced a notable decline.
Trend Analysis
Emerson Electric Co. (EMR) stock showed a bullish trend over the past 12 months with a 35.85% price increase, accompanied by accelerating growth and a high volatility of 12.39%. The stock reached a high of 149.63 and a low of 94.57.
Parsons Corporation (PSN) stock exhibited a bearish trend over the same period, declining by 6.62%. The trend decelerated with a slightly higher volatility of 12.98%, hitting a high of 112.69 and a low of 58.22.
Comparing both, Emerson Electric Co. delivered the highest market performance with solid gains, whereas Parsons Corporation faced a downturn, reflecting divergent investor sentiment and trading outcomes.
Target Prices
Analysts provide a clear consensus on target prices for Emerson Electric Co. and Parsons Corporation.
| Company | Target High | Target Low | Consensus |
|---|---|---|---|
| Emerson Electric Co. | 170 | 125 | 149.67 |
| Parsons Corporation | 107 | 70 | 85 |
The target consensus indicates moderate upside potential for Emerson Electric, slightly above its current price of $144.22, while Parsons Corporation’s consensus target suggests a significant potential increase from its current price of $69.93.
Analyst Opinions Comparison
This section compares analysts’ ratings and financial scores for Emerson Electric Co. and Parsons Corporation:
Rating Comparison
EMR Rating
- Overall rating is B, indicating a very favorable standing.
- Discounted Cash Flow Score is 3, suggesting moderate valuation outlook.
- Return on Equity Score is 3, reflecting moderate efficiency in equity use.
- Return on Assets Score is 4, demonstrating favorable asset utilization.
- Debt To Equity Score is 2, reflecting moderate financial risk from leverage.
- Overall Score is 3, representing a moderate overall financial performance.
PSN Rating
- Overall rating is A-, also very favorable, showing stronger analyst support.
- Discounted Cash Flow Score is 5, indicating a very favorable valuation.
- Return on Equity Score is 4, showing favorable efficiency in generating profit.
- Return on Assets Score is 4, equally favorable in asset usage effectiveness.
- Debt To Equity Score is 2, also moderate, indicating similar leverage risk.
- Overall Score is 4, indicating more favorable overall financial strength.
Which one is the best rated?
Based strictly on the provided data, Parsons Corporation is better rated overall with an A- rating and higher scores in discounted cash flow, return on equity, and overall financial strength compared to Emerson Electric Co.’s B rating and moderate scores.
Scores Comparison
The comparison of scores between Emerson Electric Co. and Parsons Corporation is as follows:
EMR Scores
- Altman Z-Score: 2.68, indicating moderate bankruptcy risk in the grey zone.
- Piotroski Score: 7, reflecting strong financial health.
PSN Scores
- Altman Z-Score: 3.59, indicating low bankruptcy risk in the safe zone.
- Piotroski Score: 6, reflecting average financial strength.
Which company has the best scores?
Based on the provided data, Parsons has a better Altman Z-Score, placing it in the safe zone, while Emerson has a higher Piotroski Score, indicating stronger financial health. Each company excels in a different score category.
Grades Comparison
Here is a detailed comparison of the latest grades assigned to Emerson Electric Co. and Parsons Corporation:
Emerson Electric Co. Grades
The following table summarizes recent grades from established financial institutions for Emerson Electric Co.:
| Grading Company | Action | New Grade | Date |
|---|---|---|---|
| Wells Fargo | Maintain | Equal Weight | 2026-01-07 |
| Barclays | Maintain | Equal Weight | 2026-01-07 |
| UBS | Upgrade | Buy | 2026-01-05 |
| Jefferies | Downgrade | Hold | 2025-12-10 |
| JP Morgan | Maintain | Neutral | 2025-11-10 |
| RBC Capital | Maintain | Outperform | 2025-11-06 |
| Barclays | Maintain | Equal Weight | 2025-11-06 |
| RBC Capital | Maintain | Outperform | 2025-10-16 |
| JP Morgan | Maintain | Neutral | 2025-10-15 |
| Wells Fargo | Downgrade | Equal Weight | 2025-10-06 |
Emerson’s grades show a mix of “Equal Weight,” “Neutral,” and “Outperform” ratings, with a recent upgrade to “Buy” from UBS and some downgrades from other firms.
Parsons Corporation Grades
The following table presents recent grades from recognized grading companies for Parsons Corporation:
| Grading Company | Action | New Grade | Date |
|---|---|---|---|
| B of A Securities | Maintain | Buy | 2025-12-30 |
| Stifel | Maintain | Buy | 2025-12-23 |
| Jefferies | Maintain | Hold | 2025-12-11 |
| TD Cowen | Upgrade | Buy | 2025-12-10 |
| Baird | Maintain | Outperform | 2025-12-08 |
| Truist Securities | Maintain | Buy | 2025-12-08 |
| Keybanc | Maintain | Overweight | 2025-12-08 |
| Truist Securities | Maintain | Buy | 2025-12-05 |
| William Blair | Upgrade | Outperform | 2025-11-20 |
| Keybanc | Maintain | Overweight | 2025-10-20 |
Parsons consistently receives positive grades, predominantly “Buy,” “Outperform,” and “Overweight,” with recent upgrades indicating strengthening confidence.
Which company has the best grades?
Both companies have a consensus “Buy” rating, but Parsons Corporation’s grades generally trend higher with more “Buy,” “Outperform,” and “Overweight” ratings compared to Emerson Electric Co.’s mix of “Equal Weight,” “Neutral,” and fewer upgrades. For investors, Parsons’ stronger consensus might indicate higher market confidence.
Strengths and Weaknesses
Below is a comparison table highlighting the key strengths and weaknesses of Emerson Electric Co. (EMR) and Parsons Corporation (PSN) based on the most recent financial and strategic data.
| Criterion | Emerson Electric Co. (EMR) | Parsons Corporation (PSN) |
|---|---|---|
| Diversification | Strong diversification with multiple segments including Intelligent Devices ($12.4B) and Software & Control ($5.7B) | Moderate diversification focused on Critical Infrastructure ($2.74B) and Federal Solutions ($4B) |
| Profitability | Net margin 12.7% (favorable) but ROIC 4.62% below WACC 8.79% (unfavorable), indicating value destruction | Lower net margin 3.48% (unfavorable) but ROIC 8.28% above WACC 6.17% (favorable), indicating value creation |
| Innovation | Moderate innovation with steady product segments but declining ROIC trend (-43%) signals challenges | Strong innovation reflected in 80% ROIC growth and very favorable moat status, showing durable competitive advantage |
| Global presence | Established global industrial footprint but slightly unfavorable asset turnover (0.43) | Growing global presence with efficient asset use (asset turnover 1.23) and favorable interest coverage |
| Market Share | Large market share in industrial automation and control solutions | Smaller but growing market share in government and infrastructure sectors |
In summary, Parsons Corporation demonstrates a stronger and more durable competitive advantage with improving profitability and efficient capital use, making it a favorable choice for investors prioritizing growth and value creation. Emerson Electric, despite its size and diversification, faces challenges in profitability and capital efficiency that require cautious consideration.
Risk Analysis
Below is a comparative table outlining the key risks for Emerson Electric Co. (EMR) and Parsons Corporation (PSN) based on the most recent data from 2025 and 2024 respectively:
| Metric | Emerson Electric Co. (EMR) | Parsons Corporation (PSN) |
|---|---|---|
| Market Risk | Moderate (Beta 1.25) | Lower (Beta 0.66) |
| Debt level | Moderate (D/E 0.65, Debt/Assets 31%) | Moderate (D/E 0.59, Debt/Assets 26%) |
| Regulatory Risk | Moderate (Industrial sector, global exposure) | Moderate to High (Defense & critical infrastructure, sensitive contracts) |
| Operational Risk | Moderate (Complex manufacturing and software systems) | Moderate (Project execution, cybersecurity services) |
| Environmental Risk | Moderate (Industrial machinery impact, energy use) | Moderate (Infrastructure projects, environmental compliance) |
| Geopolitical Risk | Moderate (Global markets exposure) | High (Defense contracts, international security environment) |
In synthesis, Parsons faces higher geopolitical and regulatory risks due to its defense and critical infrastructure focus, with sensitivity to government contracts and global security dynamics. Emerson’s risks are more balanced but include moderate market volatility and operational complexity. Both companies maintain moderate debt levels, but Parsons’s stronger Altman Z-score and financial ratios suggest a safer credit position. Investors should weigh Parsons’s geopolitical risks against Emerson’s operational and market exposure when managing portfolio risk.
Which Stock to Choose?
Emerson Electric Co. (EMR) shows a mixed income evolution with favorable gross and EBIT margins but slight revenue growth decline and a net margin decrease over the long term. Its financial ratios reveal moderate profitability, some unfavorable valuation metrics, and a moderate debt level, with an overall slightly unfavorable ratio profile and a very favorable rating of B.
Parsons Corporation (PSN) exhibits strong income growth and favorable profitability improvements, supported by a generally favorable financial ratio profile, including solid asset turnover and debt management. The company maintains a very favorable rating of A- and demonstrates a very favorable moat with increasing ROIC, despite a recent bearish stock trend.
For investors prioritizing durable competitive advantage and improving profitability, PSN could appear more favorable, while those valuing stable rating and margin performance might consider EMR’s profile. Risk tolerance and investment strategy might influence the preference between PSN’s growth momentum and EMR’s established financial standing.
Disclaimer: Investment carries a risk of loss of initial capital. The past performance is not a reliable indicator of future results. Be sure to understand risks before making an investment decision.
Go Further
I encourage you to read the complete analyses of Emerson Electric Co. and Parsons Corporation to enhance your investment decisions: