Home > Comparison > Industrials > PH vs EMR
The strategic rivalry between Parker-Hannifin Corporation and Emerson Electric Co. defines the current trajectory of the industrial machinery sector. Parker-Hannifin operates as a specialized manufacturer of motion and control technologies, emphasizing aerospace and diversified industrial markets. Emerson Electric combines technology-driven automation with commercial and residential solutions, targeting broad industrial applications. This analysis will determine which company’s operational model offers a superior risk-adjusted return for diversified investors navigating cyclical industrial dynamics.
Table of contents
Companies Overview
Parker-Hannifin and Emerson Electric anchor the industrial machinery sector with robust global footprints and diversified portfolios.
Parker-Hannifin Corporation: Leader in Motion and Control Technologies
Parker-Hannifin dominates the motion and control technologies market, generating revenue from diversified industrial and aerospace segments. Its core business includes sealing, filtration, and hydraulic systems sold to OEMs and distributors in manufacturing and aerospace. In 2026, the company focuses on expanding aerospace systems and enhancing product innovation to maintain its competitive edge.
Emerson Electric Co.: Engineering Solutions Powerhouse
Emerson Electric excels in technology and engineering solutions for industrial, commercial, and residential markets worldwide. It earns revenue through automation and commercial solutions, offering process control software, valves, and HVAC products. The 2026 strategic priority emphasizes automation solutions and energy-efficient technologies to address evolving market demands and sustainability trends.
Strategic Collision: Similarities & Divergences
Both companies compete in industrial machinery but differ in philosophy: Parker-Hannifin prioritizes specialized motion control systems, while Emerson embraces broader automation and HVAC solutions. Their primary battleground is industrial process efficiency and innovation. Parker-Hannifin presents a focused aerospace-industrial hybrid profile, whereas Emerson offers diversified exposure with a technology-driven commercial tilt.
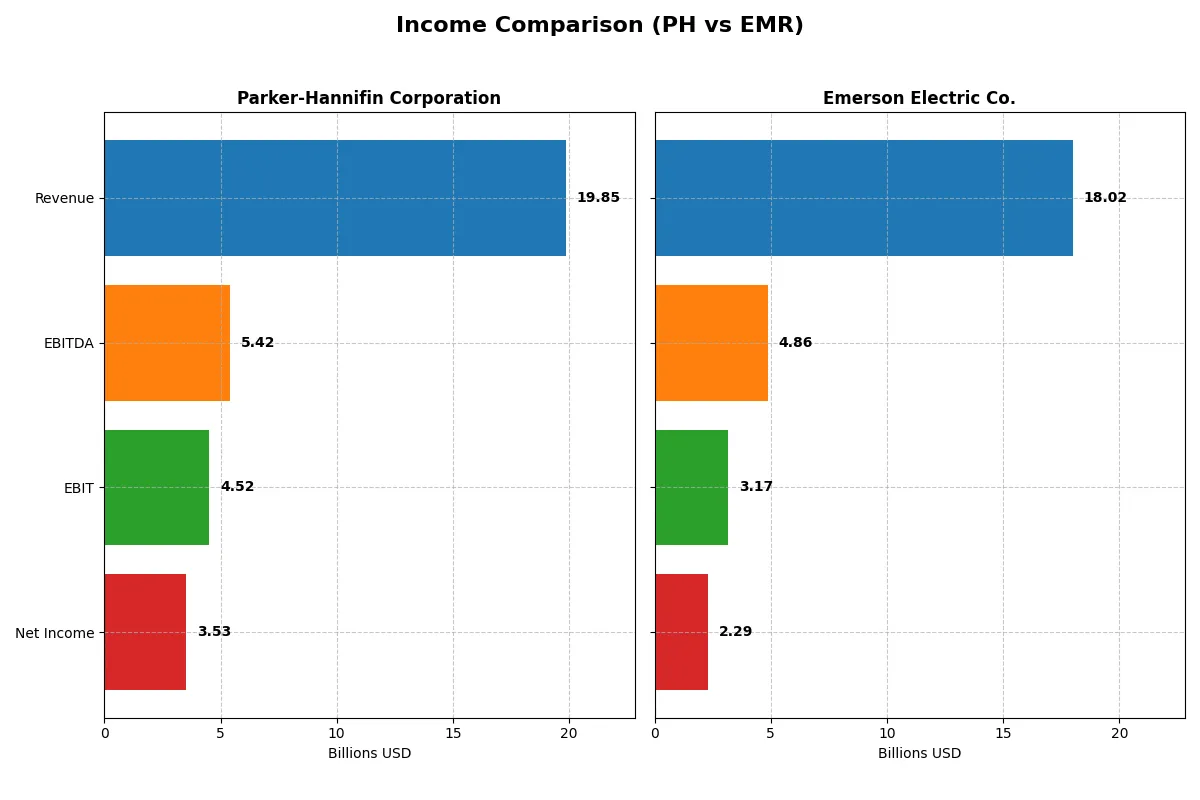
Income Statement Comparison
This data dissects the core profitability and scalability of both corporate engines to reveal who dominates the bottom line:
| Metric | Parker-Hannifin Corporation (PH) | Emerson Electric Co. (EMR) |
|---|---|---|
| Revenue | 19.85B | 18.02B |
| Cost of Revenue | 12.54B | 8.50B |
| Operating Expenses | 3.26B | 7.28B |
| Gross Profit | 7.32B | 9.52B |
| EBITDA | 5.42B | 4.86B |
| EBIT | 4.52B | 3.17B |
| Interest Expense | 409M | 237M |
| Net Income | 3.53B | 2.29B |
| EPS | 27.52 | 4.06 |
| Fiscal Year | 2025 | 2025 |
Income Statement Analysis: The Bottom-Line Duel
This income statement comparison reveals the true efficiency and profitability of Parker-Hannifin Corporation and Emerson Electric Co.’s business models.
Parker-Hannifin Corporation Analysis
Parker-Hannifin’s revenue slightly declined by 0.4% in 2025 but grew 38.4% over five years, showing solid top-line expansion. Net income surged 102% over the period, with a robust 17.8% net margin in 2025. Gross margin holds firm at 36.9%, supported by a strong 22.8% EBIT margin, indicating excellent operational efficiency and margin momentum.
Emerson Electric Co. Analysis
Emerson’s revenue rose 3.0% in 2025 and 39.3% over five years, reflecting steady sales growth. However, net income slightly contracted by 0.4% over the period, with a 12.7% net margin in 2025. Gross margin stands at an impressive 52.8%, but a lower 17.6% EBIT margin points to higher operating costs, despite a notable 35.3% EBIT growth in the latest year.
Margin Strength vs. Income Growth
Parker-Hannifin leads with stronger net income growth and superior EBIT margins, signaling better capital allocation and cost control. Emerson boasts a higher gross margin but struggles to convert this into net income growth, reflecting margin pressures. Investors seeking resilient profitability may prefer Parker-Hannifin’s profile, while Emerson’s scale and gross margin strength suggest different operational priorities.
Financial Ratios Comparison
These vital ratios act as a diagnostic tool to expose the underlying fiscal health, valuation premiums, and capital efficiency of the companies compared:
| Ratios | Parker-Hannifin (PH) | Emerson Electric (EMR) |
|---|---|---|
| ROE | 25.8% | 11.3% |
| ROIC | 13.7% | 4.6% |
| P/E | 25.4 | 32.4 |
| P/B | 6.55 | 3.67 |
| Current Ratio | 1.19 | 0.88 |
| Quick Ratio | 0.71 | 0.65 |
| D/E | 0.69 | 0.68 |
| Debt-to-Assets | 32.2% | 32.8% |
| Interest Coverage | 9.93 | 9.44 |
| Asset Turnover | 0.67 | 0.43 |
| Fixed Asset Turnover | 6.76 | 5.14 |
| Payout Ratio | 24.4% | 52.0% |
| Dividend Yield | 0.96% | 1.60% |
| Fiscal Year | 2025 | 2025 |
Efficiency & Valuation Duel: The Vital Signs
Ratios act as the company’s DNA, revealing hidden risks and operational excellence through profitability, valuation, and liquidity metrics.
Parker-Hannifin Corporation
Parker-Hannifin shows strong profitability with a 25.8% ROE and a solid 17.8% net margin, signaling operational efficiency. The valuation appears stretched, with a P/E of 25.4 and a P/B of 6.55. Dividend yield is low at 0.96%, reflecting a modest shareholder return alongside reinvestment in growth and R&D.
Emerson Electric Co.
Emerson Electric posts a moderate 11.3% ROE and a 12.7% net margin, indicating decent profitability but less efficiency than peers. Its valuation is more expensive with a P/E of 32.4 and P/B at 3.67. Dividend yield is higher at 1.6%, suggesting a stable income return, though reinvestment in operations appears limited.
Premium Valuation vs. Operational Safety
Parker-Hannifin balances higher profitability against stretched valuation, while Emerson Electric trades at a premium with weaker returns. Investors prioritizing operational strength may favor Parker-Hannifin, while those seeking income might lean toward Emerson’s steadier dividend profile.
Which one offers the Superior Shareholder Reward?
I compare Parker-Hannifin (PH) and Emerson Electric (EMR) on dividend yield, payout ratio, and buyback intensity. PH yields ~0.96% with a 24% payout ratio, supported by strong free cash flow coverage (FCF/operating cash flow ~88%). EMR offers a higher yield at ~1.6% but with a riskier 52% payout ratio and weaker dividend plus capex coverage (~1.9x vs. PH’s ~2.9x). Both firms deploy buybacks, but PH’s capital expenditure coverage ratio (~8.7x) signals more sustainable cash generation. EMR’s higher leverage and variable margins increase risk. I find PH’s balanced distribution and robust cash flow underpin a more sustainable and attractive total shareholder return in 2026.
Comparative Score Analysis: The Strategic Profile
The radar chart reveals the fundamental DNA and trade-offs of Parker-Hannifin and Emerson Electric, highlighting their distinct financial strengths and vulnerabilities:
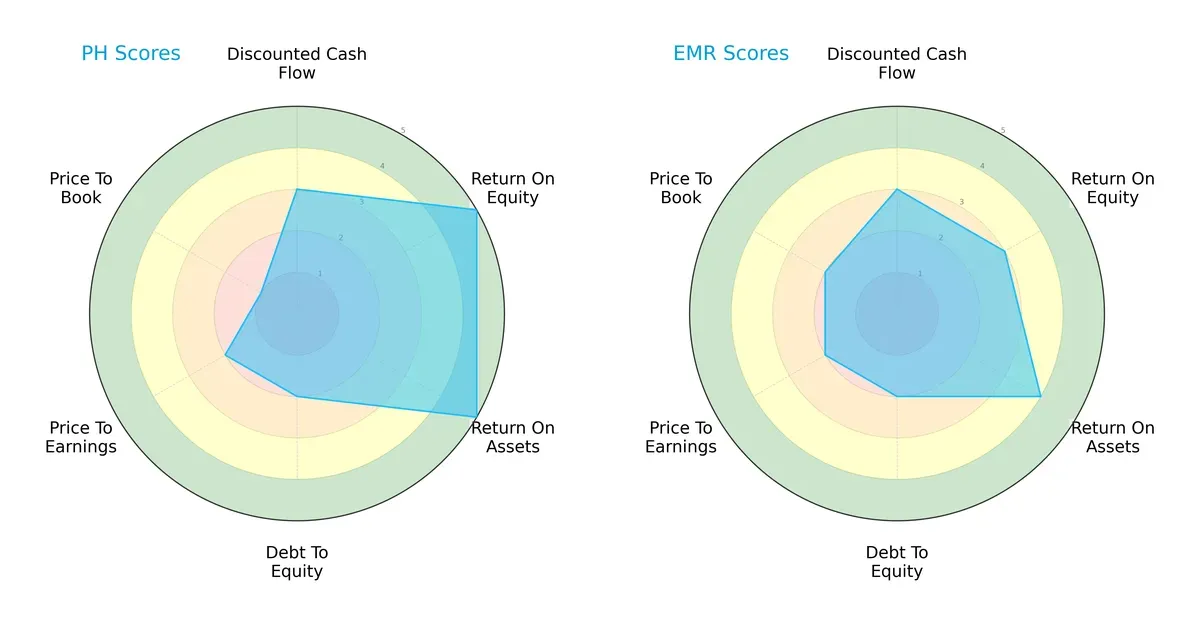
Parker-Hannifin commands superior returns with ROE and ROA scores at 5, signaling excellent asset and equity efficiency. Emerson Electric shows a more balanced valuation with moderately better price-to-book metrics. Both share moderate debt-to-equity risk, but Parker leans heavily on operational excellence, while Emerson offers steadier valuation discipline.
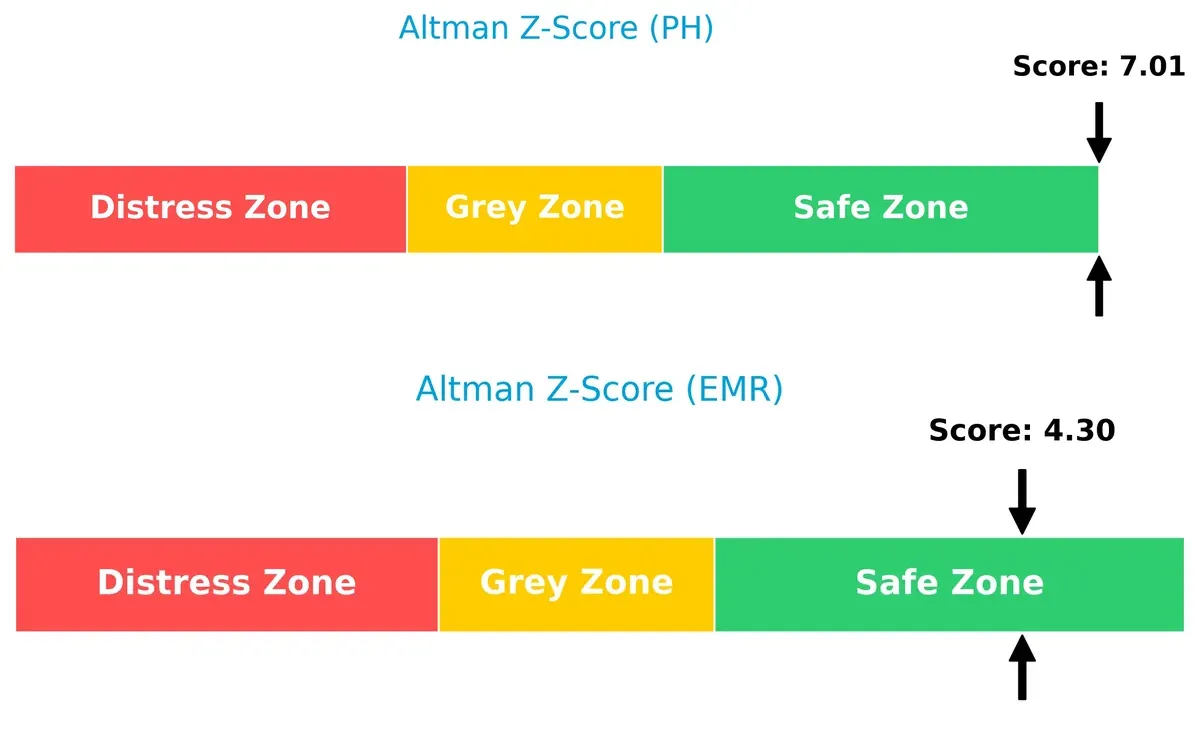
Bankruptcy Risk: Solvency Showdown
Parker-Hannifin’s Altman Z-Score of 7.0 versus Emerson’s 4.3 positions both safely above distress, but Parker’s stronger buffer signals greater resilience in economic downturns:
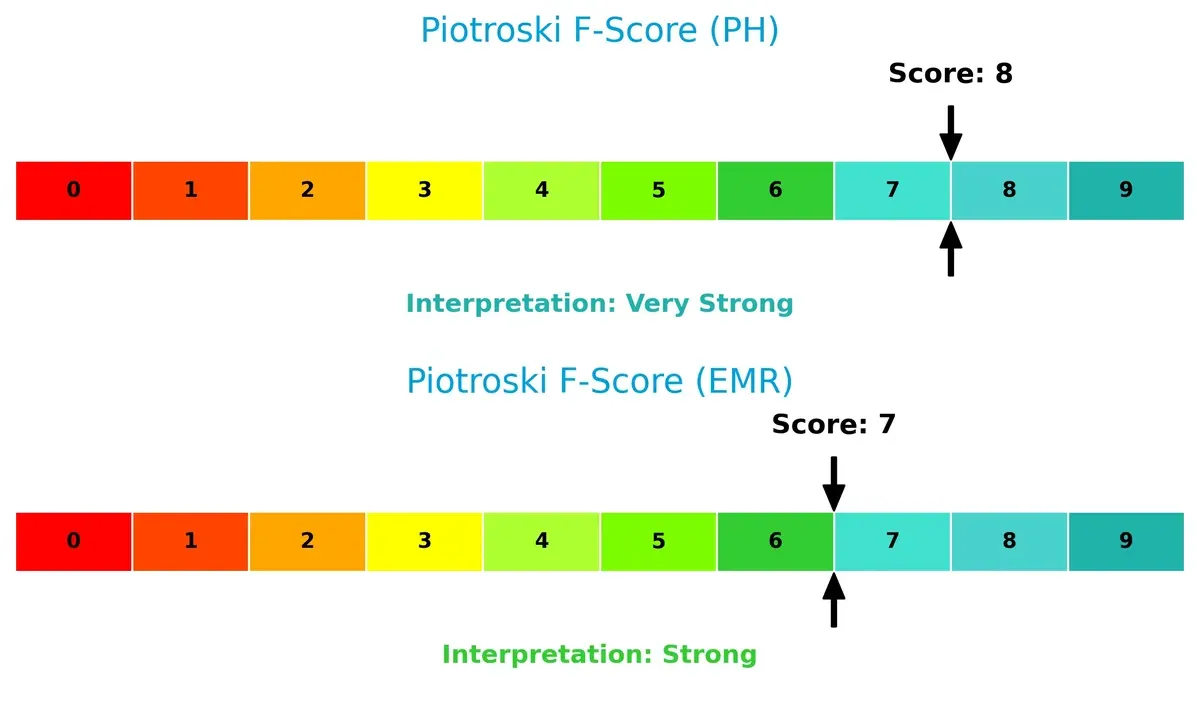
Financial Health: Quality of Operations
Parker-Hannifin’s Piotroski F-Score of 8 outperforms Emerson’s 7, indicating superior financial strength and fewer internal red flags. Both firms are strong, but Parker edges ahead on operational quality:
How are the two companies positioned?
This section dissects the operational DNA of PH and EMR by comparing their revenue distribution and internal dynamics. The goal is to confront their economic moats to identify the most resilient competitive advantage today.
Revenue Segmentation: The Strategic Mix
This visual comparison dissects how Parker-Hannifin and Emerson Electric diversify their income streams and reveals their primary sector bets for 2025:
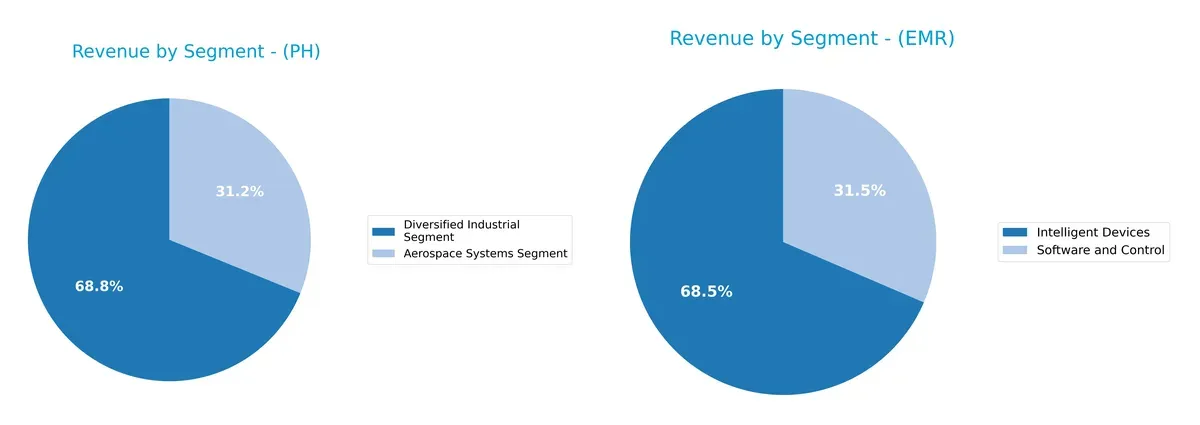
Parker-Hannifin anchors revenue in two segments: $13.7B from Diversified Industrial and $6.2B in Aerospace Systems. Emerson Electric pivots around Intelligent Devices at $12.4B and Software and Control at $5.7B. Emerson’s segments show a broader industrial-software blend, while Parker-Hannifin focuses heavily on industrial infrastructure and aerospace. Emerson’s mix suggests a tech-enabled ecosystem, whereas Parker-Hannifin’s concentration carries more cyclical risk tied to industrial demand.
Strengths and Weaknesses Comparison
This table compares the Strengths and Weaknesses of Parker-Hannifin Corporation and Emerson Electric Co.:
PH Strengths
- Higher net margin at 17.79%
- Strong ROE of 25.81%
- Favorable ROIC at 13.69%
- Solid interest coverage of 11.04
- Diversified Industrial and Aerospace segments
- Significant North America and Europe revenue
EMR Strengths
- Favorable net margin at 12.73%
- Strong interest coverage at 13.38
- Favorable fixed asset turnover at 5.14
- Diverse segments including Intelligent Devices and Software
- Broad geographic presence in Americas and Asia, Middle East & Africa
PH Weaknesses
- Unfavorable PE at 25.38 and PB at 6.55
- Low quick ratio at 0.71
- Dividend yield under 1%
- Neutral current ratio at 1.19
- Asset turnover neutral at 0.67
EMR Weaknesses
- Unfavorable ROIC at 4.6%
- Unfavorable PE at 32.42 and PB at 3.67
- Weak liquidity ratios, current at 0.88 and quick at 0.65
- Unfavorable asset turnover at 0.43
- Dividend yield only neutral at 1.6%
Both companies show diversified product lines and strong geographic footprints. PH’s higher profitability and capital efficiency contrast with EMR’s weaker returns and liquidity. These factors frame their strategic positioning and risk profiles.
The Moat Duel: Analyzing Competitive Defensibility
Only a structural moat protects long-term profits from relentless competition and margin erosion. Let’s dissect Parker-Hannifin and Emerson Electric’s moats:
Parker-Hannifin Corporation: Durable Operational Excellence
Parker-Hannifin’s moat stems from complex engineered solutions and high switching costs, reflected in a robust 4.4% ROIC above WACC and expanding margins. Its diverse industrial and aerospace segments bolster resilience, with innovation in fluid control deepening the moat in 2026.
Emerson Electric Co.: Struggling Scale Advantage
Emerson relies on scale and broad industrial reach but suffers a declining ROIC, 4.2% below WACC. Unlike Parker’s precision niche, Emerson’s margin compression signals vulnerability. However, automation software growth offers a potential but uncertain moat expansion.
ROIC Supremacy vs. Scale Struggles: A Competitive Moat Showdown
Parker-Hannifin boasts the deeper, growing moat through superior capital efficiency and margin stability. Emerson’s shrinking ROIC warns of eroding competitive advantage. Parker is better positioned to defend and grow its market share amid intensifying sector competition.
Which stock offers better returns?
The past year reveals strong price appreciation for both stocks, with Parker-Hannifin showing sharper gains and higher volatility compared to Emerson Electric’s steadier climb. Trading volumes for both have increased, reflecting growing investor interest.
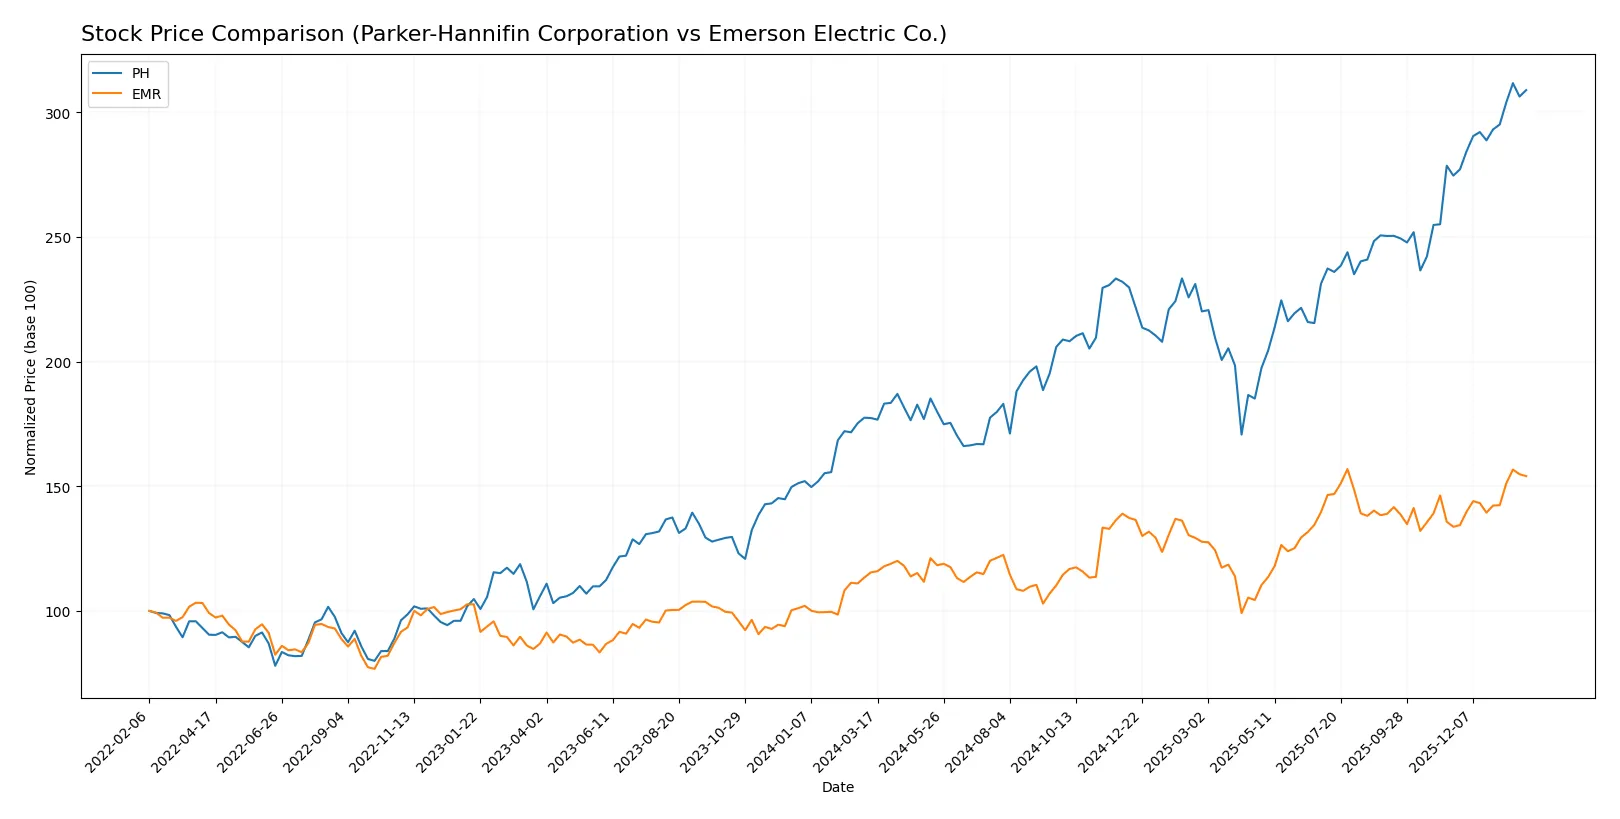
Trend Comparison
Parker-Hannifin’s stock rose 74.16% over the past 12 months, marking a bullish trend with accelerating momentum and a high price range between 503.3 and 944.27. Volatility is elevated, indicated by a standard deviation of 112.58.
Emerson Electric’s stock increased 33.42% in the same period, also bullish with accelerating gains but lower volatility, reflected by a 13.03 standard deviation. The price moved between 94.57 and 149.63, showing steadier growth.
Parker-Hannifin outperformed Emerson Electric, delivering the highest market return with more pronounced price acceleration and volatility during the last year.
Target Prices
Analysts present a clear target consensus for Parker-Hannifin Corporation and Emerson Electric Co.
| Company | Target Low | Target High | Consensus |
|---|---|---|---|
| Parker-Hannifin Corporation | 825 | 1,139 | 995.46 |
| Emerson Electric Co. | 125 | 170 | 149.67 |
The target consensus for Parker-Hannifin suggests moderate upside potential from the current 936 price. Emerson’s consensus also indicates a slight gain above today’s 147 mark, reflecting cautious optimism.

Don’t Let Luck Decide Your Entry Point
Optimize your entry points with our advanced ProRealTime indicators. You’ll get efficient buy signals with precise price targets for maximum performance. Start outperforming now!
How do institutions grade them?
The institutional grading landscape for Parker-Hannifin Corporation and Emerson Electric Co. reveals the following:
Parker-Hannifin Corporation Grades
Below is a summary of recent grades assigned by major financial institutions to Parker-Hannifin:
| Grading Company | Action | New Grade | Date |
|---|---|---|---|
| Wells Fargo | Maintain | Overweight | 2026-01-30 |
| Citigroup | Maintain | Buy | 2026-01-30 |
| JP Morgan | Maintain | Overweight | 2026-01-30 |
| Jefferies | Maintain | Buy | 2026-01-30 |
| Barclays | Maintain | Overweight | 2026-01-30 |
| Stifel | Maintain | Hold | 2026-01-30 |
| Stifel | Maintain | Hold | 2026-01-23 |
| JP Morgan | Maintain | Overweight | 2026-01-16 |
| Morgan Stanley | Maintain | Equal Weight | 2026-01-14 |
| Barclays | Maintain | Overweight | 2026-01-07 |
Emerson Electric Co. Grades
The following table presents recent grades from respected institutions for Emerson Electric Co.:
| Grading Company | Action | New Grade | Date |
|---|---|---|---|
| Oppenheimer | Downgrade | Perform | 2026-01-27 |
| JP Morgan | Maintain | Neutral | 2026-01-16 |
| Barclays | Maintain | Equal Weight | 2026-01-07 |
| Wells Fargo | Maintain | Equal Weight | 2026-01-07 |
| UBS | Upgrade | Buy | 2026-01-05 |
| Jefferies | Downgrade | Hold | 2025-12-10 |
| JP Morgan | Maintain | Neutral | 2025-11-10 |
| Barclays | Maintain | Equal Weight | 2025-11-06 |
| RBC Capital | Maintain | Outperform | 2025-11-06 |
| RBC Capital | Maintain | Outperform | 2025-10-16 |
Which company has the best grades?
Parker-Hannifin consistently earns higher grades such as “Overweight” and “Buy” from multiple institutions. Emerson Electric shows mixed ratings, including downgrades to “Perform” and “Hold.” Investors may interpret Parker-Hannifin’s stronger consensus as a sign of more favorable market sentiment.
Risks specific to each company
The following categories identify critical pressure points and systemic threats facing Parker-Hannifin Corporation and Emerson Electric Co. in the 2026 market environment:
1. Market & Competition
Parker-Hannifin Corporation
- Strong industrial machinery presence but faces pricing pressure and innovation demands.
Emerson Electric Co.
- Diverse technology portfolio yet challenged by slower asset turnover and evolving automation markets.
2. Capital Structure & Debt
Parker-Hannifin Corporation
- Moderate leverage with D/E at 0.69; interest coverage favorable at 11.04x.
Emerson Electric Co.
- Similar leverage at 0.68 D/E; better interest coverage of 13.38x indicates stronger debt service capacity.
3. Stock Volatility
Parker-Hannifin Corporation
- Beta of 1.253 suggests moderate market sensitivity; trading near all-time highs increases risk of correction.
Emerson Electric Co.
- Beta of 1.254 indicates similar volatility; wider price range and recent sharper declines raise caution.
4. Regulatory & Legal
Parker-Hannifin Corporation
- Exposure to aerospace regulations and industrial compliance; no recent legal red flags reported.
Emerson Electric Co.
- Broad industrial and residential product lines expose it to diverse regulatory regimes, increasing compliance complexity.
5. Supply Chain & Operations
Parker-Hannifin Corporation
- Global manufacturing footprint faces raw material cost pressures but benefits from strong supplier relationships.
Emerson Electric Co.
- Larger workforce and global operations increase operational risks and supply disruptions, especially in emerging markets.
6. ESG & Climate Transition
Parker-Hannifin Corporation
- Moderate ESG risks; industrial focus requires ongoing adaptation to emissions and sustainability standards.
Emerson Electric Co.
- Faces higher scrutiny due to residential and commercial products; climate transition could impact longer-term profitability.
7. Geopolitical Exposure
Parker-Hannifin Corporation
- Significant US and global exposure; aerospace segment vulnerable to geopolitical defense spending shifts.
Emerson Electric Co.
- Broad geographic reach including Asia and Middle East adds complexity and political risk to supply and sales.
Which company shows a better risk-adjusted profile?
Parker-Hannifin’s most impactful risk is pricing pressure amid innovation demands in industrial machinery. Emerson’s key risk lies in operational complexity and supply chain vulnerabilities across diverse markets. Parker-Hannifin’s stronger profitability ratios, higher Altman Z-Score (7.01 vs. 4.30), and very strong Piotroski Score (8 vs. 7) signal a better risk-adjusted profile. Emerson’s weaker asset turnover and recent sharper stock declines justify caution despite solid interest coverage and stable leverage.
Final Verdict: Which stock to choose?
Parker-Hannifin’s superpower lies in its durable competitive advantage, demonstrated by a steadily growing ROIC well above its cost of capital. It excels as a value creator with robust profitability and operational efficiency. The main point of vigilance is its elevated valuation multiples, which might temper near-term upside. This makes it suitable for aggressive growth portfolios willing to pay for quality.
Emerson Electric commands a strategic moat in its diversified industrial footprint and stable cash flow generation. Relative to Parker-Hannifin, it offers a more conservative safety profile despite weaker capital efficiency and shrinking returns. Emerson fits well in GARP portfolios focused on steady growth with moderate risk tolerance.
If you prioritize sustained value creation and premium operational efficiency, Parker-Hannifin outshines Emerson despite its higher valuation. However, if you seek better stability and a defensive stance in industrials, Emerson offers a more measured risk-return balance. Both present viable analytical scenarios depending on your risk appetite and investment horizon.
Disclaimer: Investment carries a risk of loss of initial capital. The past performance is not a reliable indicator of future results. Be sure to understand risks before making an investment decision.
Go Further
I encourage you to read the complete analyses of Parker-Hannifin Corporation and Emerson Electric Co. to enhance your investment decisions: