Home > Comparison > Industrials > EMR vs OTIS
The strategic rivalry between Emerson Electric Co. and Otis Worldwide Corporation shapes the industrial machinery landscape. Emerson operates as a diversified technology and engineering powerhouse across automation and commercial solutions. Otis focuses on manufacturing, installing, and servicing elevators and escalators globally. This analysis contrasts Emerson’s broad industrial footprint with Otis’s specialized service model to identify which offers superior risk-adjusted returns for a balanced portfolio amid evolving market dynamics.
Table of contents
Companies Overview
Emerson Electric and Otis Worldwide dominate key segments of the global industrial machinery market.
Emerson Electric Co.: Engineering Innovation Powerhouse
Emerson Electric Co. leads as a technology and engineering company providing industrial automation and commercial solutions worldwide. Its core revenue stems from Automation Solutions and Commercial & Residential Solutions, serving diverse sectors like oil and gas, power generation, and HVAC. In 2026, Emerson focuses strategically on integrated process control and energy-efficient building technologies to drive growth.
Otis Worldwide Corporation: Elevating Urban Mobility
Otis Worldwide specializes in manufacturing and servicing elevators and escalators globally, with a strong presence in the US and China. Its revenue relies on New Equipment sales and a vast Service network performing maintenance and modernization. The 2026 strategy emphasizes expanding its service footprint and modernizing infrastructure to capture rising urban development demand.
Strategic Collision: Similarities & Divergences
Both companies operate in industrial machinery but differ sharply in business philosophy. Emerson pursues a broad technology-driven portfolio across sectors, while Otis focuses on a niche vertical with a service-heavy model. Their primary battleground lies in building infrastructure innovation and operational efficiency. These distinctions create contrasting investment profiles: Emerson offers diversified industrial exposure, whereas Otis provides targeted urban mobility growth.
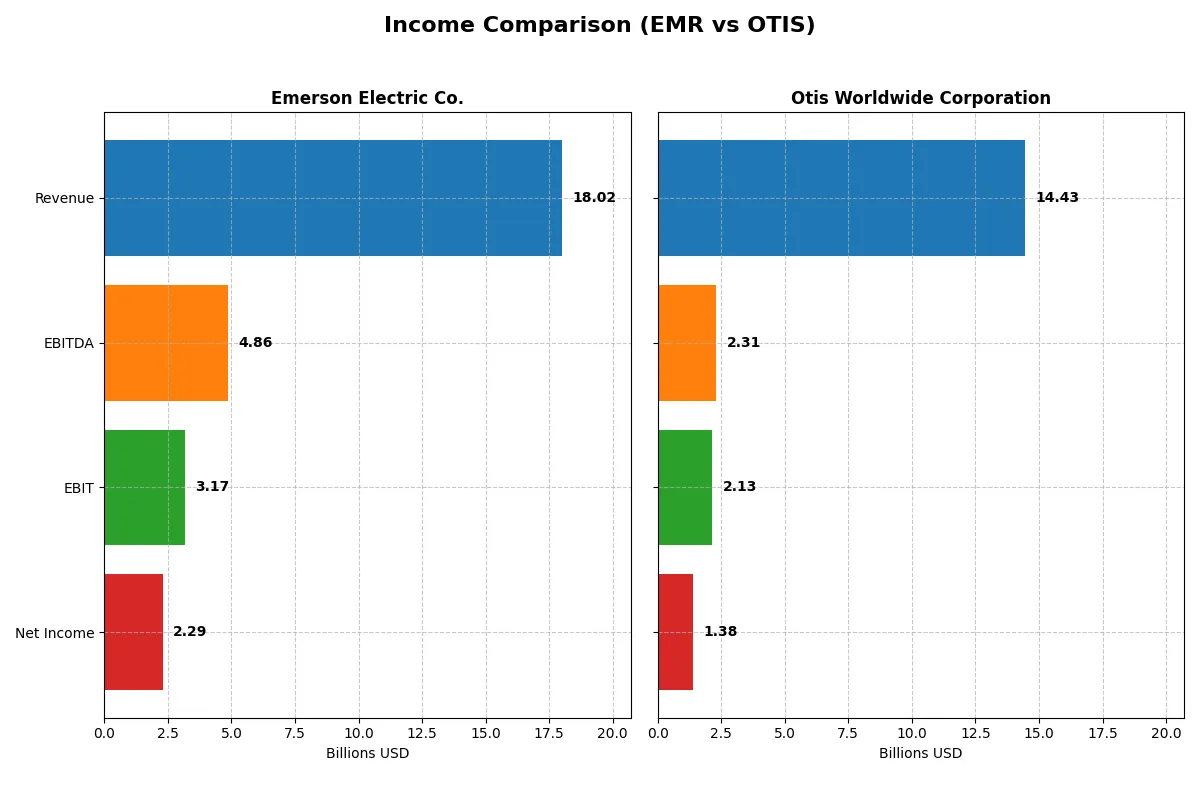
Income Statement Comparison
This data dissects the core profitability and scalability of both corporate engines to reveal who dominates the bottom line:
| Metric | Emerson Electric Co. (EMR) | Otis Worldwide Corporation (OTIS) |
|---|---|---|
| Revenue | 18.0B | 14.4B |
| Cost of Revenue | 8.5B | 10.1B |
| Operating Expenses | 7.3B | 2.2B |
| Gross Profit | 9.5B | 4.4B |
| EBITDA | 4.9B | 2.3B |
| EBIT | 3.2B | 2.1B |
| Interest Expense | 387M | 196M |
| Net Income | 2.3B | 1.4B |
| EPS | 4.06 | 3.53 |
| Fiscal Year | 2025 | 2025 |
Income Statement Analysis: The Bottom-Line Duel
This income statement comparison reveals which company runs a more efficient and profitable corporate engine in recent years.
Emerson Electric Co. Analysis
Emerson Electric’s revenue rose steadily from 13.0B in 2021 to 18.0B in 2025, a strong 39% overall gain. Net income, however, showed volatility with a peak in 2023 due to discontinued operations, settling at 2.3B in 2025. Gross and net margins remain healthy at 52.8% and 12.7%, reflecting effective cost control and solid profitability momentum in the latest year.
Otis Worldwide Corporation Analysis
Otis’s revenue grew modestly from 14.3B in 2021 to 14.4B in 2025, nearly flat over five years. Net income increased steadily to 1.38B in 2025, demonstrating consistent bottom-line growth. Despite a lower gross margin of 30.3%, Otis maintains a respectable net margin near 9.6%. Its margin stability and gradual earnings improvement suggest efficient expense management amid limited top-line expansion.
Margin Power vs. Revenue Scale
Emerson outpaces Otis in revenue growth and margin expansion, boasting a wider moat with superior gross and net margins. Otis delivers steadier net income growth but lacks Emerson’s scale and profitability leverage. For investors prioritizing margin strength and growth momentum, Emerson’s profile stands out as the more compelling fundamental performer.
Financial Ratios Comparison
These vital ratios act as a diagnostic tool to expose the underlying fiscal health, valuation premiums, and capital efficiency of each company:
| Ratios | Emerson Electric Co. (EMR) | Otis Worldwide Corporation (OTIS) |
|---|---|---|
| ROE | 11.31% | -25.67% |
| ROIC | 4.60% | 40.74% |
| P/E | 32.42 | 24.85 |
| P/B | 3.67 | -6.38 |
| Current Ratio | 0.88 | 0.85 |
| Quick Ratio | 0.65 | 0.77 |
| D/E (Debt-to-Equity) | 0.68 | -1.62 |
| Debt-to-Assets | 32.79% | 82.14% |
| Interest Coverage | 5.78 | 11.20 |
| Asset Turnover | 0.43 | 1.35 |
| Fixed Asset Turnover | 5.14 | 11.13 |
| Payout Ratio | 52.0% | 46.7% |
| Dividend yield | 1.60% | 1.88% |
| Fiscal Year | 2025 | 2025 |
Efficiency & Valuation Duel: The Vital Signs
Ratios act as a company’s DNA, uncovering hidden risks and operational strength beyond surface numbers.
Emerson Electric Co.
Emerson posts a solid net margin of 12.7% and a neutral ROE at 11.3%, but its ROIC at 4.6% lags behind its WACC of 8.8%, signaling inefficiency. The stock appears stretched with a high P/E of 32.4 and P/B of 3.67. Dividend yield stands at 1.6%, reflecting moderate shareholder returns.
Otis Worldwide Corporation
Otis delivers a strong ROIC of 40.7% and a favorable WACC of 7.4%, indicating efficient capital use despite a negative ROE of -25.7%. Its valuation is more reasonable with a P/E of 24.9 and a positive P/B. Dividend yield is slightly higher at 1.9%, signaling steady income despite mixed profitability metrics.
Operational Efficiency vs. Valuation Stretch
Otis offers superior capital efficiency and a more balanced valuation profile compared to Emerson’s stretched multiples and weaker ROIC. Investors prioritizing operational discipline may prefer Otis, while Emerson fits those comfortable with premium valuations and steady dividends.
Which one offers the Superior Shareholder Reward?
I compare Emerson Electric Co. (EMR) and Otis Worldwide Corporation (OTIS) based on dividend yields, payout ratios, and buyback intensity. EMR yields 1.6% with a 52% payout ratio, supported by strong free cash flow coverage (86%). Its buyback programs have been moderate but consistent, enhancing total returns. OTIS yields slightly less at 1.9%, with a lower payout ratio near 37%, indicating room for reinvestment or buybacks. OTIS’s buyback activity is less transparent but free cash flow conversion is strong (90%), supporting dividend sustainability. Historically, EMR’s balanced dividend and buyback mix offers a more reliable shareholder reward. I conclude EMR provides the superior total return profile in 2026 due to its sustainable payout and disciplined capital allocation.
Comparative Score Analysis: The Strategic Profile
The radar chart reveals the fundamental DNA and trade-offs of Emerson Electric Co. and Otis Worldwide Corporation:
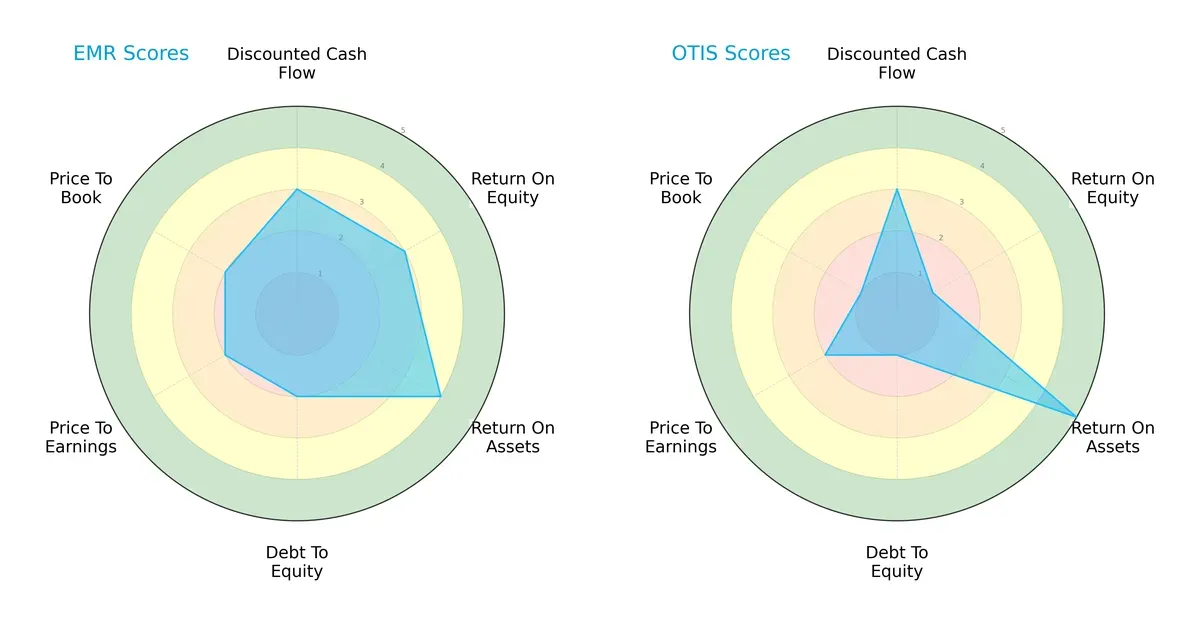
Emerson Electric exhibits a more balanced profile with moderate DCF and ROE scores, strong ROA, but weaker debt and valuation metrics. Otis relies on a standout ROA score but suffers from poor equity returns, high leverage, and undervaluation concerns. Emerson’s blend suggests stability; Otis leans on operational efficiency but carries financial risks.
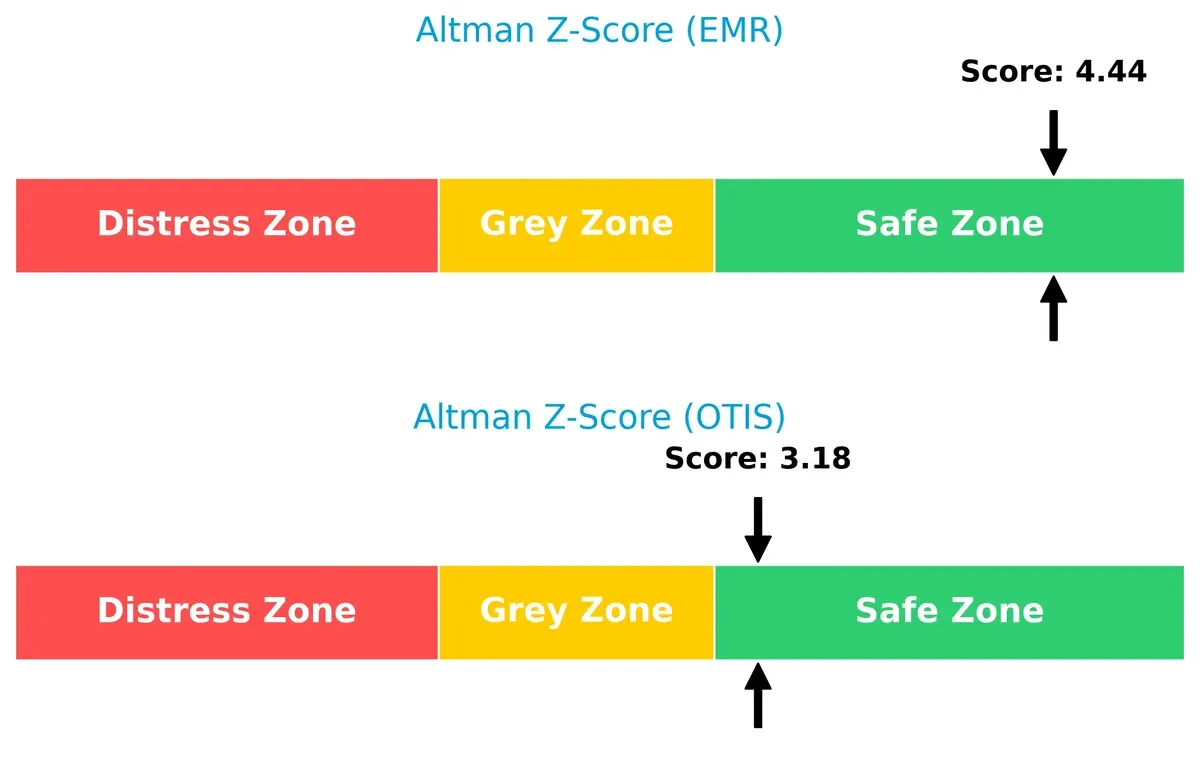
Bankruptcy Risk: Solvency Showdown
Emerson’s higher Altman Z-Score (4.44) compared to Otis (3.18) indicates stronger financial resilience and lower bankruptcy risk in this cycle:
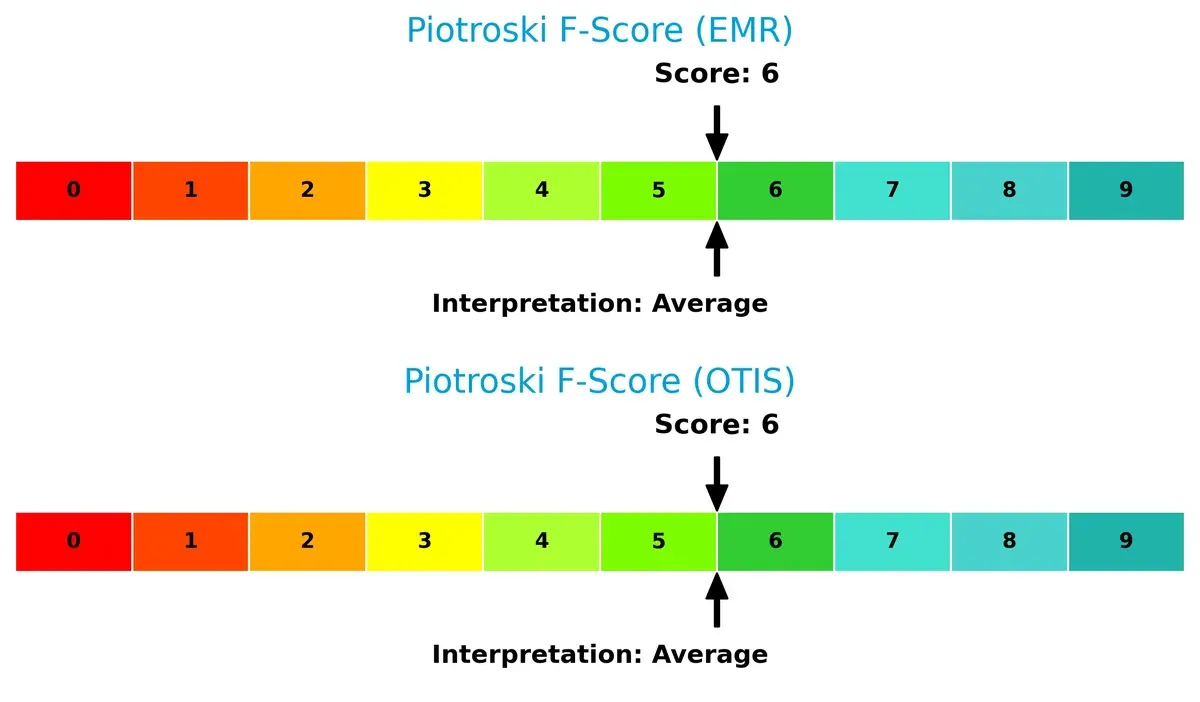
Financial Health: Quality of Operations
Both companies share an average Piotroski F-Score of 6, reflecting moderate financial health without alarming red flags:
How are the two companies positioned?
This section dissects Emerson Electric Co. and Otis Worldwide’s operational DNA by comparing revenue distribution and internal dynamics. The goal is to confront their economic moats, revealing which model offers the most resilient competitive advantage today.
Revenue Segmentation: The Strategic Mix
This comparison dissects how Emerson Electric Co. and Otis Worldwide Corporation diversify their income streams and where their primary sector bets lie:
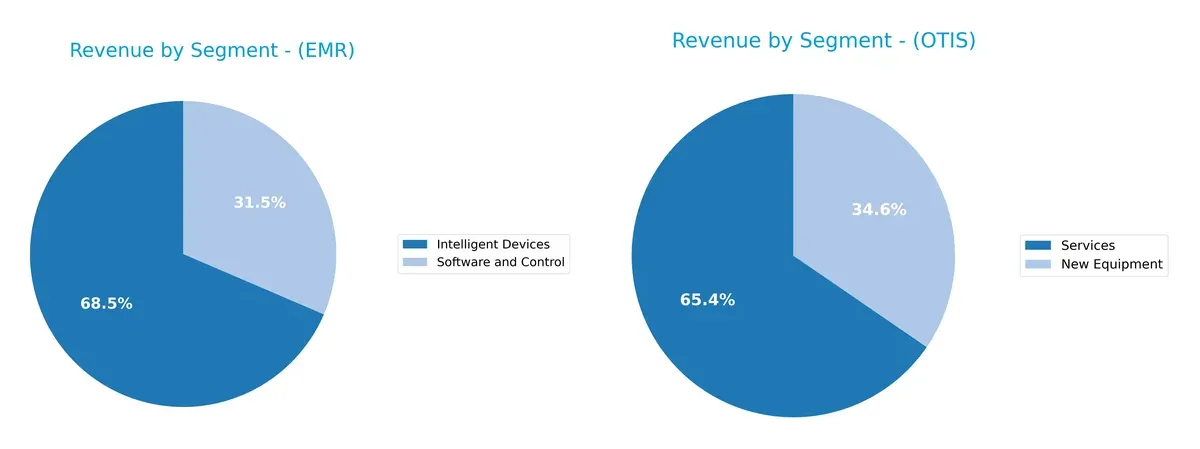
Emerson Electric Co. anchors its revenue in Intelligent Devices at $12.4B and Software and Control at $5.7B, showing a moderately diversified portfolio. Otis Worldwide leans heavily on Services at $9.4B, dwarfing New Equipment at $5B, revealing a dominant service-driven model. Emerson’s mix suggests a balanced technology and product ecosystem, while Otis’s concentration highlights infrastructure lock-in but raises concentration risk on service demand fluctuations.
Strengths and Weaknesses Comparison
This table compares the Strengths and Weaknesses of Emerson Electric Co. (EMR) and Otis Worldwide Corporation (OTIS):
EMR Strengths
- Diverse revenue streams across Intelligent Devices and Software & Control
- Favorable net margin of 12.73%
- Strong interest coverage at 8.19
- High fixed asset turnover at 5.14
- Solid global presence with robust Americas and Asia revenues
OTIS Strengths
- Very high ROIC at 40.74%, indicating efficient capital use
- Favorable WACC at 7.37%
- Strong asset turnover at 1.35 and fixed asset turnover at 11.13
- Positive debt to equity and favorable PB ratio
- Leading interest coverage ratio at 10.88
EMR Weaknesses
- Below par liquidity with current ratio 0.88 and quick ratio 0.65
- ROIC at 4.6% below WACC at 8.84%, indicating weak capital returns
- Unfavorable P/E and P/B ratios
- Low asset turnover at 0.43
- Slightly unfavorable global financial ratios overall
OTIS Weaknesses
- Negative ROE at -25.67%, signaling profitability challenges
- High debt to assets at 82.14%, implying financial risk
- Below ideal liquidity ratios with current 0.85 and quick 0.77
- Negative debt to equity ratio, unusual financial structure
- Some unfavorable debt metrics despite overall favorable ratios
Overall, EMR shows diversified operations and solid profitability but struggles with capital efficiency and liquidity. OTIS excels in return on invested capital and asset efficiency but faces challenges in profitability and carries high leverage. Both companies must navigate their financial constraints carefully to sustain strategic growth.
The Moat Duel: Analyzing Competitive Defensibility
A structural moat is the only reliable barrier protecting long-term profits from relentless competitive erosion in any industry:
Emerson Electric Co.: Intangible Assets and Diversified Industrial Expertise
Emerson’s moat stems from deep engineering know-how and broad industrial product lines. This manifests in solid margin stability despite revenue growth challenges. New automation tech could deepen its edge in 2026 but declining ROIC warns of value erosion.
Otis Worldwide Corporation: Service Network and Customer Switching Costs
Otis builds its moat on an extensive service network and sticky maintenance contracts. Its rising ROIC confirms efficient capital use and growing profitability. Expansion into smart elevators and modernization services offers growth and competitive disruption potential.
Intangible Assets vs. Service Lock-In: The Moat Showdown
Otis holds the deeper moat with a 33% ROIC surplus over WACC and a rising trend, signaling robust value creation. Emerson’s declining ROIC and value destruction leave it vulnerable. Otis is better positioned to defend and grow market share through service-driven customer lock-in.
Which stock offers better returns?
Over the past year, Emerson Electric Co. surged 42.3%, showing accelerating gains and strong buyer dominance. Otis Worldwide Corporation declined 8.8%, despite recent slight upward momentum.
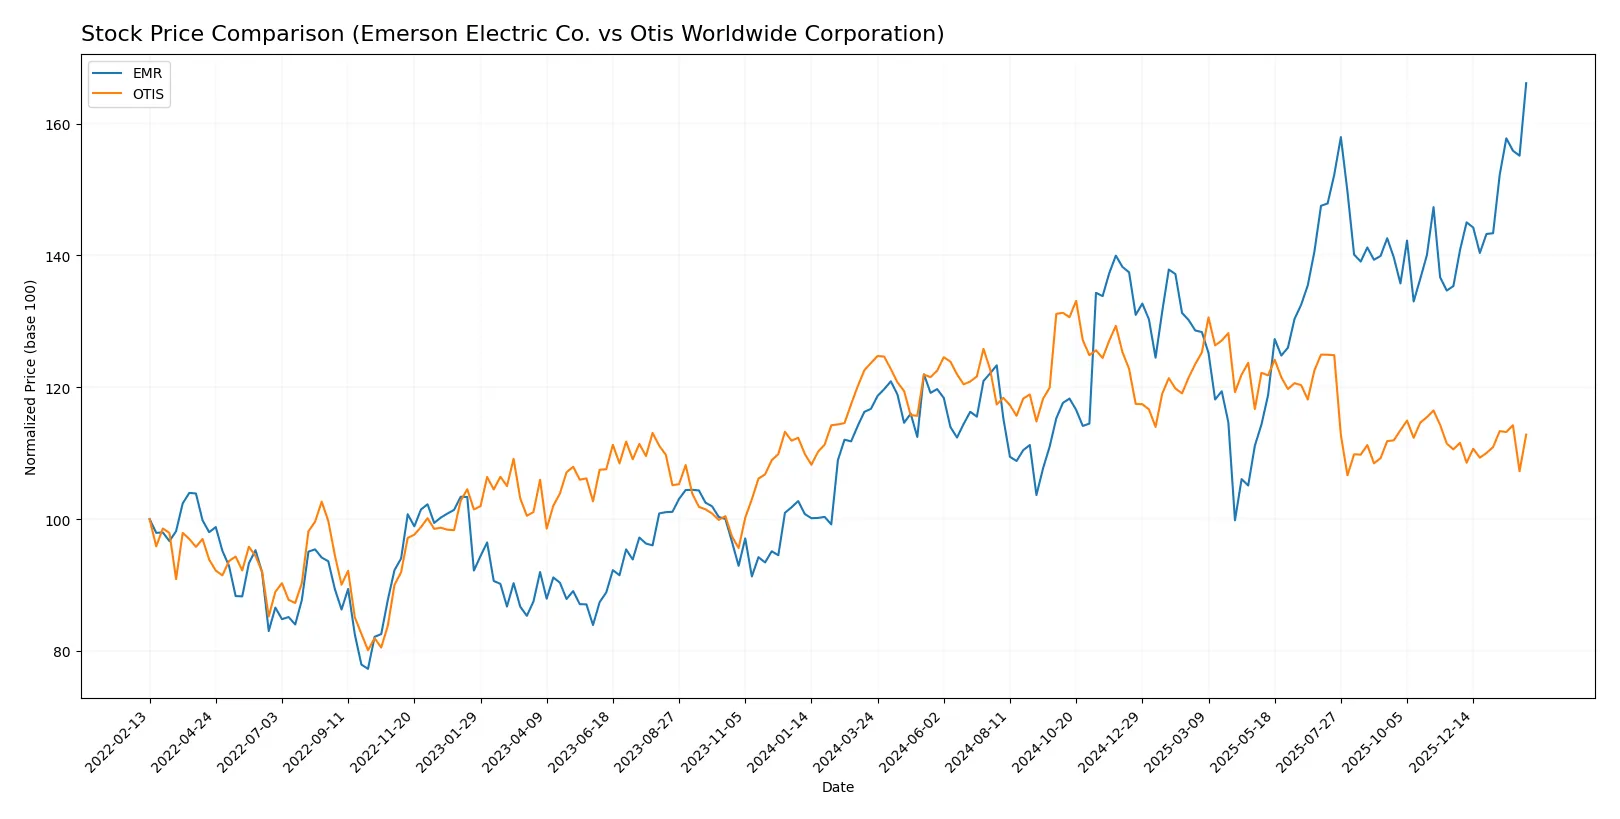
Trend Comparison
Emerson Electric Co. posts a bullish trend with a 42.3% price rise over 12 months. The trend accelerates, hitting a high of 157.38 and a low of 94.57, with notable volatility (std dev 13.47).
Otis Worldwide Corporation exhibits a bearish 8.8% decline over the same period. Despite recent minor gains, it shows acceleration amid lower volatility (std dev 4.88) and a high of 106.01.
Emerson Electric clearly outperforms Otis, delivering the highest market return and stronger price momentum in the last year.
Target Prices
Analysts present a constructive outlook with solid target price ranges for Emerson Electric Co. and Otis Worldwide Corporation.
| Company | Target Low | Target High | Consensus |
|---|---|---|---|
| Emerson Electric Co. | 125 | 185 | 163.64 |
| Otis Worldwide Corp. | 92 | 109 | 97.75 |
Emerson’s consensus target of 164 slightly exceeds its current 157 price, suggesting moderate upside. Otis’s consensus target near 98 is notably above its 90 current price, indicating potential appreciation.

Don’t Let Luck Decide Your Entry Point
Optimize your entry points with our advanced ProRealTime indicators. You’ll get efficient buy signals with precise price targets for maximum performance. Start outperforming now!
How do institutions grade them?
The following tables summarize recent institutional grades for Emerson Electric Co. and Otis Worldwide Corporation:
Emerson Electric Co. Grades
This table shows Emerson Electric Co.’s latest ratings from major grading firms.
| Grading Company | Action | New Grade | Date |
|---|---|---|---|
| Evercore ISI Group | maintain | Outperform | 2026-02-05 |
| Deutsche Bank | downgrade | Hold | 2026-02-05 |
| Wells Fargo | maintain | Equal Weight | 2026-02-04 |
| Citigroup | maintain | Buy | 2026-02-04 |
| Oppenheimer | downgrade | Perform | 2026-01-27 |
| JP Morgan | maintain | Neutral | 2026-01-16 |
| Wells Fargo | maintain | Equal Weight | 2026-01-07 |
| Barclays | maintain | Equal Weight | 2026-01-07 |
| UBS | upgrade | Buy | 2026-01-05 |
| Jefferies | downgrade | Hold | 2025-12-10 |
Otis Worldwide Corporation Grades
This table displays Otis Worldwide Corporation’s recent analyst ratings from recognized firms.
| Grading Company | Action | New Grade | Date |
|---|---|---|---|
| JP Morgan | maintain | Overweight | 2026-01-16 |
| Wells Fargo | maintain | Equal Weight | 2025-12-15 |
| Barclays | maintain | Underweight | 2025-10-30 |
| JP Morgan | maintain | Overweight | 2025-10-15 |
| Wolfe Research | upgrade | Outperform | 2025-10-08 |
| Wells Fargo | maintain | Equal Weight | 2025-10-06 |
| JP Morgan | maintain | Overweight | 2025-09-18 |
| RBC Capital | maintain | Outperform | 2025-07-28 |
| Wolfe Research | upgrade | Peer Perform | 2025-07-25 |
| JP Morgan | maintain | Overweight | 2025-07-24 |
Which company has the best grades?
Otis Worldwide Corporation holds consistently positive ratings, often “Overweight” or “Outperform.” Emerson Electric Co. shows a mix of “Buy,” “Hold,” and “Equal Weight” grades with some recent downgrades. Investors may interpret Otis’s stronger consensus grades as signaling relatively higher confidence by analysts.
Risks specific to each company
The following categories identify critical pressure points and systemic threats facing Emerson Electric Co. and Otis Worldwide Corporation in the 2026 market environment:
1. Market & Competition
Emerson Electric Co.
- Faces intense industrial machinery competition with pressure on margins despite diversified segments.
Otis Worldwide Corporation
- Operates in a specialized elevator market with stable demand but limited growth potential.
2. Capital Structure & Debt
Emerson Electric Co.
- Moderate leverage (D/E 0.68) with neutral debt-to-assets; interest coverage favorable at 8.19x.
Otis Worldwide Corporation
- High debt burden (D/A 82.14%), negative D/E ratio signals complex capital structure risks.
3. Stock Volatility
Emerson Electric Co.
- Beta of 1.249 indicates above-market volatility; price range shows wider fluctuation potential.
Otis Worldwide Corporation
- Lower beta at 1.012, reflecting more stable price movements relative to the market.
4. Regulatory & Legal
Emerson Electric Co.
- Exposure to global industrial regulations across multiple sectors increases compliance complexity.
Otis Worldwide Corporation
- Faces stringent safety and building codes impacting product design and service operations.
5. Supply Chain & Operations
Emerson Electric Co.
- Complex global supply chain with risk from raw material price volatility and geopolitical disruptions.
Otis Worldwide Corporation
- Operational risks concentrated on maintenance network efficiency and parts availability.
6. ESG & Climate Transition
Emerson Electric Co.
- ESG initiatives challenged by energy-intensive industrial segments; transition costs remain significant.
Otis Worldwide Corporation
- ESG focus on sustainable building technologies offers growth but requires capital investment.
7. Geopolitical Exposure
Emerson Electric Co.
- Diverse geographic footprint exposes it to trade tensions and regulatory shifts in multiple regions.
Otis Worldwide Corporation
- Global presence but concentrated exposure to urban infrastructure trends and regional economic cycles.
Which company shows a better risk-adjusted profile?
Emerson Electric’s most impactful risk is its unfavorable liquidity ratios, signaling potential short-term financial strain. Otis’ critical risk lies in its high debt-to-assets ratio, raising solvency concerns despite strong operational metrics. Otis shows a better risk-adjusted profile, supported by a safer Altman Z-Score and higher ROIC, reflecting stronger capital efficiency despite leverage risks. Recent data highlight Otis’ superior asset turnover (1.35 vs. 0.43) as a key operational strength mitigating its debt risk.
Final Verdict: Which stock to choose?
Emerson Electric Co. showcases a superpower in operational efficiency, consistently delivering strong margins and accelerating earnings growth. Its main point of vigilance lies in a declining return on invested capital, signaling potential value erosion over time. This stock might best suit an aggressive growth portfolio willing to tolerate some strategic risk.
Otis Worldwide Corporation’s strategic moat is its exceptional capital efficiency and robust return on invested capital, pointing to a sustainable competitive advantage. Compared to Emerson, Otis offers better stability but carries risks from high leverage and weaker equity returns. It appears fitting for investors seeking growth at a reasonable price with a focus on durable profitability.
If you prioritize operational excellence and rapid earnings acceleration, Emerson Electric Co. stands out due to its margin expansion and bullish price momentum. However, if you seek long-term stability backed by a strong economic moat, Otis offers superior capital returns and value creation despite recent price softness. Both cases warrant careful risk assessment aligned with your investment profile.
Disclaimer: Investment carries a risk of loss of initial capital. The past performance is not a reliable indicator of future results. Be sure to understand risks before making an investment decision.
Go Further
I encourage you to read the complete analyses of Emerson Electric Co. and Otis Worldwide Corporation to enhance your investment decisions: