In the dynamic industrial machinery sector, Emerson Electric Co. (EMR) and Kadant Inc. (KAI) stand out as key players with overlapping markets and complementary innovation strategies. Emerson, a global technology leader, delivers comprehensive automation and commercial solutions, while Kadant focuses on specialized flow control and material handling technologies. This comparison will help investors identify which company offers the most compelling opportunity in today’s evolving industrial landscape. Let’s explore which stock deserves a place in your portfolio.
Table of contents
Companies Overview
I will begin the comparison between Emerson Electric Co. and Kadant Inc. by providing an overview of these two companies and their main differences.
Emerson Electric Co. Overview
Emerson Electric Co. is a technology and engineering company providing diverse solutions across industrial, commercial, and residential markets globally. It operates through Automation Solutions and Commercial & Residential Solutions segments, serving sectors such as oil and gas, power generation, and HVAC systems. Headquartered in Saint Louis, Missouri, Emerson emphasizes innovation in measurement, control systems, and environmental technologies with a workforce of 73K employees.
Kadant Inc. Overview
Kadant Inc. supplies engineered systems and technologies worldwide, focusing on Flow Control, Industrial Processing, and Material Handling segments. Its products include fluid-handling systems, processing equipment for packaging and wood products industries, and biodegradable absorbents. Based in Westford, Massachusetts, Kadant employs 3.5K people and targets specialized industrial markets, blending automation and environmental products for operational efficiency.
Key similarities and differences
Both Emerson and Kadant operate within the industrial machinery sector and serve global markets with engineered solutions. Emerson has a broader product portfolio spanning multiple industries and market segments, supported by a significantly larger workforce and market cap. Kadant, smaller in scale, concentrates on niche segments like flow control and material handling with specialized equipment and consumables, positioning itself distinctively in industrial processing and sustainability-related products.
Income Statement Comparison
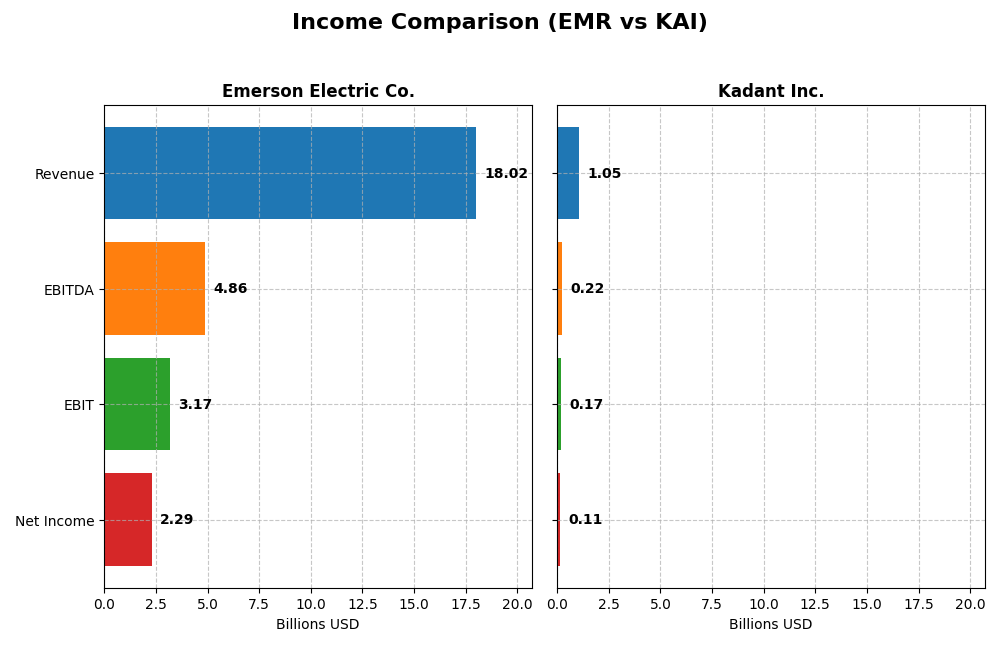
The table below compares the key income statement metrics for Emerson Electric Co. and Kadant Inc. for their most recent fiscal years, providing a snapshot of their financial performance.
| Metric | Emerson Electric Co. | Kadant Inc. |
|---|---|---|
| Market Cap | 81B | 3.8B |
| Revenue | 18.0B | 1.05B |
| EBITDA | 4.86B | 223M |
| EBIT | 3.17B | 173M |
| Net Income | 2.29B | 112M |
| EPS | 4.06 | 9.51 |
| Fiscal Year | 2025 | 2024 |
Income Statement Interpretations
Emerson Electric Co.
Emerson Electric Co. shows a steady revenue increase from $12.9B in 2021 to $18.0B in 2025, reflecting a 39.3% growth overall. Net income, however, is volatile, peaking at $13.2B in 2023 due to discontinued operations, then normalizing to $2.29B in 2025. Margins improved in 2025 with a gross margin of 52.8% and net margin at 12.7%, signaling enhanced profitability despite slower revenue growth last year.
Kadant Inc.
Kadant Inc. displays consistent revenue growth from $635M in 2020 to $1.05B in 2024, a 65.9% increase. Net income rose steadily, doubling from $55M in 2020 to $112M in 2024. Margins are stable with a 44.3% gross margin and a 10.6% net margin in 2024. However, net margin declined slightly in the latest year despite positive revenue and gross profit growth, indicating rising operational costs.
Which one has the stronger fundamentals?
Both companies hold favorable income statement evaluations with around 71% favorable metrics. Emerson excels in margin quality and earnings growth but faces net income volatility and slower recent revenue growth. Kadant shows stronger overall revenue and net income growth with stable margins but slight net margin compression last year. Fundamentally, both demonstrate solid performance with different strengths and weaknesses.
Financial Ratios Comparison
The table below presents the most recent financial ratios for Emerson Electric Co. (EMR) and Kadant Inc. (KAI), enabling a direct comparison of key performance and financial health metrics as of their latest fiscal year.
| Ratios | Emerson Electric Co. (EMR) (2025 FY) | Kadant Inc. (KAI) (2024 FY) |
|---|---|---|
| ROE | 11.30% | 13.17% |
| ROIC | 4.62% | 10.08% |
| P/E | 32.42 | 36.90 |
| P/B | 3.66 | 4.86 |
| Current Ratio | 0.88 | 2.31 |
| Quick Ratio | 0.65 | 1.55 |
| D/E (Debt to Equity) | 0.65 | 0.38 |
| Debt-to-Assets | 31.26% | 22.57% |
| Interest Coverage | 9.44 | 8.55 |
| Asset Turnover | 0.43 | 0.74 |
| Fixed Asset Turnover | 6.28 | 6.18 |
| Payout ratio | 52.0% | 13.1% |
| Dividend yield | 1.60% | 0.36% |
Interpretation of the Ratios
Emerson Electric Co.
Emerson Electric Co. shows mixed financial ratios with some strengths in net margin (12.73%) and interest coverage (13.38), signaling decent profitability and debt servicing ability. However, concerns arise from unfavorable ROIC (4.62%), PE (32.42), PB (3.66), and liquidity ratios, including a low current ratio (0.88). The company pays dividends with a neutral yield of 1.6%, indicating steady but moderate shareholder returns.
Kadant Inc.
Kadant Inc. demonstrates generally favorable ratios, including solid net margin (10.59%), ROIC (10.08%), and strong liquidity with current and quick ratios above 1.5. Its leverage ratios are also favorable, with a debt-to-assets of 22.57%. Despite a high PE (36.9) and low dividend yield (0.36%), Kadant maintains a favorable overall ratio profile, supporting consistent though modest shareholder returns.
Which one has the best ratios?
Kadant Inc. presents a more favorable ratio profile overall, with a majority of metrics rated positively, especially in liquidity and return on invested capital. Emerson Electric Co. faces several unfavorable ratios, particularly in liquidity and valuation, resulting in a slightly unfavorable rating. Thus, Kadant’s ratios are comparatively stronger by these measures.
Strategic Positioning
This section compares the strategic positioning of Emerson Electric Co. and Kadant Inc., including their market position, key segments, and exposure to technological disruption:
Emerson Electric Co.
- Large industrial machinery player with global reach facing varied competitive pressures.
- Diversified segments: Automation Solutions and Commercial & Residential Solutions drive revenues.
- Operates in technology and engineering with broad solutions, moderate exposure to tech disruption.
Kadant Inc.
- Smaller industrial machinery firm focusing on niche engineered systems markets.
- Concentrated segments: Flow Control, Industrial Processing, and Material Handling.
- Supplies specialized fluid-handling and processing systems, limited tech disruption noted.
Emerson Electric Co. vs Kadant Inc. Positioning
Emerson Electric Co. follows a diversified approach across multiple industrial and residential markets, enabling broader revenue streams but facing complex competitive dynamics. Kadant Inc. focuses on specialized niche markets, potentially allowing deeper expertise but with narrower exposure and scale.
Which has the best competitive advantage?
Kadant shows a slightly favorable moat with growing profitability, indicating improving competitive positioning. Emerson currently has a very unfavorable moat evaluation with declining profitability, suggesting challenges in sustaining a competitive advantage.
Stock Comparison
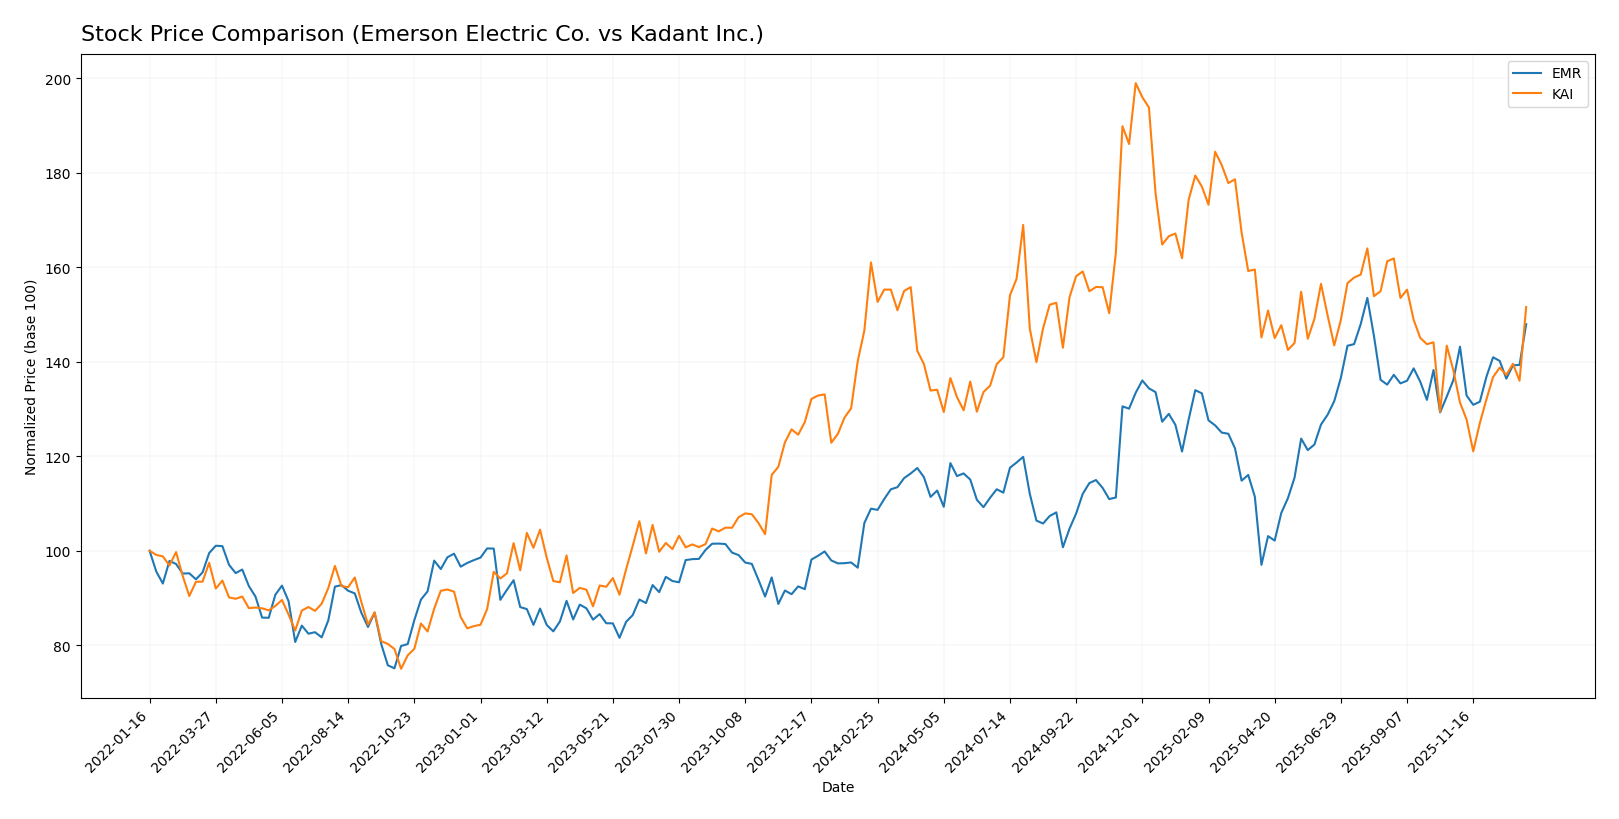
The stock price movements of Emerson Electric Co. (EMR) and Kadant Inc. (KAI) over the past 12 months reveal contrasting trends, with EMR showing strong gains and KAI experiencing a decline, alongside notable trading volume dynamics.
Trend Analysis
Emerson Electric Co. (EMR) stock shows a bullish trend over the past 12 months with a 35.86% price increase, accelerating upwards from a low of 94.57 to a high of 149.63, supported by moderate volatility (12.39 std deviation).
Kadant Inc. (KAI) stock exhibits a bearish trend over the same period, declining by 5.85% despite acceleration, with a wide price range between 254.91 and 419.01 and higher volatility (34.44 std deviation).
Comparing both, EMR has delivered the highest market performance with a significant positive price change, whereas KAI experienced a negative overall trend despite recent short-term gains.
Target Prices
The current analyst consensus reveals optimistic target prices for both Emerson Electric Co. and Kadant Inc.
| Company | Target High | Target Low | Consensus |
|---|---|---|---|
| Emerson Electric Co. | 170 | 125 | 149.67 |
| Kadant Inc. | 410 | 275 | 342.5 |
Analysts expect Emerson Electric’s price to slightly appreciate from $144.22 to around $149.67, while Kadant Inc. shows stronger upside potential from $319.23 to $342.5. Both stocks reflect positive market sentiment with room for growth.
Analyst Opinions Comparison
This section compares analysts’ ratings and grades for Emerson Electric Co. and Kadant Inc.:
Rating Comparison
EMR Rating
- Rating: Both EMR and KAI have a “B” rating, considered very favorable.
- Discounted Cash Flow Score: EMR has a moderate score of 3, indicating fair valuation based on future cash flows.
- ROE Score: EMR’s return on equity score is 3, reflecting moderate profit efficiency.
- ROA Score: EMR scores 4, a favorable rating for effective asset utilization.
- Debt To Equity Score: EMR’s score is 2, indicating moderate financial risk.
- Overall Score: EMR has an overall moderate score of 3, reflecting balanced financial health.
KAI Rating
- Rating: Both EMR and KAI have a “B” rating, considered very favorable.
- Discounted Cash Flow Score: KAI also scores 3, showing a similar moderate valuation perspective.
- ROE Score: KAI matches EMR with a score of 3, indicating similar shareholder profit efficiency.
- ROA Score: KAI also scores 4, equally favorable in asset use efficiency.
- Debt To Equity Score: KAI scores 3, suggesting slightly higher financial leverage risk.
- Overall Score: KAI also has an overall score of 3, indicating comparable financial condition.
Which one is the best rated?
Both EMR and KAI share identical “B” ratings and overall scores of 3, with matching moderate ratings in discounted cash flow, ROE, and ROA. The only difference is KAI’s higher debt-to-equity score of 3 compared to EMR’s 2, indicating marginally higher financial leverage risk for KAI.
Scores Comparison
Here is a comparison of the financial scores for Emerson Electric Co. and Kadant Inc.:
EMR Scores
- Altman Z-Score: 2.68, indicating a grey zone risk.
- Piotroski Score: 7, reflecting strong financial health.
KAI Scores
- Altman Z-Score: 5.59, indicating a safe zone risk.
- Piotroski Score: 7, reflecting strong financial health.
Which company has the best scores?
Kadant Inc. shows a higher Altman Z-Score in the safe zone, while both companies share an identical Piotroski Score of 7, indicating equally strong financial health by that measure.
Grades Comparison
Here is a detailed comparison of the latest grades assigned to Emerson Electric Co. and Kadant Inc.:
Emerson Electric Co. Grades
The table below summarizes recent grades from major grading companies for Emerson Electric Co.:
| Grading Company | Action | New Grade | Date |
|---|---|---|---|
| Wells Fargo | Maintain | Equal Weight | 2026-01-07 |
| Barclays | Maintain | Equal Weight | 2026-01-07 |
| UBS | Upgrade | Buy | 2026-01-05 |
| Jefferies | Downgrade | Hold | 2025-12-10 |
| JP Morgan | Maintain | Neutral | 2025-11-10 |
| RBC Capital | Maintain | Outperform | 2025-11-06 |
| Barclays | Maintain | Equal Weight | 2025-11-06 |
| RBC Capital | Maintain | Outperform | 2025-10-16 |
| JP Morgan | Maintain | Neutral | 2025-10-15 |
| Wells Fargo | Downgrade | Equal Weight | 2025-10-06 |
Emerson Electric’s grades show a mixed trend, with some upgrades and downgrades, but generally range between Hold/Neutral and Outperform.
Kadant Inc. Grades
The table below summarizes recent grades from major grading companies for Kadant Inc.:
| Grading Company | Action | New Grade | Date |
|---|---|---|---|
| Barrington Research | Maintain | Outperform | 2025-10-30 |
| Barrington Research | Maintain | Outperform | 2025-10-29 |
| Barrington Research | Maintain | Outperform | 2025-10-27 |
| Barrington Research | Maintain | Outperform | 2025-10-10 |
| Barrington Research | Maintain | Outperform | 2025-09-23 |
| DA Davidson | Maintain | Neutral | 2025-08-04 |
| Barrington Research | Maintain | Outperform | 2025-07-30 |
| Barrington Research | Maintain | Outperform | 2025-07-29 |
| DA Davidson | Maintain | Neutral | 2025-05-01 |
| Barrington Research | Maintain | Outperform | 2025-05-01 |
Kadant Inc. consistently receives Outperform ratings from Barrington Research, indicating a strong positive sentiment, with Neutral ratings from DA Davidson.
Which company has the best grades?
Emerson Electric Co. has a varied range of ratings from Hold to Outperform, while Kadant Inc. has more consistent Outperform ratings with some Neutral. Kadant’s steadier positive grades may signal stronger analyst confidence, potentially influencing investor sentiment toward perceived growth or stability.
Strengths and Weaknesses
Below is a comparison of key strengths and weaknesses for Emerson Electric Co. (EMR) and Kadant Inc. (KAI) based on the latest financial and operational data.
| Criterion | Emerson Electric Co. (EMR) | Kadant Inc. (KAI) |
|---|---|---|
| Diversification | Highly diversified across automation, climate tech, and intelligent devices, with revenues exceeding $18B in 2025 | Focused on capital equipment and parts, less diversified but specialized in papermaking and fiber products |
| Profitability | Moderate net margin at 12.7%, but ROIC (4.6%) below WACC (8.8%) indicating value destruction | Good net margin at 10.6%, ROIC (10.1%) above WACC (9.2%), creating value with improving profitability |
| Innovation | Strong in intelligent devices and software control segments but declining ROIC trend signals challenges | Innovation reflected in growing ROIC and favorable operational ratios, signaling efficient capital use |
| Global presence | Large global footprint with broad market reach | More niche market presence, focused on industrial and papermaking sectors |
| Market Share | Significant presence in industrial automation and climate solutions | Smaller market share but growing steadily with favorable financial metrics |
In summary, Emerson Electric offers broad diversification and global scale but currently struggles with declining profitability and value destruction. Kadant shows improving profitability and efficient capital use, supported by focused operations and financial strength. Investors should weigh Emerson’s scale against Kadant’s growth potential and operational efficiency.
Risk Analysis
Below is a comparative overview of key risks for Emerson Electric Co. (EMR) and Kadant Inc. (KAI) based on the most recent data available in 2026:
| Metric | Emerson Electric Co. (EMR) | Kadant Inc. (KAI) |
|---|---|---|
| Market Risk | Beta 1.254 – moderate volatility; PE 32.42 (unfavorable) | Beta 1.245 – moderate volatility; PE 36.9 (unfavorable) |
| Debt level | Debt to equity 0.65 (neutral); Debt to assets 31.26% (neutral) | Debt to equity 0.38 (favorable); Debt to assets 22.57% (favorable) |
| Regulatory Risk | Moderate – operates globally with exposure to industrial regulations | Moderate – global operations, especially in packaging and processing industries |
| Operational Risk | High complexity with diversified segments; asset turnover low (0.43 unfavorable) | Focused on industrial processing with better asset turnover (0.74 neutral) |
| Environmental Risk | Exposure due to industrial machinery and energy solutions; compliance critical | Environmental impact from material handling and processing; focus on biodegradable products |
| Geopolitical Risk | Global presence including volatile regions; sensitive to trade policies | Primarily North America but with global clients; moderate geopolitical exposure |
Emerson faces higher operational and market risks due to its scale and complexity, with moderate debt levels and some financial ratio weaknesses. Kadant shows stronger financial stability with lower debt and favorable liquidity but carries risks linked to higher valuation multiples and niche market exposure. The most impactful risks are market volatility and operational challenges for Emerson, and valuation and market concentration for Kadant.
Which Stock to Choose?
Emerson Electric Co. (EMR) shows a favorable income statement with a 12.73% net margin and positive EBIT margin growth, but its financial ratios are slightly unfavorable overall, including a low current ratio (0.88) and a net debt to EBITDA of 2.38. Its ROIC is below WACC and declining, indicating value destruction, though the company holds a very favorable B rating.
Kadant Inc. (KAI) presents favorable income growth and profitability, with a 10.59% net margin and increasing ROIC above WACC, signaling improving profitability. Financial ratios are largely favorable, including a strong current ratio of 2.31 and low debt levels. KAI also has a very favorable B rating and strong Altman Z-Score in the safe zone.
For investors prioritizing growth and improving profitability, KAI’s rising ROIC and strong financial ratios may appear more favorable. Conversely, those focused on established stability might consider EMR’s consistent income statement strength despite its declining value creation. The choice could depend on one’s risk tolerance and investment strategy.
Disclaimer: Investment carries a risk of loss of initial capital. The past performance is not a reliable indicator of future results. Be sure to understand risks before making an investment decision.
Go Further
I encourage you to read the complete analyses of Emerson Electric Co. and Kadant Inc. to enhance your investment decisions: