Emerson Electric Co. and Ingersoll Rand Inc. are two prominent players in the industrial machinery sector, each delivering innovative solutions across global markets. While Emerson focuses on automation and commercial heating systems, Ingersoll Rand specializes in air, fluid, and energy technologies. Comparing these companies reveals insights into their market reach and innovation strategies. Join me as we explore which company presents the most compelling investment opportunity today.
Table of contents
Companies Overview
I will begin the comparison between Emerson Electric Co. and Ingersoll Rand Inc. by providing an overview of these two companies and their main differences.
Emerson Electric Co. Overview
Emerson Electric Co. is a technology and engineering firm focused on delivering solutions across industrial, commercial, and residential markets worldwide. Operating through Automation Solutions and Commercial & Residential Solutions segments, it serves diverse sectors such as oil and gas, power generation, and HVAC systems. With a market cap of 81B USD and 73K employees, Emerson is a major player in industrial machinery headquartered in Saint Louis, Missouri.
Ingersoll Rand Inc. Overview
Ingersoll Rand Inc. provides mission-critical air, fluid, energy, specialty vehicle, and medical technologies, operating globally through Industrial Technologies and Services, and Precision and Science Technologies segments. Its products serve industries including medical, chemical processing, and agriculture. The company has a market cap of 33.8B USD, employs 21K people, and is based in Davidson, North Carolina.
Key similarities and differences
Both companies operate in the industrial machinery sector and serve global markets with diversified product lines. Emerson focuses heavily on automation and HVAC solutions, while Ingersoll Rand emphasizes air compression, fluid management, and precision technologies. Emerson is significantly larger in market capitalization and workforce size. Both trade on the NYSE and maintain a broad geographic presence but differ in their specific industrial applications and segment focus.
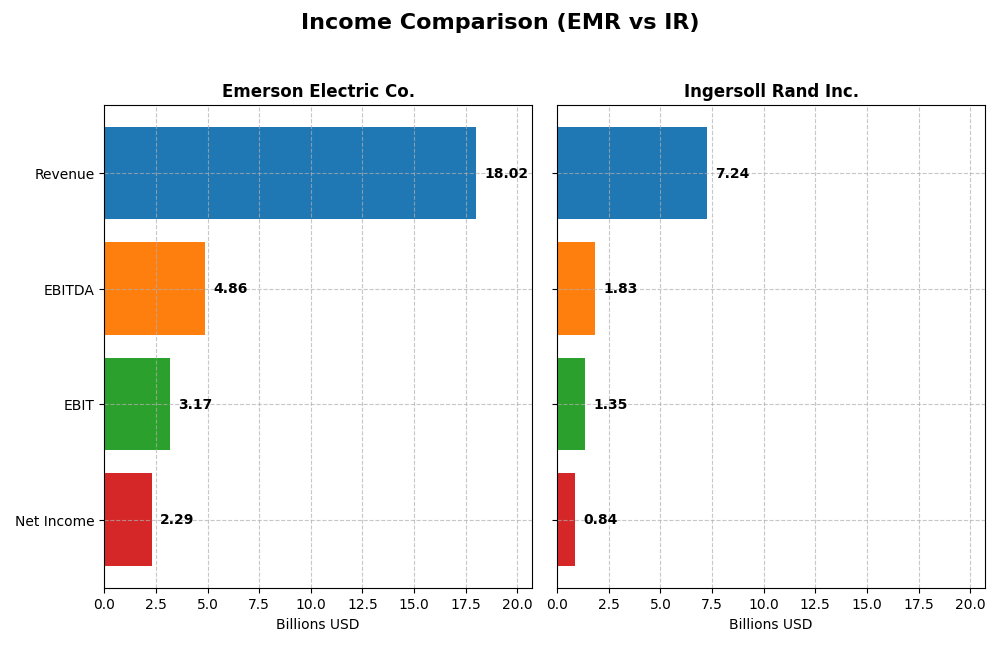
Income Statement Comparison
The table below presents a side-by-side comparison of key income statement metrics for Emerson Electric Co. and Ingersoll Rand Inc. for their most recent fiscal years.
| Metric | Emerson Electric Co. (EMR) | Ingersoll Rand Inc. (IR) |
|---|---|---|
| Market Cap | 81.0B | 33.8B |
| Revenue | 18.0B | 7.2B |
| EBITDA | 4.9B | 1.8B |
| EBIT | 3.2B | 1.3B |
| Net Income | 2.3B | 839M |
| EPS | 4.06 | 2.08 |
| Fiscal Year | 2025 | 2024 |
Income Statement Interpretations
Emerson Electric Co.
Emerson Electric Co. showed steady revenue growth from 2021 to 2025, increasing from $12.9B to $18B, with a 39.3% rise overall. Net income remained relatively stable but dipped slightly over the full period. Margins improved notably, with a 52.8% gross margin and a 12.7% net margin in the latest year. In 2025, revenue growth slowed to 3%, but EBIT jumped 35.3%, reflecting operational efficiency gains.
Ingersoll Rand Inc.
Ingersoll Rand Inc. experienced strong revenue growth from $4B in 2020 to $7.2B in 2024, an 82.1% increase. Net income surged impressively, with a 2618% growth over the period, supported by margin expansions to 43.8% gross and 11.6% net in 2024. The most recent year showed moderate 5.2% revenue growth and 13.3% EBIT increase, coupled with stable net margin progression.
Which one has the stronger fundamentals?
Both companies present favorable income statement fundamentals, with Emerson demonstrating solid margin stability and operational improvements despite slower revenue growth. Ingersoll Rand exhibits more robust revenue and net income growth rates and margin expansions, suggesting stronger earnings momentum. Overall, Ingersoll Rand shows a higher proportion of favorable growth metrics, while Emerson holds steadier margin quality.
Financial Ratios Comparison
The table below presents a side-by-side comparison of key financial ratios for Emerson Electric Co. (EMR) and Ingersoll Rand Inc. (IR) based on their most recent fiscal year data.
| Ratios | Emerson Electric Co. (EMR) | Ingersoll Rand Inc. (IR) |
|---|---|---|
| ROE | 11.3% | 8.2% |
| ROIC | 4.6% | 6.1% |
| P/E | 32.4 | 43.5 |
| P/B | 3.66 | 3.58 |
| Current Ratio | 0.88 | 2.29 |
| Quick Ratio | 0.65 | 1.71 |
| D/E | 0.65 | 0.49 |
| Debt-to-Assets | 31.3% | 27.7% |
| Interest Coverage | 9.44 | 6.10 |
| Asset Turnover | 0.43 | 0.40 |
| Fixed Asset Turnover | 6.28 | 8.59 |
| Payout ratio | 52.0% | 3.85% |
| Dividend yield | 1.60% | 0.09% |
Interpretation of the Ratios
Emerson Electric Co.
Emerson Electric shows a mixed ratio profile with a favorable net margin of 12.73% and strong interest coverage at 13.38, but faces concerns with an unfavorable return on invested capital (4.62%) and low liquidity indicated by a current ratio of 0.88. Its dividend yield is 1.6%, supported by stable payouts and moderate shareholder returns, though free cash flow coverage warrants monitoring for sustainability.
Ingersoll Rand Inc.
Ingersoll Rand presents a stronger liquidity position with a current ratio of 2.29 and favorable debt ratios, alongside a favorable net margin of 11.59%. However, it struggles with a lower return on equity (8.24%) and a high price-to-earnings ratio (43.51). The company pays a minimal dividend yield of 0.09%, reflecting a cautious approach to shareholder returns amid reinvestment priorities.
Which one has the best ratios?
Ingersoll Rand holds a slight edge with 50% favorable ratios, especially in liquidity and leverage, compared to Emerson’s 21.43%. Emerson’s profitability measures like net margin and interest coverage are strong, but weaker liquidity and valuation metrics weigh on its profile. Overall, Ingersoll Rand’s ratios appear slightly more balanced and favorable.
Strategic Positioning
This section compares the strategic positioning of Emerson Electric Co. and Ingersoll Rand Inc. on market position, key segments, and exposure to technological disruption:
Emerson Electric Co.
- Large market cap of 81B, facing industrial machinery competition with a broad geographic reach.
- Diverse segments including Automation Solutions and Commercial & Residential Solutions driving revenue.
- Technological integration through process control software and environmental control systems.
Ingersoll Rand Inc.
- Market cap of 33.8B, competing in industrial machinery with extensive international presence.
- Focused on Industrial Technologies & Services and Precision & Science Technologies segments.
- Exposure through specialized fluid management and air compression technologies.
Emerson Electric Co. vs Ingersoll Rand Inc. Positioning
Emerson Electric exhibits a diversified strategy with multiple business lines and broad market coverage, while Ingersoll Rand concentrates on specialized industrial and precision technologies. Emerson’s scale may offer broader exposure, whereas Ingersoll Rand targets niche critical applications, reflecting different growth drivers and operational focuses.
Which has the best competitive advantage?
Both companies are shedding value as ROIC remains below WACC; however, Ingersoll Rand shows improving profitability trends, while Emerson Electric’s ROIC is declining, indicating a slightly more favorable competitive advantage for Ingersoll Rand based on MOAT evaluation.
Stock Comparison
The stock price movements of Emerson Electric Co. (EMR) and Ingersoll Rand Inc. (IR) over the past 12 months reveal contrasting trends, with EMR showing strong gains amid accelerating momentum, while IR reflects a moderate decline despite recent positive shifts.
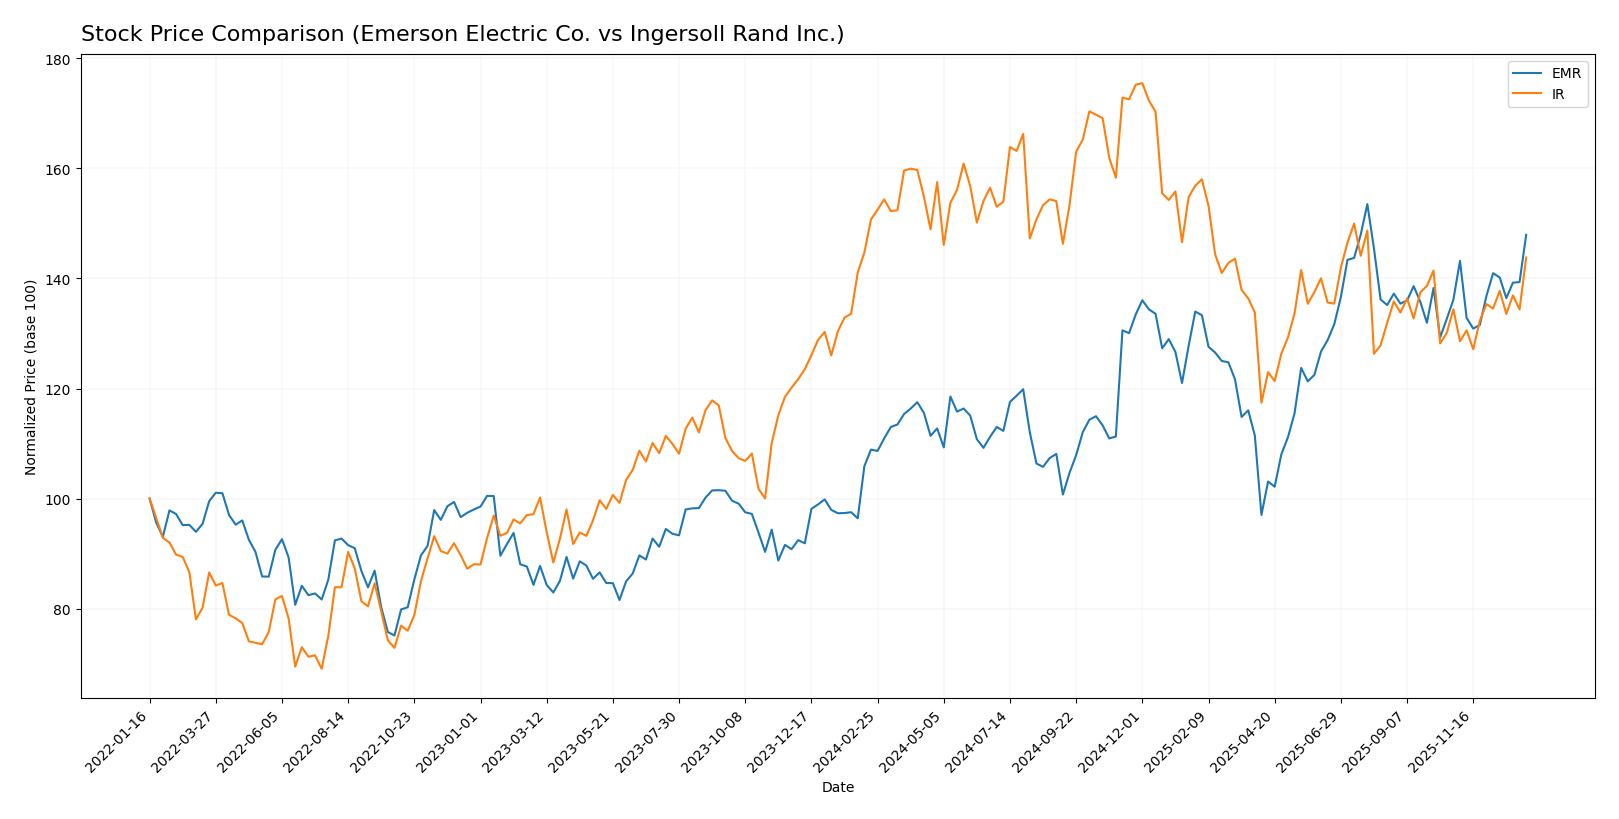
Trend Analysis
Emerson Electric Co. (EMR) experienced a bullish trend over the past year, with a 35.84% price increase accompanied by accelerating momentum and a high volatility level (12.39 std deviation). Recent months show continued positive slope and an 8.68% gain.
Ingersoll Rand Inc. (IR) showed a bearish trend over the same period, with a 4.58% price decline despite acceleration. Volatility was moderate (8.07 std deviation), and recent activity indicates a 7.01% increase, suggesting a possible reversal.
Comparing both, EMR delivered the highest market performance with a substantial 35.84% gain, outperforming IR’s overall negative return despite IR’s recent upward movement.
Target Prices
The current analyst consensus provides a clear target price range for Emerson Electric Co. and Ingersoll Rand Inc.
| Company | Target High | Target Low | Consensus |
|---|---|---|---|
| Emerson Electric Co. | 170 | 125 | 149.67 |
| Ingersoll Rand Inc. | 100 | 81 | 91.5 |
Analysts expect Emerson Electric’s price to rise slightly above its current 144.19 USD, while Ingersoll Rand’s consensus target at 91.5 USD suggests moderate upside from the current 85.44 USD price.
Analyst Opinions Comparison
This section compares analysts’ ratings and financial scores for Emerson Electric Co. (EMR) and Ingersoll Rand Inc. (IR):
Rating Comparison
EMR Rating
- Rating: B, indicating a very favorable assessment.
- Discounted Cash Flow Score: 3, moderate valuation indication.
- ROE Score: 3, moderate efficiency in generating profit from equity.
- ROA Score: 4, favorable asset utilization.
- Debt To Equity Score: 2, moderate financial risk.
- Overall Score: 3, moderate overall financial standing.
IR Rating
- Rating: C+, also noted as very favorable despite lower letter grade.
- Discounted Cash Flow Score: 3, moderate valuation indication.
- ROE Score: 2, moderate but lower efficiency compared to EMR.
- ROA Score: 3, moderate asset utilization, lower than EMR.
- Debt To Equity Score: 2, moderate financial risk, same as EMR.
- Overall Score: 2, moderate but lower overall standing than EMR.
Which one is the best rated?
Based on the provided data, EMR holds a higher letter rating (B vs. C+) and scores better in ROE, ROA, and overall score. Both have the same discounted cash flow and debt-to-equity scores, but EMR is clearly better rated overall.
Scores Comparison
Here is a comparison of the Altman Z-Score and Piotroski Score for Emerson Electric Co. (EMR) and Ingersoll Rand Inc. (IR):
EMR Scores
- Altman Z-Score: 2.68, in the grey zone indicating moderate bankruptcy risk.
- Piotroski Score: 7, considered strong financial health.
IR Scores
- Altman Z-Score: 3.27, in the safe zone indicating low bankruptcy risk.
- Piotroski Score: 5, considered average financial health.
Which company has the best scores?
Ingersoll Rand has a higher Altman Z-Score, placing it in the safe zone, while Emerson Electric’s score is in the grey zone. Emerson Electric has a stronger Piotroski Score, suggesting better financial health compared to Ingersoll Rand’s average rating.
Grades Comparison
Here is a detailed comparison of the recent grades assigned to Emerson Electric Co. and Ingersoll Rand Inc.:
Emerson Electric Co. Grades
This table summarizes recent grade changes and actions from major grading companies for Emerson Electric Co.:
| Grading Company | Action | New Grade | Date |
|---|---|---|---|
| Wells Fargo | Maintain | Equal Weight | 2026-01-07 |
| Barclays | Maintain | Equal Weight | 2026-01-07 |
| UBS | Upgrade | Buy | 2026-01-05 |
| Jefferies | Downgrade | Hold | 2025-12-10 |
| JP Morgan | Maintain | Neutral | 2025-11-10 |
| RBC Capital | Maintain | Outperform | 2025-11-06 |
| Barclays | Maintain | Equal Weight | 2025-11-06 |
| RBC Capital | Maintain | Outperform | 2025-10-16 |
| JP Morgan | Maintain | Neutral | 2025-10-15 |
| Wells Fargo | Downgrade | Equal Weight | 2025-10-06 |
Emerson Electric’s grades show a mix of Neutral to Outperform ratings, with recent upgrades and downgrades reflecting a balanced outlook.
Ingersoll Rand Inc. Grades
Below are the recent grades and rating actions recorded for Ingersoll Rand Inc.:
| Grading Company | Action | New Grade | Date |
|---|---|---|---|
| Wells Fargo | Maintain | Overweight | 2026-01-07 |
| Stifel | Maintain | Hold | 2025-12-16 |
| Citigroup | Maintain | Buy | 2025-12-08 |
| Citigroup | Maintain | Buy | 2025-11-03 |
| Baird | Maintain | Outperform | 2025-11-03 |
| Stifel | Maintain | Hold | 2025-10-20 |
| Wells Fargo | Maintain | Overweight | 2025-10-06 |
| Morgan Stanley | Maintain | Equal Weight | 2025-08-13 |
| Barclays | Maintain | Overweight | 2025-08-04 |
| Stifel | Maintain | Hold | 2025-08-04 |
Ingersoll Rand’s grades largely indicate positive sentiment, with multiple Overweight and Buy ratings maintained over recent months.
Which company has the best grades?
Comparing the two, Ingersoll Rand consistently holds more bullish grades such as Overweight and Buy, while Emerson Electric’s ratings fluctuate between Neutral and Outperform. Investors may interpret Ingersoll Rand’s stronger consensus as reflecting greater confidence from analysts, potentially influencing portfolio allocation considerations.
Strengths and Weaknesses
Below is a comparison table summarizing key strengths and weaknesses of Emerson Electric Co. (EMR) and Ingersoll Rand Inc. (IR) based on the most recent financial and operational data.
| Criterion | Emerson Electric Co. (EMR) | Ingersoll Rand Inc. (IR) |
|---|---|---|
| Diversification | Strong diversification with segments in Intelligent Devices (12.4B) and Software & Control (5.7B) | Diversified mainly into Industrial Technologies & Services (5.8B) and Precision & Science Technologies (1.4B) |
| Profitability | Moderate net margin (12.7%), but unfavorable ROIC (4.6%) below WACC (8.8%), indicating value destruction | Solid net margin (11.6%) and neutral ROIC (6.1%) but below WACC (9.2%), showing slight value erosion |
| Innovation | Moderate innovation supported by growing Software & Control segment | Innovation driven by growth in Precision & Science Technologies segment |
| Global presence | Established global footprint with broad industrial automation solutions | Strong global presence in industrial and precision technologies |
| Market Share | Large market share in automation and control markets | Growing market share with expanding industrial services |
Key takeaways: Emerson Electric shows broad diversification and solid market presence but struggles with profitability and capital efficiency, leading to value destruction. Ingersoll Rand, while also shedding value, demonstrates improving profitability trends and better financial health, supported by favorable liquidity and leverage ratios. Investors should weigh EMR’s diversification against IR’s improving profitability trajectory.
Risk Analysis
Below is a comparative table of key risks for Emerson Electric Co. (EMR) and Ingersoll Rand Inc. (IR) based on their latest financial data and market context in 2026:
| Metric | Emerson Electric Co. (EMR) | Ingersoll Rand Inc. (IR) |
|---|---|---|
| Market Risk | Beta 1.25, moderate volatility | Beta 1.33, slightly higher volatility |
| Debt Level | Debt-to-Equity 0.65, neutral risk | Debt-to-Equity 0.49, favorable risk profile |
| Regulatory Risk | Moderate, global industrial exposures | Moderate, global industrial and medical tech exposure |
| Operational Risk | Slightly unfavorable asset turnover | Unfavorable asset turnover but higher fixed asset efficiency |
| Environmental Risk | Medium, manufacturing footprint and energy use | Medium, diverse industrial product lines |
| Geopolitical Risk | Exposure across Americas, Asia, Middle East | Exposure across Americas, Europe, Asia Pacific |
Emerson’s slightly higher leverage and weaker liquidity ratios elevate its financial risk, while Ingersoll Rand’s stronger balance sheet and liquidity mitigate this. However, both face operational challenges with asset utilization and moderate geopolitical and environmental risks tied to their global industrial operations. Investors should weigh these factors carefully given their impact on profitability and stability.
Which Stock to Choose?
Emerson Electric Co. (EMR) shows a mixed income evolution with favorable gross and EBIT margins, but slight revenue growth slowdown. Its financial ratios are slightly unfavorable overall, with solid interest coverage but weak liquidity and valuation metrics. The company’s profitability is moderate, debt levels neutral, and it holds a very favorable rating.
Ingersoll Rand Inc. (IR) exhibits favorable income growth, strong net income and EPS increases over the long term, and generally positive profitability ratios. Its financial ratios are slightly favorable, marked by strong liquidity and moderate leverage, despite an unfavorable P/E ratio. The rating is very favorable, reflecting solid financial health.
For investors, the choice might depend on risk tolerance and investment goals: those seeking steadier income statement performance with slightly better ratings and improving profitability trends might lean toward Ingersoll Rand, while investors focusing on established profitability and favorable ratings could find Emerson Electric attractive despite some financial ratio concerns.
Disclaimer: Investment carries a risk of loss of initial capital. The past performance is not a reliable indicator of future results. Be sure to understand risks before making an investment decision.
Go Further
I encourage you to read the complete analyses of Emerson Electric Co. and Ingersoll Rand Inc. to enhance your investment decisions: