Emerson Electric Co. (EMR) and Illinois Tool Works Inc. (ITW) are two giants in the industrial machinery sector, each driving innovation through diverse product lines and global reach. Both companies serve overlapping markets with a focus on technology and engineering solutions, making their strategies and performance highly comparable. In this article, I will analyze their strengths and risks to help you decide which stock could be the better addition to your investment portfolio.
Table of contents
Companies Overview
I will begin the comparison between Emerson Electric Co. and Illinois Tool Works Inc. by providing an overview of these two companies and their main differences.
Emerson Electric Co. Overview
Emerson Electric Co. is a technology and engineering firm serving industrial, commercial, and residential markets worldwide. It operates through two main segments: Automation Solutions, offering instrumentation and control systems, and Commercial & Residential Solutions, providing heating, air conditioning, and appliance-related products. Founded in 1890 and headquartered in Saint Louis, Missouri, Emerson focuses on diverse industries including oil and gas, food and beverage, and power generation.
Illinois Tool Works Inc. Overview
Illinois Tool Works Inc. manufactures and sells industrial products globally, operating across seven segments such as Automotive OEM, Food Equipment, Welding, and Construction Products. Founded in 1912 and based in Glenview, Illinois, ITW serves automotive, commercial food, construction, and general industrial markets. Its product range includes components, equipment, adhesives, fasteners, and specialty products distributed directly and through independent channels.
Key similarities and differences
Both Emerson and ITW operate in the industrial machinery sector with global reach and diversified offerings. Emerson emphasizes technology-driven automation and climate control solutions, while ITW focuses on manufacturing a broad range of industrial components and equipment across multiple specialized segments. Emerson employs about 73K people, larger than ITW’s 44K, and their market caps are close, approximately 81B for Emerson and 74B for ITW, reflecting comparable scale but distinct strategic focuses.
Income Statement Comparison
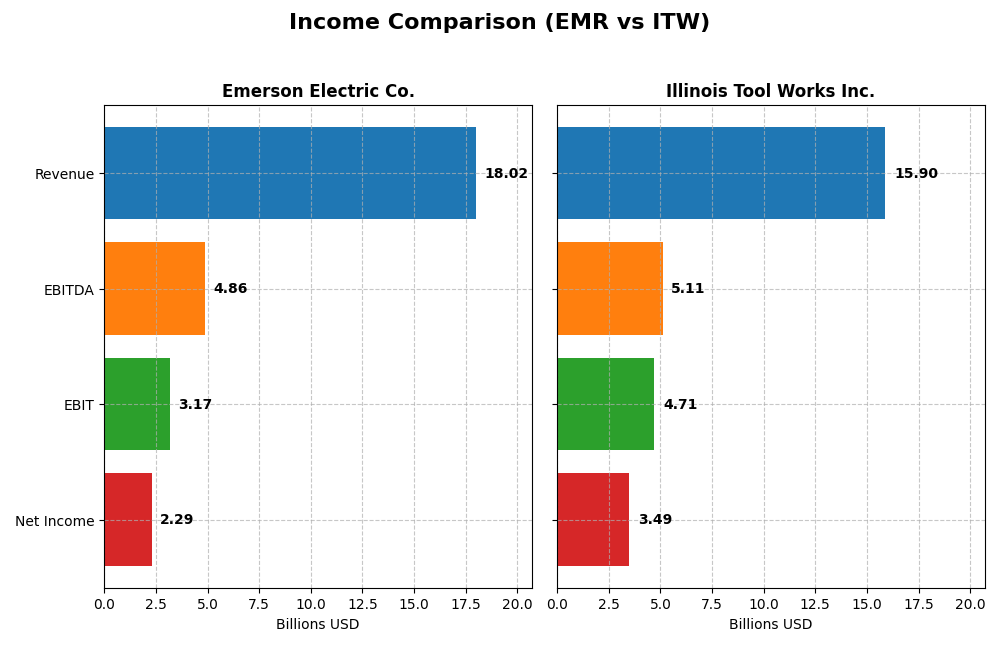
This table presents a side-by-side comparison of key income statement metrics for Emerson Electric Co. and Illinois Tool Works Inc. for their most recent fiscal years.
| Metric | Emerson Electric Co. | Illinois Tool Works Inc. |
|---|---|---|
| Market Cap | 81B | 74B |
| Revenue | 18.0B | 15.9B |
| EBITDA | 4.9B | 5.1B |
| EBIT | 3.2B | 4.7B |
| Net Income | 2.3B | 3.5B |
| EPS | 4.06 | 11.75 |
| Fiscal Year | 2025 | 2024 |
Income Statement Interpretations
Emerson Electric Co.
Emerson Electric Co. demonstrated revenue growth from $12.9B in 2021 to $18B in 2025, reflecting a 39.3% increase over five years. Net income fluctuated, reaching $13.2B in 2023 due to discontinued operations but dropped to $2.3B in 2025. Margins mostly improved, with a gross margin of 52.8% and net margin of 12.7% in 2025. The latest year saw slower revenue growth but stronger EBIT and net margin expansion.
Illinois Tool Works Inc.
Illinois Tool Works Inc. posted revenue growth from $12.6B in 2020 to $15.9B in 2024, a 26.4% increase. Net income steadily rose from $2.1B to $3.5B in the same period. Margins remained robust, with a 43.7% gross margin and a notably high 21.9% net margin in 2024. Despite a slight revenue decline in the last year, EBIT and net margin grew significantly, indicating enhanced profitability.
Which one has the stronger fundamentals?
Illinois Tool Works exhibits stronger fundamentals, marked by consistent net income growth of 65.4% overall, expanding net margins, and solid EBIT margins above 29%. Emerson Electric shows favorable margin improvements but net income volatility and slower recent revenue growth. Both companies maintain favorable income statement profiles, yet ITW’s steadier earnings and margin gains suggest more durable income statement strength.
Financial Ratios Comparison
The table below presents a side-by-side comparison of key financial ratios for Emerson Electric Co. (EMR) and Illinois Tool Works Inc. (ITW) based on their most recent fiscal year data.
| Ratios | Emerson Electric Co. (EMR) FY 2025 | Illinois Tool Works Inc. (ITW) FY 2024 |
|---|---|---|
| ROE | 11.30% | 105.15% |
| ROIC | 4.62% | 27.19% |
| P/E | 32.42 | 21.58 |
| P/B | 3.66 | 22.69 |
| Current Ratio | 0.88 | 1.36 |
| Quick Ratio | 0.65 | 0.99 |
| D/E (Debt to Equity) | 0.65 | 2.44 |
| Debt-to-Assets | 31.26% | 53.61% |
| Interest Coverage | 9.44 | 15.07 |
| Asset Turnover | 0.43 | 1.06 |
| Fixed Asset Turnover | 6.28 | 6.91 |
| Payout Ratio | 52.0% | 48.6% |
| Dividend Yield | 1.60% | 2.25% |
Interpretation of the Ratios
Emerson Electric Co.
Emerson Electric shows a mixed ratio profile with favorable net margin and interest coverage, but unfavorable returns on invested capital, valuation multiples (PE and PB), and liquidity ratios like current and quick ratios. Asset turnover is notably weak, signaling potential operational inefficiencies. The company pays dividends with a 1.6% yield, reflecting a neutral stance; payout sustainability requires monitoring given some unfavorable cash flow metrics.
Illinois Tool Works Inc.
Illinois Tool Works presents a stronger ratio set, with favorable net margin, ROE, ROIC, and asset turnover, indicating efficient use of capital and profitability. However, its debt levels and price-to-book ratio raise some concerns. The dividend yield at 2.25% is favorable, supported by strong coverage ratios and consistent returns, though elevated leverage warrants attention for risk assessment.
Which one has the best ratios?
Comparatively, Illinois Tool Works exhibits a more favorable ratio distribution with half of its ratios rated positively and fewer unfavorable metrics, reflecting better profitability and operational efficiency. Emerson Electric, meanwhile, shows a slightly unfavorable profile marked by weaker returns and liquidity challenges, suggesting Illinois Tool Works currently holds the advantage in financial ratio strength.
Strategic Positioning
This section compares the strategic positioning of Emerson Electric Co. and Illinois Tool Works Inc., including Market position, Key segments, and Exposure to technological disruption:
Emerson Electric Co.
- Large industrial machinery player with 81B market cap, facing moderate competitive pressure.
- Focused on Automation Solutions and Commercial & Residential Solutions serving diverse industries like oil, chemicals, and HVAC.
- Exposure to technological disruption through automation and software control products integration.
Illinois Tool Works Inc.
- 74B market cap industrial machinery firm with broad global reach and steady competition.
- Operates seven segments including Automotive OEM, Food Equipment, Welding, and Specialty Products.
- Faces technological disruption risks in test & measurement, electronics, and polymers segments.
Emerson Electric Co. vs Illinois Tool Works Inc. Positioning
Emerson exhibits a diversified approach centered on automation and residential solutions, while Illinois Tool Works has a more segmented focus across industrial products. Emerson’s key advantage is integration of software control; ITW benefits from broad industrial segment coverage.
Which has the best competitive advantage?
Illinois Tool Works shows a very favorable moat with growing ROIC and value creation, indicating durable competitive advantage. Emerson’s very unfavorable moat and declining ROIC suggest weakening competitive positioning and value destruction.
Stock Comparison
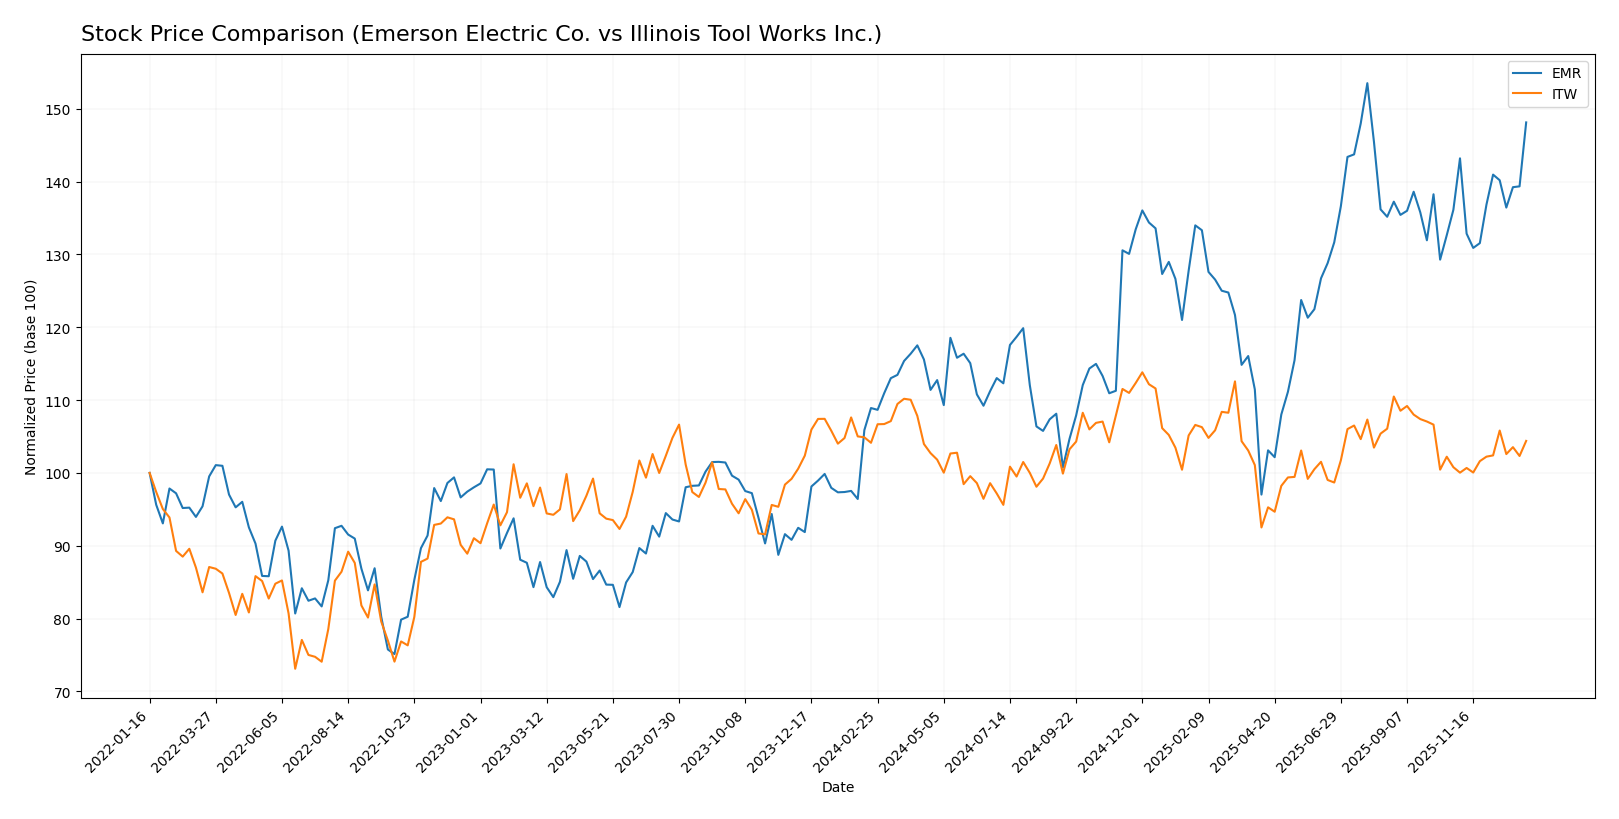
The stock price chart highlights significant bullish momentum for Emerson Electric Co. (EMR) with a strong upward trajectory over the past 12 months, while Illinois Tool Works Inc. (ITW) shows a marginal positive change with more subdued trading dynamics.
Trend Analysis
Emerson Electric Co. (EMR) experienced a 36.02% price increase over the past year, indicating a bullish trend with acceleration and volatility reflected in a 12.4 std deviation. The stock reached a high of 149.63 and a low of 94.57.
Illinois Tool Works Inc. (ITW) showed a slight 0.25% price gain, categorized as a neutral trend despite acceleration. Its price volatility was moderate with a 10.65 std deviation, peaking at 277.52 and bottoming at 225.57.
Comparing both, EMR delivered the highest market performance with a clear bullish trend, while ITW maintained near-neutral growth with limited price appreciation during the same period.
Target Prices
Analysts provide solid target price consensus for Emerson Electric Co. and Illinois Tool Works Inc., reflecting moderate upside potential.
| Company | Target High | Target Low | Consensus |
|---|---|---|---|
| Emerson Electric Co. | 170 | 125 | 149.67 |
| Illinois Tool Works Inc. | 275 | 230 | 254 |
Emerson’s consensus target of 149.67 is slightly above its current price of 144.06, indicating modest growth expectations. Illinois Tool Works’ target consensus of 254 aligns closely with its present price of 254.45, suggesting a stable outlook with limited near-term price appreciation.
Analyst Opinions Comparison
This section compares analysts’ ratings and grades for Emerson Electric Co. and Illinois Tool Works Inc.:
Rating Comparison
Emerson Electric Co. Rating
- Rating: B, classified as Very Favorable.
- Discounted Cash Flow Score: 3, indicating Moderate.
- ROE Score: 3, reflecting Moderate efficiency.
- ROA Score: 4, showing Favorable asset utilization.
- Debt To Equity Score: 2, considered Moderate risk.
- Overall Score: 3, representing a Moderate rating.
Illinois Tool Works Inc. Rating
- Rating: B, classified as Very Favorable.
- Discounted Cash Flow Score: 3, indicating Moderate.
- ROE Score: 5, reflecting Very Favorable efficiency.
- ROA Score: 5, showing Very Favorable asset utilization.
- Debt To Equity Score: 1, considered Very Unfavorable risk.
- Overall Score: 3, representing a Moderate rating.
Which one is the best rated?
Both companies share the same overall rating of B and an overall score of 3, indicating a moderate rating. However, Illinois Tool Works shows stronger profitability metrics with higher ROE and ROA scores, while Emerson Electric demonstrates a better debt-to-equity profile.
Scores Comparison
Here is a comparison of the financial scores for Emerson Electric Co. and Illinois Tool Works Inc.:
EMR Scores
- Altman Z-Score: 2.68, indicating a grey zone, moderate bankruptcy risk
- Piotroski Score: 7, categorized as strong financial health
ITW Scores
- Altman Z-Score: 7.93, indicating a safe zone, low bankruptcy risk
- Piotroski Score: 7, categorized as strong financial health
Which company has the best scores?
Illinois Tool Works (ITW) shows a significantly higher Altman Z-Score placing it in the safe zone, while both companies share the same strong Piotroski Score of 7. Based on these scores alone, ITW exhibits stronger financial stability.
Grades Comparison
Here is a comparison of the recent grades assigned to Emerson Electric Co. and Illinois Tool Works Inc.:
Emerson Electric Co. Grades
The table below summarizes recent grades from reputable grading companies for Emerson Electric Co.:
| Grading Company | Action | New Grade | Date |
|---|---|---|---|
| Wells Fargo | Maintain | Equal Weight | 2026-01-07 |
| Barclays | Maintain | Equal Weight | 2026-01-07 |
| UBS | Upgrade | Buy | 2026-01-05 |
| Jefferies | Downgrade | Hold | 2025-12-10 |
| JP Morgan | Maintain | Neutral | 2025-11-10 |
| RBC Capital | Maintain | Outperform | 2025-11-06 |
| Barclays | Maintain | Equal Weight | 2025-11-06 |
| RBC Capital | Maintain | Outperform | 2025-10-16 |
| JP Morgan | Maintain | Neutral | 2025-10-15 |
| Wells Fargo | Downgrade | Equal Weight | 2025-10-06 |
Emerson Electric Co.’s grades show a mix of “Equal Weight,” “Neutral,” and “Outperform” ratings, with some recent upgrades and downgrades indicating a generally neutral to moderately positive sentiment.
Illinois Tool Works Inc. Grades
The table below summarizes recent grades from reputable grading companies for Illinois Tool Works Inc.:
| Grading Company | Action | New Grade | Date |
|---|---|---|---|
| Wells Fargo | Maintain | Underweight | 2026-01-07 |
| Goldman Sachs | Downgrade | Sell | 2025-12-16 |
| B of A Securities | Upgrade | Neutral | 2025-11-18 |
| Barclays | Maintain | Underweight | 2025-10-27 |
| Truist Securities | Maintain | Hold | 2025-10-27 |
| Wells Fargo | Maintain | Underweight | 2025-10-27 |
| Truist Securities | Maintain | Hold | 2025-10-08 |
| Barclays | Downgrade | Underweight | 2025-08-14 |
| Barclays | Maintain | Equal Weight | 2025-08-04 |
| UBS | Maintain | Neutral | 2025-07-31 |
Illinois Tool Works Inc. has predominantly received “Underweight,” “Hold,” and “Neutral” ratings, with some downgrades to “Sell,” reflecting a cautious or negative outlook by analysts.
Which company has the best grades?
Emerson Electric Co. has received generally more favorable grades, including several “Buy” and “Outperform” ratings, compared to Illinois Tool Works Inc., which shows a predominance of “Underweight” and “Sell” grades. This difference may influence investors toward Emerson with a more optimistic market view, while Illinois Tool Works appears to carry higher perceived risk or weaker momentum.
Strengths and Weaknesses
Below is a comparison of key strengths and weaknesses between Emerson Electric Co. (EMR) and Illinois Tool Works Inc. (ITW) based on the most recent financial and strategic data.
| Criterion | Emerson Electric Co. (EMR) | Illinois Tool Works Inc. (ITW) |
|---|---|---|
| Diversification | Moderate diversification with focus on Intelligent Devices and Software & Control segments (12.4B and 5.7B USD in 2025) | Highly diversified across seven segments, each contributing ~1.7B to 3.2B USD in revenue |
| Profitability | Moderate net margin at 12.7%, ROE neutral at 11.3%, but ROIC unfavorable at 4.6% vs 8.8% WACC | Strong profitability with net margin 21.9%, ROE 105%, ROIC 27.2%, indicating efficient capital use |
| Innovation | Lower recent returns with declining ROIC trend (-43%), signaling challenges in sustaining competitive advantage | High and growing ROIC (+62%), reflecting successful innovation and competitive moat |
| Global presence | Established global footprint, mainly in automation and control solutions | Strong global presence with broad industrial exposure across multiple sectors |
| Market Share | Stable in automation markets but value-destructive due to declining profitability | Increasing market share supported by durable competitive advantages and value creation |
Key takeaways: Illinois Tool Works exhibits a robust competitive moat with strong profitability and effective capital use, making it a value creator. In contrast, Emerson Electric struggles with declining returns and value destruction despite moderate diversification and stable margins, warranting caution for investors.
Risk Analysis
Below is a risk comparison table for Emerson Electric Co. (EMR) and Illinois Tool Works Inc. (ITW) based on the most recent financial and operational data available.
| Metric | Emerson Electric Co. (EMR) | Illinois Tool Works Inc. (ITW) |
|---|---|---|
| Market Risk | Beta 1.25; moderate market volatility exposure | Beta 1.17; slightly lower market volatility exposure |
| Debt level | Debt-to-Equity 0.65 (neutral); Debt-to-Assets 31.3% | Debt-to-Equity 2.44 (unfavorable); Debt-to-Assets 53.6% (high leverage) |
| Regulatory Risk | Moderate; operates globally with exposure to diverse regulations | Moderate; global operations with industry-specific regulations |
| Operational Risk | Moderate; complex supply chains in automation and commercial sectors | Moderate; diversified segments reduce single-point operational risks |
| Environmental Risk | Medium; involvement in industrial equipment with environmental compliance needs | Medium; exposure to manufacturing emissions and resource usage |
| Geopolitical Risk | Moderate; presence in multiple regions including Americas, Asia, Middle East | Moderate; global footprint with exposure to trade policies and tariffs |
In synthesis, ITW carries higher financial leverage risk due to its elevated debt ratios, which could impact stability under economic stress. EMR shows moderate operational and liquidity risks with lower leverage but has some unfavorable valuation ratios. Market and geopolitical risks are similar for both, given their global industrial exposure. Investors should weigh ITW’s strong profitability against its leverage and EMR’s more conservative debt position but mixed financial health.
Which Stock to Choose?
Emerson Electric Co. (EMR) shows favorable income statement metrics with a 12.73% net margin and positive growth in EBIT and EPS over the last year, though revenue growth is modest. Its financial ratios appear slightly unfavorable overall, with weaknesses in liquidity and valuation metrics, and it carries moderate debt. The company’s MOAT evaluation signals value destruction with declining ROIC compared to WACC, while its rating remains moderate to favorable.
Illinois Tool Works Inc. (ITW) demonstrates a stronger income evolution, with a 21.94% net margin and significant growth across net income, EPS, and margins over the medium term. Its financial ratios are largely favorable, especially profitability and asset turnover, though it faces challenges with high debt levels. ITW’s MOAT evaluation is very favorable, reflecting a durable competitive advantage and increasing profitability, supported by a strong credit rating.
For investors, ITW might appear more attractive for those prioritizing quality and growth given its robust profitability and strong moat, despite higher leverage. Conversely, EMR could be interpreted as a more cautious choice for those focusing on moderate risk exposure and stable income statement performance, considering its value-destroying trend and weaker liquidity. The ultimate preference may depend on the investor’s risk tolerance and strategic focus.
Disclaimer: Investment carries a risk of loss of initial capital. The past performance is not a reliable indicator of future results. Be sure to understand risks before making an investment decision.
Go Further
I encourage you to read the complete analyses of Emerson Electric Co. and Illinois Tool Works Inc. to enhance your investment decisions: