Home > Comparison > Industrials > EMR vs IEX
The strategic rivalry between Emerson Electric Co. and IDEX Corporation shapes the industrial machinery landscape. Emerson operates as a diversified technology and engineering leader with broad automation and commercial solutions. IDEX focuses on specialized fluid and metering technologies alongside health and safety equipment. This analysis pits Emerson’s scale against IDEX’s niche innovation to identify which offers superior risk-adjusted returns for diversified portfolios amid evolving industrial dynamics.
Table of contents
Companies Overview
Emerson Electric Co. and IDEX Corporation both play pivotal roles in the industrial machinery sector, shaping global engineering and manufacturing landscapes.
Emerson Electric Co.: Industrial Engineering Powerhouse
Emerson Electric Co. dominates with automation and commercial solutions that generate revenue from industrial valves, control software, and HVAC components. Its strategic focus in 2026 centers on expanding technology-driven solutions across global industrial, commercial, and residential markets, leveraging innovation to enhance operational efficiency and environmental sustainability.
IDEX Corporation: Precision Fluidics and Safety Specialist
IDEX Corporation specializes in fluid and metering technologies, health sciences, and fire safety equipment. It earns revenue by designing pumps, precision fluidics, and firefighting systems serving diverse industries from pharmaceuticals to defense. In 2026, IDEX prioritizes advancing applied solutions with a strong emphasis on precision engineering and market diversification.
Strategic Collision: Similarities & Divergences
Both companies excel in industrial machinery but diverge strategically; Emerson focuses on broad automation and HVAC ecosystems, while IDEX leans into precision fluidics and niche safety products. Their primary battleground is industrial innovation and specialized engineering services. Emerson offers scale and global reach; IDEX provides focused expertise and agility, creating distinct investment profiles based on market breadth versus specialization.
Income Statement Comparison
The following data dissects the core profitability and scalability of both corporate engines to reveal who dominates the bottom line:
| Metric | Emerson Electric Co. (EMR) | IDEX Corporation (IEX) |
|---|---|---|
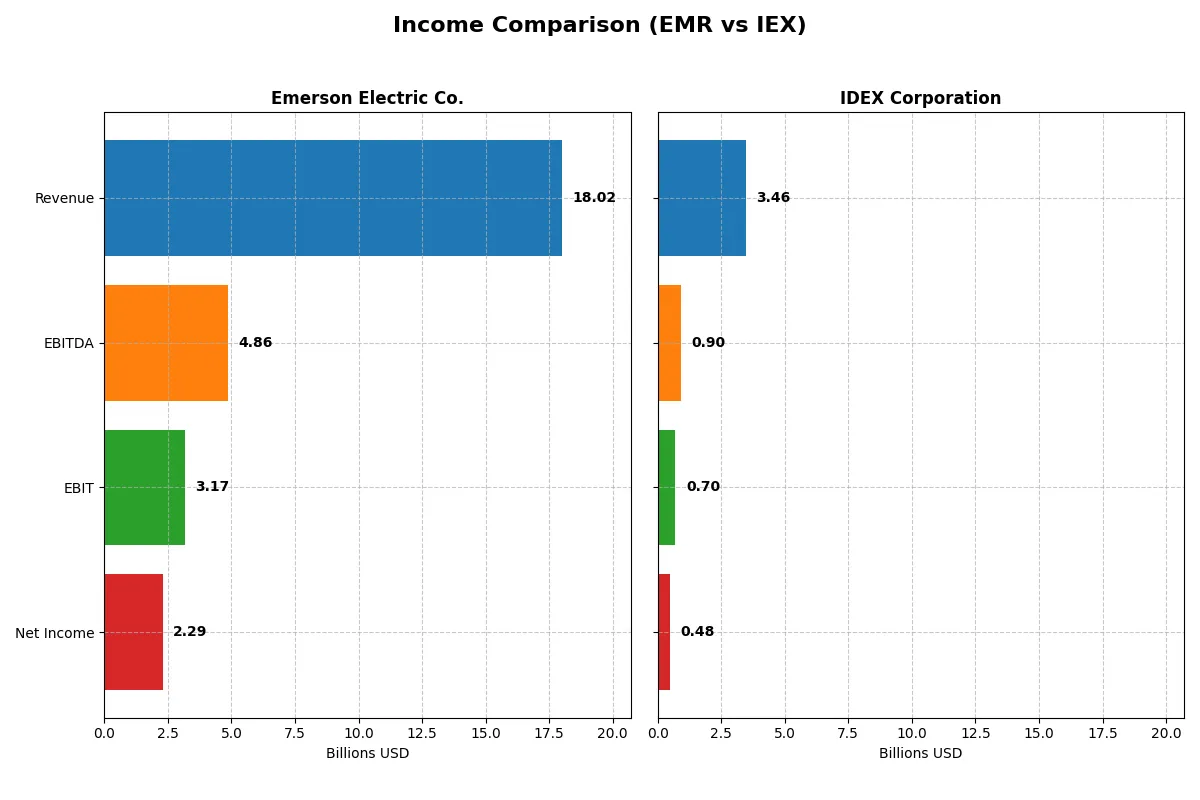
| Revenue | 18.0B | 3.46B |
| Cost of Revenue | 8.50B | 1.92B |
| Operating Expenses | 7.28B | 819M |
| Gross Profit | 9.52B | 1.54B |
| EBITDA | 4.86B | 904M |
| EBIT | 3.17B | 697M |
| Interest Expense | 387M | 64M |
| Net Income | 2.29B | 483M |
| EPS | 4.06 | 6.41 |
| Fiscal Year | 2025 | 2025 |
Income Statement Analysis: The Bottom-Line Duel
This income statement comparison exposes which company converts revenue into profit with superior efficiency and sustainable margin strength.
Emerson Electric Co. Analysis
Emerson Electric Co. grew revenue steadily from 13.0B in 2021 to 18.0B in 2025, reflecting a 39.3% increase over five years. Net income showed volatility, peaking in 2023 with 13.2B due to discontinued operations but settling at 2.3B in 2025. Gross margin improved to 52.8%, while net margin reached 12.7%, highlighting effective cost control. The 2025 year showed a 17.8% EPS growth, signaling solid operational momentum.
IDEX Corporation Analysis
IDEX Corporation expanded revenue from 2.76B in 2021 to 3.46B in 2025, a 25% rise over five years. Net income climbed consistently to 483M in 2025, with a net margin of 14.0%, slightly above Emerson’s. Gross margin stood at 44.5%, lower than Emerson but stable. EBIT margin of 20.2% reflects operational efficiency. Recent EPS declined 3.5%, suggesting some pressure on profitability despite revenue growth.
Margin Strength vs. Earnings Stability
Emerson commands higher gross margins and shows strong EPS momentum, driven by robust cost management and operational leverage. IDEX delivers superior net margin and steady net income growth but faces margin compression risks. For investors, Emerson’s profile suits those prioritizing margin expansion, while IDEX appeals to those valuing consistent earnings with moderate growth.
Financial Ratios Comparison
These vital ratios act as a diagnostic tool to expose the underlying fiscal health, valuation premiums, and capital efficiency of two industrial companies:
| Ratios | Emerson Electric Co. (EMR) | IDEX Corporation (IEX) |
|---|---|---|
| ROE | 11.3% | 12.0% |
| ROIC | 4.6% | 8.6% |
| P/E | 32.4 | 27.7 |
| P/B | 3.67 | 3.33 |
| Current Ratio | 0.88 | 2.86 |
| Quick Ratio | 0.65 | 2.02 |
| D/E | 0.68 | 0.00 |
| Debt-to-Assets | 32.8% | 0.01% |
| Interest Coverage | 5.78 | 11.18 |
| Asset Turnover | 0.43 | 0.50 |
| Fixed Asset Turnover | 5.14 | 7.39 |
| Payout Ratio | 52.0% | 44.0% |
| Dividend Yield | 1.60% | 1.59% |
| Fiscal Year | 2025 | 2025 |
Efficiency & Valuation Duel: The Vital Signs
Financial ratios act as a company’s DNA, exposing hidden risks and revealing operational strengths essential for informed investing.
Emerson Electric Co.
Emerson shows moderate profitability with an 11.3% ROE and a healthy 12.7% net margin, but its 32.4 P/E signals an expensive valuation. The low 4.6% ROIC below its 8.8% WACC raises efficiency concerns. Emerson maintains a 1.6% dividend yield, balancing modest shareholder returns amid stretched valuation metrics.
IDEX Corporation
IDEX posts a slightly better 12.0% ROE and a 14.0% net margin, with a lower yet still elevated 27.7 P/E ratio. Its 8.7% ROIC aligns closely with WACC, indicating sound capital efficiency. A solid current ratio and zero debt support financial stability. IDEX’s 1.59% dividend yield complements its favorable operational profile.
Balanced Operational Strength vs. Valuation Discipline
IDEX offers a better mix of profitability and capital efficiency with fewer financial risks than Emerson. Emerson’s stretched valuation and weaker ROIC suggest higher risk. Investors prioritizing operational strength and financial health may lean toward IDEX, while those accepting valuation premiums face Emerson’s profile.
Which one offers the Superior Shareholder Reward?
I compare Emerson Electric Co. (EMR) and IDEX Corporation (IEX) by their dividend yields, payout ratios, and buyback intensity. EMR yields 1.6% with a 52% payout, balancing dividends and buybacks sustainably. IEX yields 1.6% with a 44% payout but maintains higher free cash flow per share ($8.2 vs. $4.7B) and stronger buyback capacity. IEX’s lower leverage and higher operating margins signal a more sustainable distribution model. For total shareholder return in 2026, I favor IEX due to its robust free cash flow, prudent payout, and aggressive buybacks.
Comparative Score Analysis: The Strategic Profile
The radar chart reveals the fundamental DNA and trade-offs of Emerson Electric Co. and IDEX Corporation, showcasing each firm’s core strengths and weaknesses:
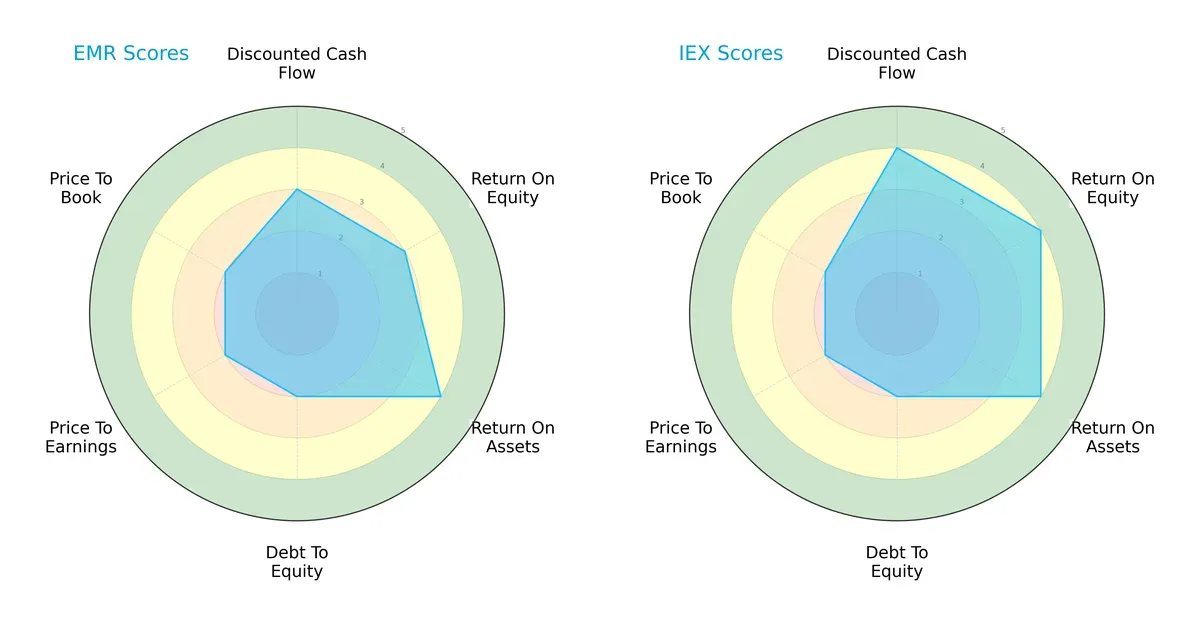
I observe that IDEX leads with stronger discounted cash flow, return on equity, and return on assets scores, reflecting superior profitability and asset efficiency. Emerson Electric presents a more moderate profile but lags notably in debt-to-equity and valuation metrics. IDEX’s profile is more balanced, while Emerson depends on specific operational strengths amid financial leverage concerns.
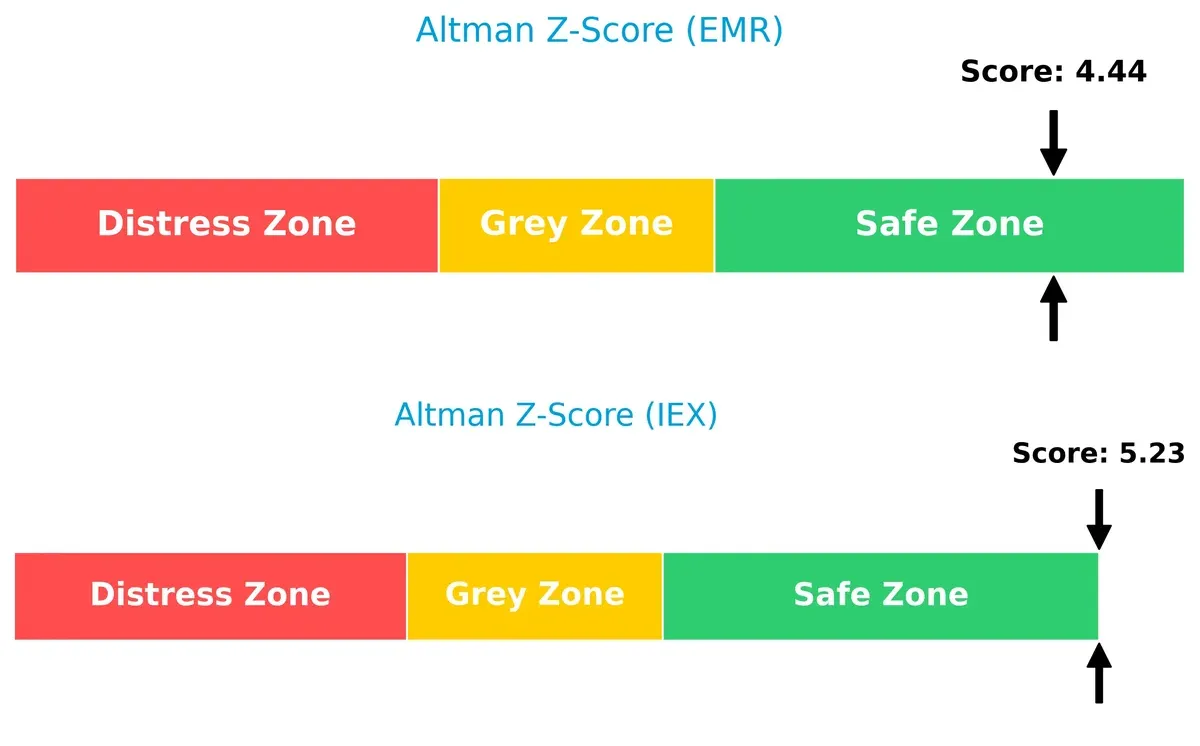
Bankruptcy Risk: Solvency Showdown
IDEX’s Altman Z-Score of 5.23 surpasses Emerson’s 4.44, indicating a stronger buffer against bankruptcy risk in this late-cycle environment:
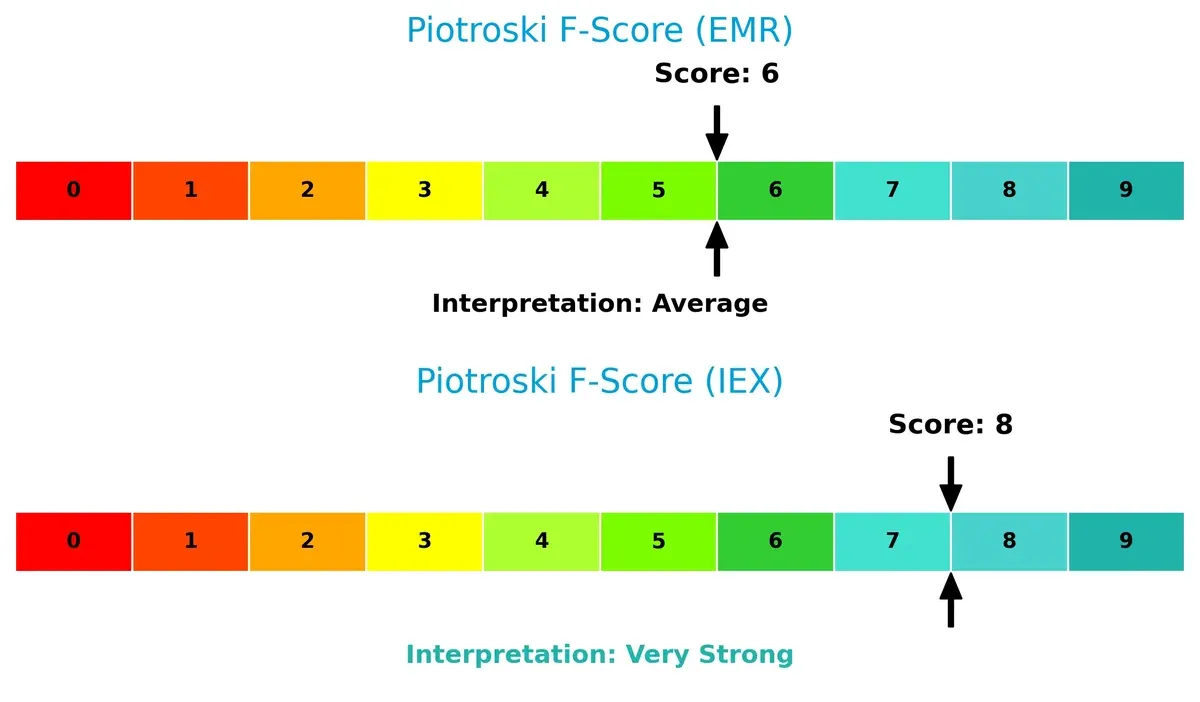
Financial Health: Quality of Operations
IDEX’s Piotroski F-Score of 8 signals robust financial health and operational quality compared to Emerson’s average score of 6, which raises minor internal red flags:
How are the two companies positioned?
This section dissects Emerson Electric Co. and IDEX Corporation’s operational DNA by comparing revenue distribution and internal strengths and weaknesses. The goal is to confront their economic moats and identify which model offers the most resilient competitive advantage in today’s market.
Revenue Segmentation: The Strategic Mix
The following visual comparison dissects how Emerson Electric Co. and IDEX Corporation diversify their income streams and where their primary sector bets lie:
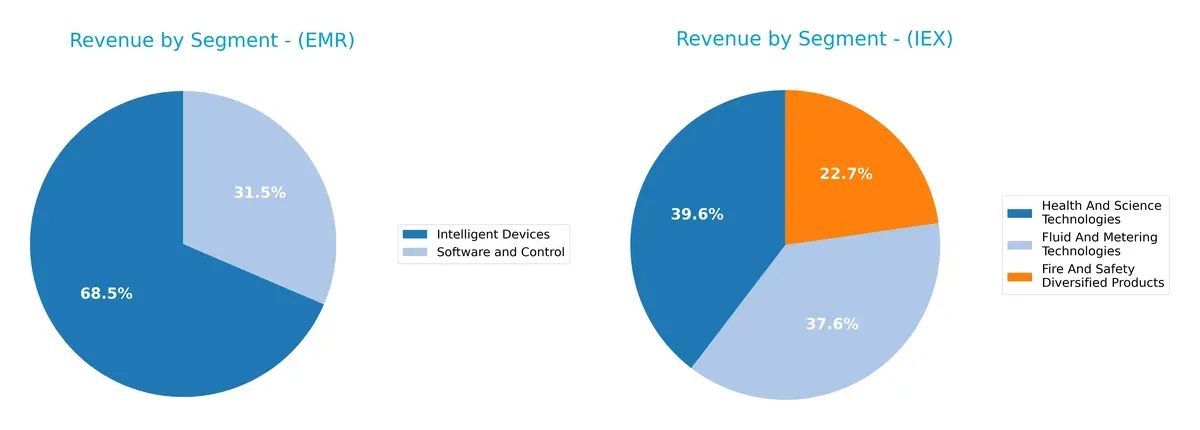
Emerson Electric Co. pivots heavily on Intelligent Devices with $12.4B in 2025, anchoring its revenue while Software and Control contributes $5.7B. In contrast, IDEX Corporation shows a more balanced mix: Health and Science Technologies at $1.3B, Fluid and Metering Technologies at $1.2B, and Fire and Safety Diversified Products at $744M. Emerson’s concentration signals infrastructure dominance but poses concentration risk. IDEX’s diversified streams reduce single-segment dependency, supporting resilience.
Strengths and Weaknesses Comparison
This table compares the strengths and weaknesses of Emerson Electric Co. (EMR) and IDEX Corporation (IEX):
EMR Strengths
- Diversified product segments including Intelligent Devices and Software and Control
- Global presence across Americas, Asia, Middle East & Africa, and Europe
- Favorable net margin of 12.73%
- Strong fixed asset turnover at 5.14
- Favorable interest coverage ratio of 8.19
IEX Strengths
- Favorable net margin of 13.98%
- Strong current and quick ratios indicating solid liquidity
- Zero debt-to-equity ratio and minimal debt-to-assets
- High fixed asset turnover at 7.39
- Favorable interest coverage of 10.82
- Global presence with steady revenues from the United States, Europe, and Asia
EMR Weaknesses
- Unfavorable ROIC of 4.6% below WACC at 8.84%
- Unfavorable valuation metrics: PE 32.42 and PB 3.67
- Low current ratio of 0.88 and quick ratio of 0.65 indicating liquidity risk
- Unfavorable asset turnover at 0.43
- Slightly unfavorable overall financial ratios
IEX Weaknesses
- Unfavorable PE of 27.73 and PB of 3.33
- Unfavorable asset turnover at 0.5 despite strong liquidity
- Slightly unfavorable valuation metrics
Emerson Electric exhibits broad diversification and a strong global footprint but faces challenges in returns on invested capital and liquidity ratios. IDEX shows superior liquidity and debt management with favorable profitability but contends with valuation and asset utilization concerns. These factors shape each company’s strategic financial positioning.
The Moat Duel: Analyzing Competitive Defensibility
A structural moat is the sole shield protecting long-term profits from relentless competition erosion. Let’s dissect Emerson Electric and IDEX Corporation’s moats:
Emerson Electric Co.: Intangible Assets Powering Industrial Solutions
Emerson’s moat centers on intangible assets—proprietary technology and engineering expertise. This manifests in stable margins and a 12.7% net margin. However, declining ROIC signals weakening capital efficiency in 2026, challenging its moat’s durability.
IDEX Corporation: Precision Engineering with Niche Market Focus
IDEX relies on specialized product innovation and niche market penetration, contrasting Emerson’s broader industrial scope. Its 14% net margin and disciplined cost control bolster its position, but declining ROIC hints at emerging competitive pressures.
Verdict: Intangible Assets vs. Niche Specialization in Value Creation
Both firms suffer declining ROIC trends, signaling value destruction. Yet, IDEX’s focused niche and margin discipline offer a slightly deeper moat than Emerson’s broad but weakening intangible asset base. IDEX appears better equipped to defend market share amid rising competition.
Which stock offers better returns?
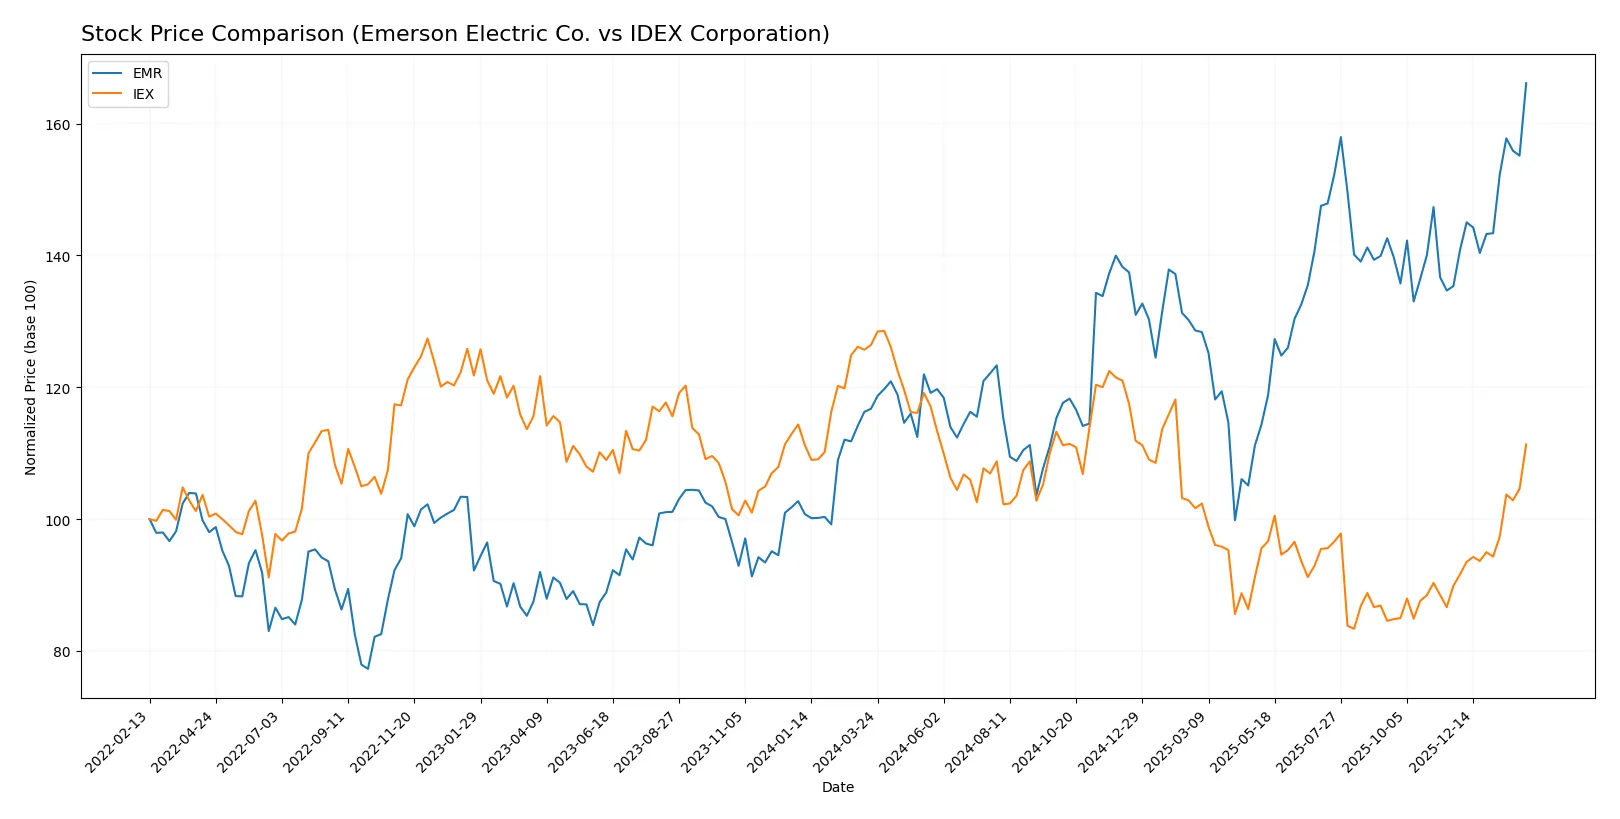
Over the past year, Emerson Electric Co. surged 42.3%, while IDEX Corporation declined 11.9%, showing contrasting market dynamics and notable trading volume shifts.
Trend Comparison
Emerson Electric Co.’s stock shows a strong bullish trend with a 42.3% gain over 12 months, accelerating price appreciation and a volatility of 13.47%. It reached a high of 157.38.
IDEX Corporation experienced a bearish trend, dropping 11.9% over the same period despite recent acceleration. Volatility is higher at 22.67%, with a peak price of 244.02.
Emerson Electric Co. outperformed IDEX Corporation, delivering robust positive returns versus IDEX’s decline, despite both showing recent price acceleration.
Target Prices
Analysts show a constructive outlook on Emerson Electric Co. and IDEX Corporation, with target prices signaling upside potential.
| Company | Target Low | Target High | Consensus |
|---|---|---|---|
| Emerson Electric Co. | 125 | 185 | 164 |
| IDEX Corporation | 220 | 247 | 236 |
Emerson Electric’s consensus target at $164 sits modestly above its current $157 price, indicating moderate upside. IDEX’s $236 consensus target suggests a more substantial premium over its $211 market price.

Don’t Let Luck Decide Your Entry Point
Optimize your entry points with our advanced ProRealTime indicators. You’ll get efficient buy signals with precise price targets for maximum performance. Start outperforming now!
How do institutions grade them?
Emerson Electric Co. Grades
Here are the latest grades from major financial institutions for Emerson Electric Co.:
| Grading Company | Action | New Grade | Date |
|---|---|---|---|
| Evercore ISI Group | maintain | Outperform | 2026-02-05 |
| Deutsche Bank | downgrade | Hold | 2026-02-05 |
| Wells Fargo | maintain | Equal Weight | 2026-02-04 |
| Citigroup | maintain | Buy | 2026-02-04 |
| Oppenheimer | downgrade | Perform | 2026-01-27 |
| JP Morgan | maintain | Neutral | 2026-01-16 |
| Wells Fargo | maintain | Equal Weight | 2026-01-07 |
| Barclays | maintain | Equal Weight | 2026-01-07 |
| UBS | upgrade | Buy | 2026-01-05 |
| Jefferies | downgrade | Hold | 2025-12-10 |
IDEX Corporation Grades
Below are the recent grades from recognized firms for IDEX Corporation:
| Grading Company | Action | New Grade | Date |
|---|---|---|---|
| Argus Research | upgrade | Buy | 2026-02-06 |
| TD Cowen | maintain | Buy | 2026-02-05 |
| Citigroup | maintain | Buy | 2026-02-05 |
| DA Davidson | maintain | Neutral | 2026-02-05 |
| RBC Capital | maintain | Outperform | 2026-02-05 |
| Stifel | maintain | Buy | 2026-01-23 |
| Citigroup | maintain | Buy | 2025-12-08 |
| RBC Capital | maintain | Outperform | 2025-10-30 |
| Stifel | maintain | Buy | 2025-10-20 |
| Oppenheimer | maintain | Outperform | 2025-10-07 |
Which company has the best grades?
IDEX Corporation consistently receives higher grades, including multiple “Outperform” ratings. Emerson Electric shows mixed grades with downgrades and equal weight ratings. IDEX’s stronger grades suggest better market sentiment and potential investor confidence.
Risks specific to each company
The following categories identify critical pressure points and systemic threats facing Emerson Electric Co. and IDEX Corporation in the 2026 market environment:
1. Market & Competition
Emerson Electric Co.
- Faces intense competition in diverse industrial segments with moderate innovation pressure.
IDEX Corporation
- Competes in specialized fluid and safety markets with niche product strength but limited scale.
2. Capital Structure & Debt
Emerson Electric Co.
- Moderate leverage with debt-to-assets near 33%, raising financial risk slightly. Current and quick ratios below 1 indicate liquidity constraints.
IDEX Corporation
- Virtually no debt, showcasing a very strong balance sheet and excellent liquidity with current ratio near 2.9.
3. Stock Volatility
Emerson Electric Co.
- Beta of 1.25 signals above-market volatility, increasing risk in turbulent markets.
IDEX Corporation
- Beta near 0.98 indicates stock moves roughly in line with market, reflecting moderate volatility.
4. Regulatory & Legal
Emerson Electric Co.
- Global operations expose it to complex regulations, especially in energy and environmental sectors.
IDEX Corporation
- Faces regulatory scrutiny mainly in medical and safety product compliance, a narrower but critical scope.
5. Supply Chain & Operations
Emerson Electric Co.
- Large, global supply chains vulnerable to geopolitical disruptions and inflationary input costs.
IDEX Corporation
- Smaller scale and focused segments reduce exposure but limit operational flexibility.
6. ESG & Climate Transition
Emerson Electric Co.
- Industrial footprint and energy-intensive operations pose ESG transition challenges amid tightening regulations.
IDEX Corporation
- Product innovation in health and safety supports ESG credentials, easing transition risks.
7. Geopolitical Exposure
Emerson Electric Co.
- Significant international footprint creates exposure to trade tensions and regional instability.
IDEX Corporation
- More US-centric operations limit geopolitical risk but reduce growth opportunities abroad.
Which company shows a better risk-adjusted profile?
IDEX Corporation exhibits a more favorable risk-adjusted profile. Its minimal debt and strong liquidity mitigate financial risks. Emerson’s leverage and liquidity ratios pose concerns amid volatile market conditions. Emerson’s higher beta also signals greater stock price swings. IDEX’s operational focus and strong Piotroski score (8 vs. 6) suggest more resilient financial health. Emerson’s key risk lies in liquidity constraints while IDEX must manage market competition and valuation pressures. The contrast in capital structure and liquidity is the defining risk divergence for 2026.
Final Verdict: Which stock to choose?
Emerson Electric Co. stands out for its resilience and operational efficiency in a capital-intensive industry. Its superpower lies in steady cash generation and favorable income metrics, despite a concerning liquidity position that demands close monitoring. It fits portfolios targeting steady industrial exposure with moderate growth aspirations.
IDEX Corporation’s strategic moat is its lean balance sheet and robust liquidity, offering a safer harbor amid market volatility. It maintains healthier capital efficiency and a more favorable financial profile than Emerson, appealing to investors who prioritize stability combined with reasonable growth potential.
If you prioritize operational cash flow strength and industrial sector exposure, Emerson Electric is compelling, thanks to its solid income fundamentals despite some financial leverage concerns. However, if you seek a combination of capital discipline and balance sheet safety, IDEX offers better stability and a cleaner financial profile for more risk-averse investors.
Disclaimer: Investment carries a risk of loss of initial capital. The past performance is not a reliable indicator of future results. Be sure to understand risks before making an investment decision.
Go Further
I encourage you to read the complete analyses of Emerson Electric Co. and IDEX Corporation to enhance your investment decisions: