Home > Comparison > Industrials > EMR vs FTV
The strategic rivalry between Emerson Electric Co. and Fortive Corporation shapes the trajectory of the industrial and technology sectors. Emerson, a diversified industrial machinery powerhouse, contrasts with Fortive’s specialized technology and professional equipment focus. This head-to-head reflects a battle between broad industrial scale and targeted innovation-driven growth. This analysis aims to identify which corporate strategy delivers superior risk-adjusted returns for a well-diversified portfolio in 2026.
Table of contents
Companies Overview
Emerson Electric Co. and Fortive Corporation stand as influential players shaping industrial and technology markets in 2026.
Emerson Electric Co.: Industrial Automation Powerhouse
Emerson Electric Co. leads as a technology and engineering company focused on industrial, commercial, and residential markets. Its core revenue derives from Automation Solutions, including measurement instruments and process control software, and Commercial & Residential Solutions offering HVAC and appliance controls. In 2026, Emerson sharpens its edge through advanced automation and energy management technologies, reinforcing its broad industrial footprint.
Fortive Corporation: Precision Tech Innovator
Fortive Corporation operates in the technology sector, specializing in professional engineered products and software. Its growth engine lies in Intelligent Operating Solutions and Precision Technologies, delivering connected tools, calibration devices, and healthcare hardware. In 2026, Fortive doubles down on integrated software and hardware platforms to enhance asset management and operational reliability across diverse sectors like healthcare and manufacturing.
Strategic Collision: Similarities & Divergences
Both companies emphasize operational excellence but diverge in approach: Emerson pursues a broad industrial automation ecosystem, while Fortive focuses on precision tools and software integration. Their primary battleground is industrial automation and asset management where Emerson’s scale meets Fortive’s specialized tech. Investors face distinct profiles—Emerson offers industrial breadth and legacy strength; Fortive presents niche innovation and software-driven growth.
Income Statement Comparison
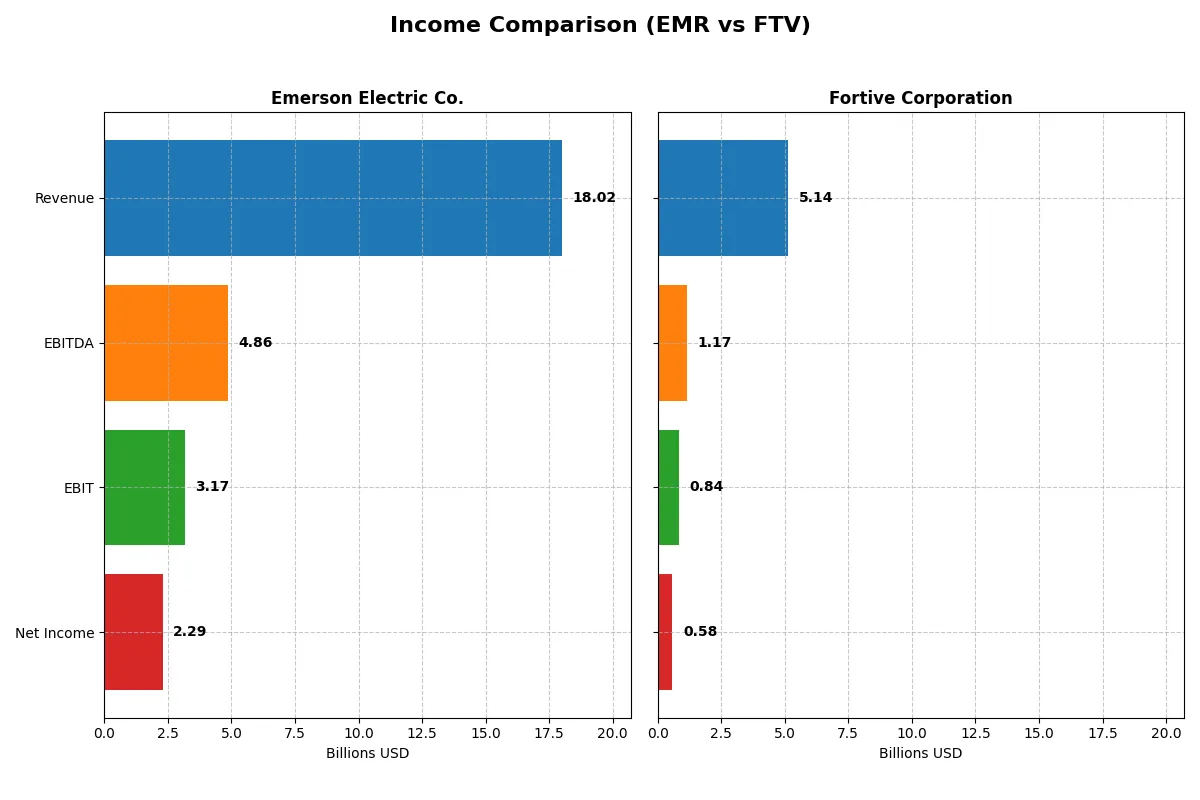
The following data dissects the core profitability and scalability of both corporate engines to reveal who dominates the bottom line:
| Metric | Emerson Electric Co. (EMR) | Fortive Corporation (FTV) |
|---|---|---|
| Revenue | 18.0B | 5.1B |
| Cost of Revenue | 8.5B | 2.0B |
| Operating Expenses | 7.3B | 2.2B |
| Gross Profit | 9.5B | 3.1B |
| EBITDA | 4.9B | 1.2B |
| EBIT | 3.2B | 0.8B |
| Interest Expense | 387M | 121M |
| Net Income | 2.3B | 579M |
| EPS | 4.06 | 1.75 |
| Fiscal Year | 2025 | 2025 |
Income Statement Analysis: The Bottom-Line Duel
This income statement comparison unveils which company runs its financial engine with greater efficiency and momentum.
Emerson Electric Co. Analysis
Emerson Electric Co. shows steady revenue growth, reaching 18B in 2025, with net income at 2.29B. Gross margin remains robust above 52%, while net margin improved to 12.7%. The company accelerates EBIT by 35% year-over-year, signaling efficient cost control and expanding profitability despite moderate revenue growth.
Fortive Corporation Analysis
Fortive’s revenue declined 17.5% to 5.14B in 2025, with net income falling to 579M. Despite a strong gross margin near 61%, all key profitability metrics shrank over the past year, including EBIT and net margin. The drop in revenue and earnings reflects operational headwinds and less efficient cost management in the latest fiscal year.
Margin Strength vs. Revenue Resilience
Emerson Electric delivers superior revenue growth and expanding EBIT margins, while Fortive struggles with shrinking top and bottom lines despite higher gross margins. Emerson’s consistent profit momentum and cost discipline position it as the more fundamentally sound operator. Investors seeking resilient growth may favor Emerson’s profile over Fortive’s recent contraction.
Financial Ratios Comparison
These vital ratios act as a diagnostic tool to expose the underlying fiscal health, valuation premiums, and capital efficiency of each company:
| Ratios | Emerson Electric Co. (EMR) | Fortive Corporation (FTV) |
|---|---|---|
| ROE | 11.3% | 9.0% |
| ROIC | 4.6% | 7.4% |
| P/E | 32.4 | 30.2 |
| P/B | 3.67 | 2.71 |
| Current Ratio | 0.88 | 0.71 |
| Quick Ratio | 0.65 | 0.58 |
| D/E (Debt-to-Equity) | 0.68 | 0.50 |
| Debt-to-Assets | 32.8% | 27.3% |
| Interest Coverage | 5.78 | 7.54 |
| Asset Turnover | 0.43 | 0.44 |
| Fixed Asset Turnover | 5.14 | 19.06 |
| Payout ratio | 52.0% | 16.0% |
| Dividend yield | 1.60% | 0.53% |
| Fiscal Year | 2025 | 2025 |
Efficiency & Valuation Duel: The Vital Signs
Financial ratios serve as a company’s DNA, unveiling both hidden risks and operational strengths that drive market performance.
Emerson Electric Co.
Emerson posts a solid net margin of 12.73% but delivers a modest ROE of 11.31%, reflecting moderate profitability. The stock trades at a stretched P/E of 32.42 and a high P/B of 3.67, signaling expensive valuation. Shareholders receive a neutral dividend yield of 1.6%, balancing returns with reinvestment prudence amid slightly unfavorable overall ratios.
Fortive Corporation
Fortive shows a favorable net margin of 11.26% but a weaker ROE at 8.98%, indicating less efficient equity use. Its P/E of 30.16 remains high, though P/B at 2.71 appears more reasonable. The company’s lower 0.53% dividend yield suggests limited payout, favoring internal growth. Fortive’s ratio profile is more balanced, with a neutral global rating despite some liquidity concerns.
Premium Valuation vs. Operational Safety
Emerson’s higher profitability contrasts with its stretched valuation and weaker capital efficiency. Fortive offers a more balanced risk profile, with better debt management and operational efficiency. Value-seeking investors might prefer Fortive’s cautious stance, while growth-focused investors may tolerate Emerson’s premium pricing for steadier margins.
Which one offers the Superior Shareholder Reward?
I compare Emerson Electric Co. (EMR) and Fortive Corporation (FTV) on dividends, payout ratios, and buybacks for 2026. EMR yields 1.6% with a high 52% payout ratio, signaling solid dividend coverage but a cautious distribution stance. FTV yields only 0.53%, with a conservative 16% payout ratio, prioritizing reinvestment and growth. EMR’s free cash flow per share stands at $4.7B, supporting dividends and moderate buybacks. FTV’s $3.1B free cash flow backs modest dividends and aggressive buybacks, enhancing shareholder returns. EMR’s model balances income with buybacks, while FTV’s low yield but active buybacks suggest capital return via repurchases. Given EMR’s sustainable dividend backed by strong free cash flow and buybacks, I see EMR offering a more attractive total return profile for 2026 investors.
Comparative Score Analysis: The Strategic Profile
The radar chart reveals the fundamental DNA and trade-offs of Emerson Electric Co. and Fortive Corporation, highlighting their strategic strengths and vulnerabilities:
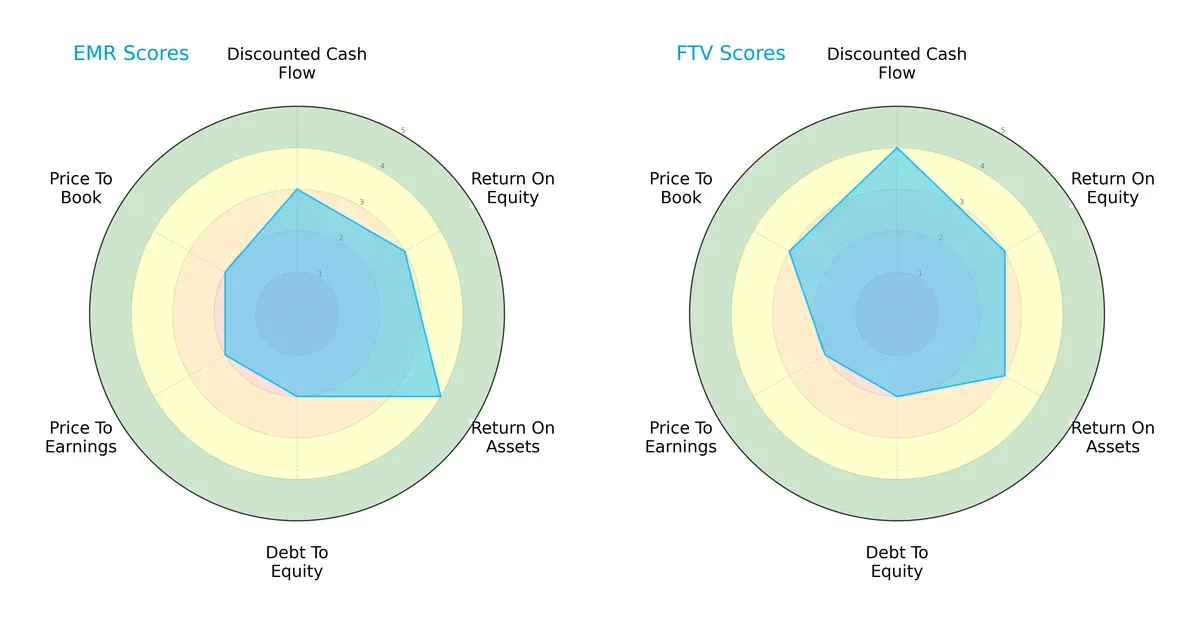
Emerson Electric Co. excels in asset utilization with a ROA score of 4 but lags in valuation metrics, showing weaker price-to-earnings and price-to-book scores. Fortive Corporation leads in discounted cash flow with a score of 4 and holds a more favorable price-to-book ratio. Both share moderate overall and return on equity scores but carry similar debt-to-equity risks. Fortive presents a more balanced financial profile, while Emerson relies heavily on operational efficiency.
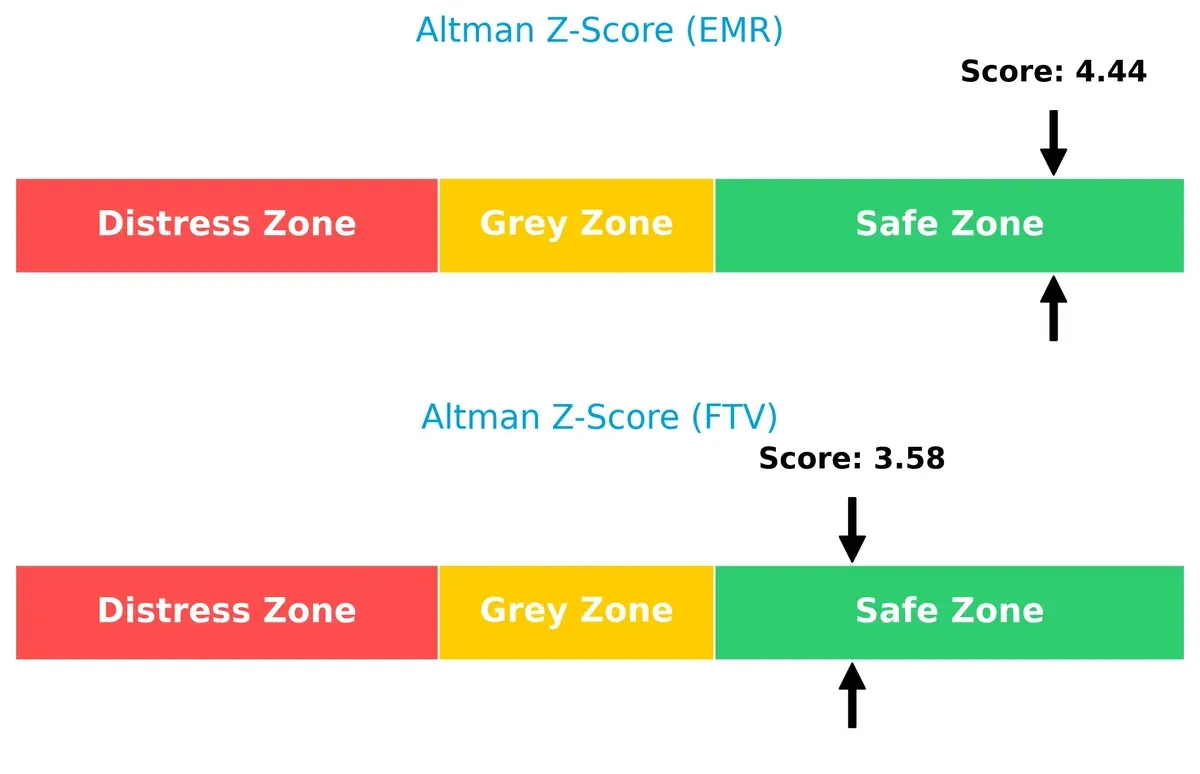
Bankruptcy Risk: Solvency Showdown
Emerson’s Altman Z-Score at 4.44 surpasses Fortive’s 3.58, indicating a stronger buffer against bankruptcy risks in this economic cycle:
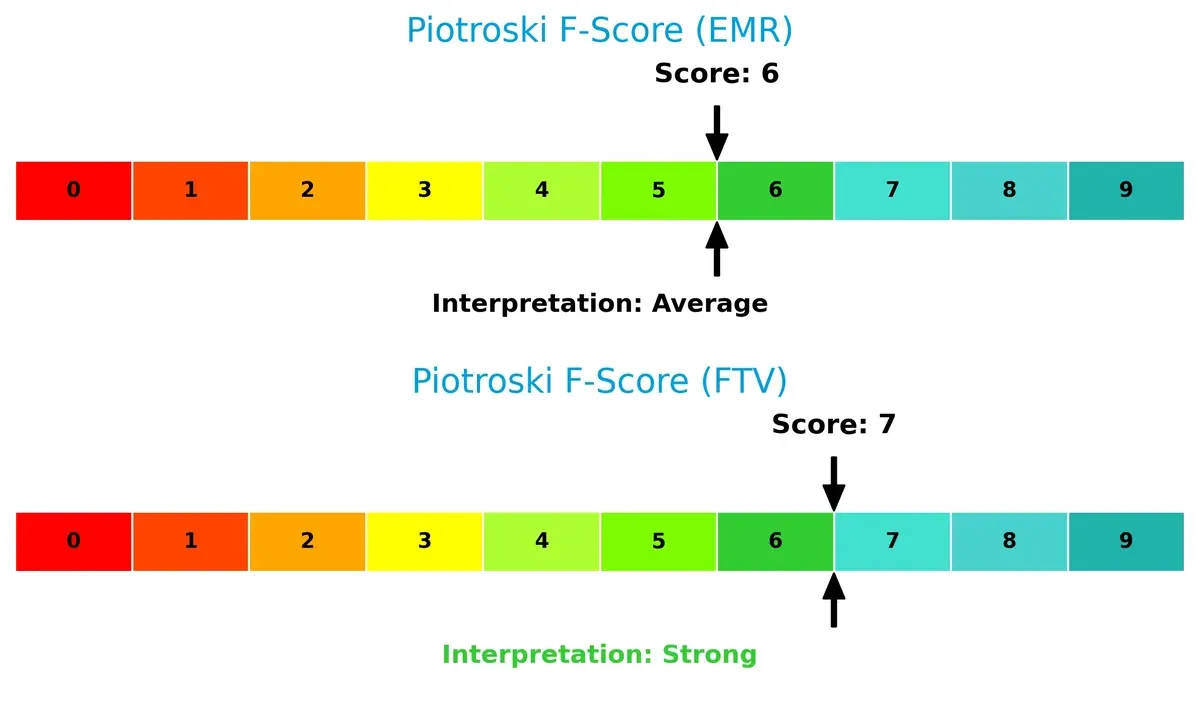
Financial Health: Quality of Operations
Fortive’s Piotroski F-Score of 7 edges out Emerson’s 6, signaling stronger internal financial health and operational quality without red flags:
How are the two companies positioned?
This section dissects the operational DNA of EMR and FTV by comparing their revenue distribution and internal dynamics, including strengths and weaknesses. The goal is to confront their economic moats and reveal which model delivers a more resilient, sustainable advantage today.
Revenue Segmentation: The Strategic Mix
This comparison dissects how Emerson Electric Co. and Fortive Corporation diversify their income streams and reveals their primary sector bets:
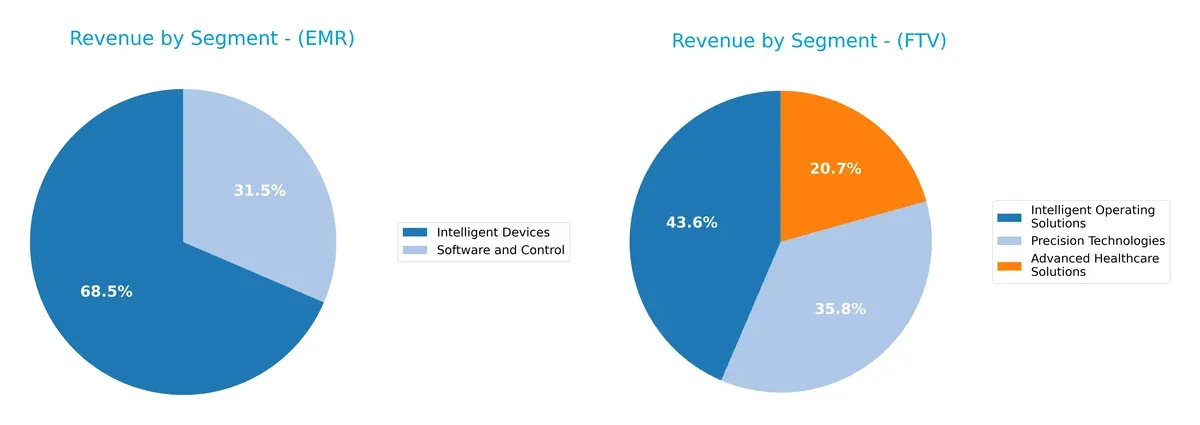
Emerson Electric Co. anchors revenue heavily in Intelligent Devices with $12.4B and Software and Control at $5.7B, showing a focused but evolving mix. Fortive Corporation presents a more balanced segmentation with Intelligent Operating Solutions at $2.7B, Precision Technologies at $2.2B, and Advanced Healthcare Solutions at $1.3B. Emerson’s concentration suggests infrastructure dominance, while Fortive’s diversification mitigates concentration risk and supports ecosystem lock-in.
Strengths and Weaknesses Comparison
This table compares the Strengths and Weaknesses of Emerson Electric Co. (EMR) and Fortive Corporation (FTV):
EMR Strengths
- Diverse revenue streams from Intelligent Devices and Software & Control
- Favorable net margin of 12.73%
- Strong interest coverage at 8.19
- Balanced debt-to-assets at 32.79%
- Solid fixed asset turnover of 5.14
- Significant global sales in Americas and Asia
FTV Strengths
- Diverse segments including Advanced Healthcare and Precision Technologies
- Favorable net margin of 11.26%
- Favorable WACC at 7.86% supports capital efficiency
- Low debt-to-assets at 27.31%
- High fixed asset turnover of 19.06
- Strong U.S. market presence with expanding international sales
EMR Weaknesses
- ROIC at 4.6% below WACC of 8.84% indicates value destruction
- Unfavorable P/E and P/B ratios suggest overvaluation
- Current and quick ratios below 1 signal liquidity concerns
- Low asset turnover at 0.43 limits operational efficiency
- Neutral ROE at 11.31% shows moderate shareholder returns
FTV Weaknesses
- ROE of 8.98% underperforms relative to peers
- Unfavorable P/E ratio at 30.16 may limit upside
- Low current and quick ratios imply liquidity constraints
- Dividend yield at 0.53% is weak versus sector
- Neutral P/B ratio suggests moderate market valuation
Emerson shows strength in profitability and global diversification but faces challenges in capital returns and liquidity. Fortive excels in asset turnover and capital costs but must improve shareholder returns and liquidity. Both companies maintain diversified operations and global reach, impacting their strategic priorities.
The Moat Duel: Analyzing Competitive Defensibility
A structural moat protects a company’s long-term profits from relentless competitive erosion. Let’s examine how Emerson Electric and Fortive defend their turf:
Emerson Electric Co.: Industrial Engineering with Broad Geographic Reach
Emerson’s moat hinges on scale and intangible assets in industrial automation, reflected in stable margins near 17.6% EBIT. However, its declining ROIC signals shrinking capital efficiency, threatening moat durability in 2026.
Fortive Corporation: Technology-Driven Precision Tools and Software
Fortive’s competitive edge lies in its specialized technology and software integration, driving higher gross margins near 61%. Despite value destruction, its rising ROIC trend suggests improving operational effectiveness and growth potential.
Scale and Innovation: Emerson’s Industrial Breadth vs. Fortive’s Tech Focus
Emerson’s vast industrial footprint offers a wide moat but currently suffers declining profitability. Fortive’s tech-centric model builds a narrower yet deepening moat through innovation and margin expansion. Fortive appears better positioned to enhance its market defense moving forward.
Which stock offers better returns?
The past year shows Emerson Electric Co. surging with strong price gains and accelerating momentum, while Fortive Corporation faces a declining trend despite recent modest recovery.
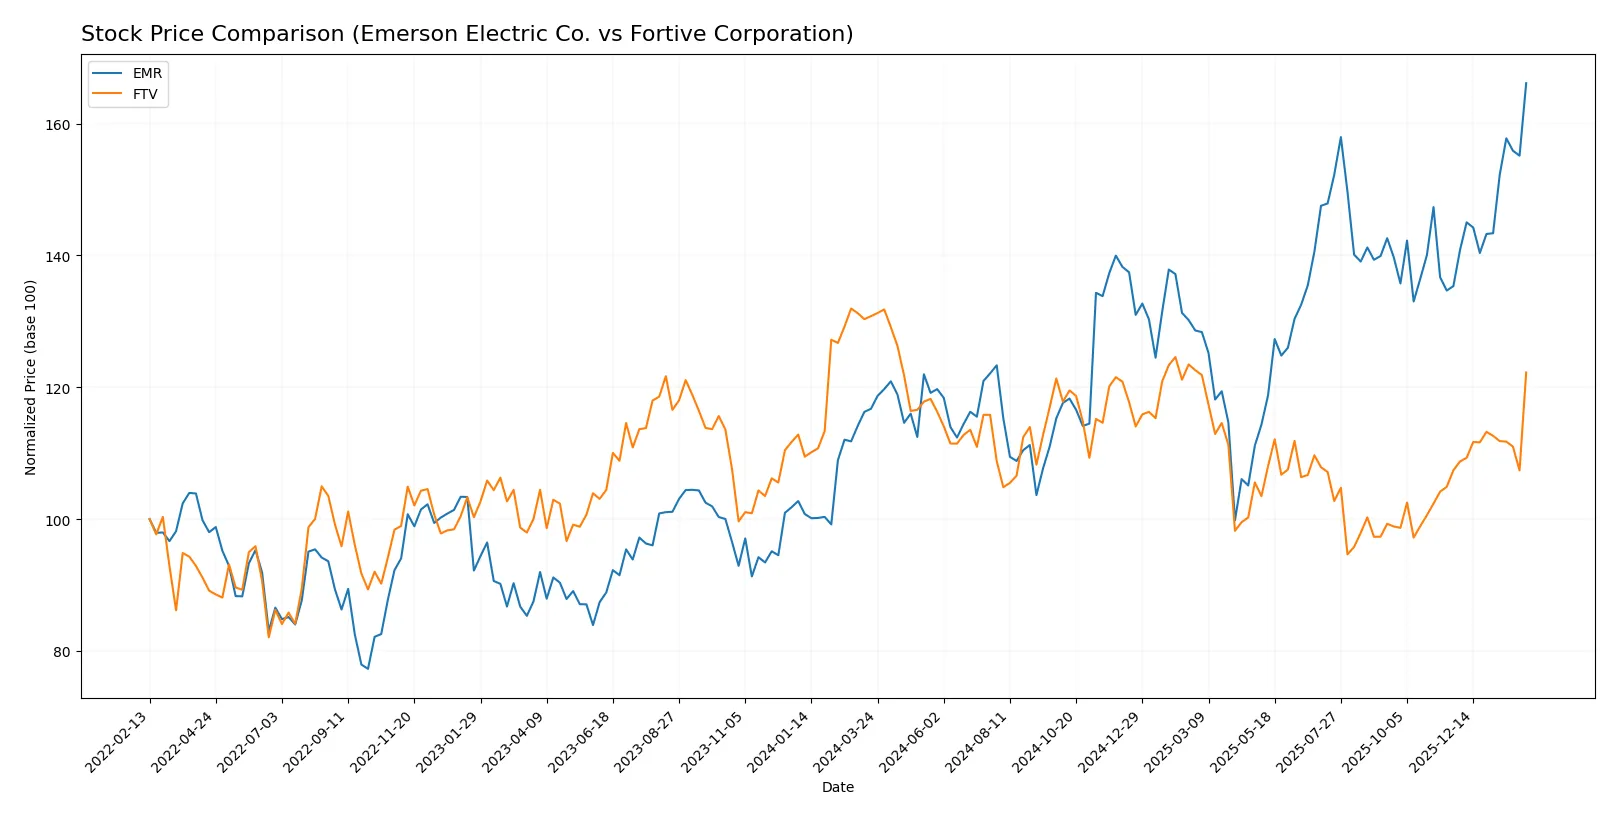
Trend Comparison
Emerson Electric Co. exhibits a bullish trend with a 42.31% price increase over 12 months. The trend accelerates, hitting a high of 157.38 and a low of 94.57.
Fortive Corporation shows a bearish trend, dropping 6.53% over the same period. Despite recent 13.82% gains, overall momentum remains negative with lower volatility.
Emerson outperforms Fortive markedly, delivering superior market returns and stronger bullish momentum over the past year.
Target Prices
Analysts project moderate upside potential for Emerson Electric Co. and Fortive Corporation.
| Company | Target Low | Target High | Consensus |
|---|---|---|---|
| Emerson Electric Co. | 125 | 185 | 163.64 |
| Fortive Corporation | 51 | 70 | 59.83 |
Emerson’s consensus target stands about 4% above its current price of $157.38, signaling modest growth expectations. Fortive’s target consensus aligns closely with its $60.12 market price, suggesting a balanced risk-reward outlook.

Don’t Let Luck Decide Your Entry Point
Optimize your entry points with our advanced ProRealTime indicators. You’ll get efficient buy signals with precise price targets for maximum performance. Start outperforming now!
How do institutions grade them?
Here is a summary of the latest institutional grades for Emerson Electric Co. and Fortive Corporation:
Emerson Electric Co. Grades
The following table shows Emerson Electric Co.’s recent grades from major grading firms.
| Grading Company | Action | New Grade | Date |
|---|---|---|---|
| Evercore ISI Group | maintain | Outperform | 2026-02-05 |
| Deutsche Bank | downgrade | Hold | 2026-02-05 |
| Wells Fargo | maintain | Equal Weight | 2026-02-04 |
| Citigroup | maintain | Buy | 2026-02-04 |
| Oppenheimer | downgrade | Perform | 2026-01-27 |
| JP Morgan | maintain | Neutral | 2026-01-16 |
| Wells Fargo | maintain | Equal Weight | 2026-01-07 |
| Barclays | maintain | Equal Weight | 2026-01-07 |
| UBS | upgrade | Buy | 2026-01-05 |
| Jefferies | downgrade | Hold | 2025-12-10 |
Fortive Corporation Grades
Below is a summary of Fortive Corporation’s recent institutional grades.
| Grading Company | Action | New Grade | Date |
|---|---|---|---|
| Wells Fargo | maintain | Equal Weight | 2026-02-05 |
| RBC Capital | maintain | Sector Perform | 2026-02-05 |
| Citigroup | maintain | Neutral | 2026-02-05 |
| JP Morgan | downgrade | Underweight | 2026-01-16 |
| Mizuho | downgrade | Underperform | 2026-01-05 |
| Wells Fargo | maintain | Equal Weight | 2025-12-22 |
| Citigroup | maintain | Neutral | 2025-12-08 |
| Morgan Stanley | maintain | Equal Weight | 2025-11-05 |
| Baird | maintain | Outperform | 2025-11-04 |
| JP Morgan | maintain | Neutral | 2025-10-30 |
Which company has the best grades?
Emerson Electric Co. holds generally stronger grades with multiple “Buy” and “Outperform” ratings, despite some downgrades. Fortive Corporation’s ratings cluster around “Equal Weight” and “Neutral,” with notable downgrades to “Underweight” and “Underperform.” Investors may perceive Emerson as having more favorable institutional sentiment.
Risks specific to each company
The following categories identify the critical pressure points and systemic threats facing both firms in the 2026 market environment:
1. Market & Competition
Emerson Electric Co. (EMR)
- Industrial machinery faces cyclical demand and intense global competition, pressuring margins.
Fortive Corporation (FTV)
- Technology sector competition is fierce, with rapid innovation cycles demanding continuous R&D.
2. Capital Structure & Debt
Emerson Electric Co. (EMR)
- Moderate leverage with D/E at 0.68; interest coverage strong at 8.19x but liquidity ratios below 1 signal short-term risk.
Fortive Corporation (FTV)
- Lower leverage with D/E at 0.5 and good interest coverage at 7x; liquidity ratios also below 1, indicating some short-term strain.
3. Stock Volatility
Emerson Electric Co. (EMR)
- Beta of 1.25 indicates above-market volatility; price range near all-time highs increases risk of correction.
Fortive Corporation (FTV)
- Beta of 1.03 shows moderate volatility; near upper price range but less stretched than EMR.
4. Regulatory & Legal
Emerson Electric Co. (EMR)
- Global industrial footprint exposes EMR to diverse regulatory regimes, increasing compliance complexity.
Fortive Corporation (FTV)
- Technology and healthcare focus subjects FTV to stringent regulatory scrutiny, especially in data privacy and medical device standards.
5. Supply Chain & Operations
Emerson Electric Co. (EMR)
- Complex global supply chain vulnerable to geopolitical disruptions and rising commodity costs.
Fortive Corporation (FTV)
- Supply chain risks mitigated by diversified product lines but sensitive to semiconductor shortages and logistics delays.
6. ESG & Climate Transition
Emerson Electric Co. (EMR)
- Industrial sector pressure to reduce carbon footprint; transition costs could weigh on margins.
Fortive Corporation (FTV)
- Technology segment faces investor and regulatory pressure on sustainability and data ethics compliance.
7. Geopolitical Exposure
Emerson Electric Co. (EMR)
- Broad international presence increases exposure to trade tensions and regional instability.
Fortive Corporation (FTV)
- Concentrated exposure in North America reduces geopolitical risks but limits global growth opportunities.
Which company shows a better risk-adjusted profile?
Fortive’s stronger balance sheet, higher Altman Z-score in the safe zone, and a better Piotroski score reflect superior financial resilience. Emerson’s liquidity weakness and stretched valuation metrics raise caution. Fortive’s diversified tech portfolio offers a more balanced risk-return tradeoff in 2026.
Final Verdict: Which stock to choose?
Emerson Electric Co. boasts a superpower in generating robust cash flows and maintaining a favorable income statement profile. Its point of vigilance lies in a declining ROIC and a weaker liquidity position. Emerson suits portfolios aiming for aggressive growth with tolerance for operational risks.
Fortive Corporation’s strategic moat centers on improving profitability and a more efficient capital structure, underpinned by rising ROIC trends. It offers a relatively safer profile compared to Emerson, though recent revenue declines warrant caution. Fortive fits well within Growth at a Reasonable Price (GARP) strategies favoring stability with moderate upside.
If you prioritize aggressive growth fueled by strong cash generation despite some operational headwinds, Emerson Electric is the compelling choice due to its income strength and bullish price momentum. However, if you seek better stability and improving capital efficiency with a margin of safety, Fortive offers superior risk management and a rising profitability trend, albeit with near-term revenue challenges.
Disclaimer: Investment carries a risk of loss of initial capital. The past performance is not a reliable indicator of future results. Be sure to understand risks before making an investment decision.
Go Further
I encourage you to read the complete analyses of Emerson Electric Co. and Fortive Corporation to enhance your investment decisions: