In the dynamic field of engineering and construction, Quanta Services, Inc. (PWR) and EMCOR Group, Inc. (EME) stand out as influential players with overlapping markets in infrastructure and energy solutions. Both companies emphasize innovation in power and facility services, targeting a broad range of industries from renewable energy to industrial maintenance. This article will analyze their strategies and performance to help you decide which stock offers the most compelling investment opportunity in 2026.
Table of contents
Companies Overview
I will begin the comparison between Quanta Services, Inc. and EMCOR Group, Inc. by providing an overview of these two companies and their main differences.
Quanta Services, Inc. Overview
Quanta Services, Inc. specializes in specialty contracting services globally, focusing on electric power infrastructure, renewable energy facilities, and underground utilities. Their operations include design, construction, maintenance, and upgrades across transmission, distribution, and substations, as well as smart grid and pipeline systems. Headquartered in Houston, Texas, Quanta plays a significant role in energy infrastructure with 58,400 employees and a market cap of $61.3B.
EMCOR Group, Inc. Overview
EMCOR Group, Inc. delivers electrical and mechanical construction and facilities services, mainly in the US and UK. The company provides design, installation, operation, and maintenance for power systems, HVAC, plumbing, fire protection, and building services. With 40,400 staff and a $28.1B market cap, EMCOR supports industrial, commercial, and government clients, including energy, refining, and military sectors, from its base in Norwalk, Connecticut.
Key similarities and differences
Both companies operate in the engineering and construction industry with a focus on infrastructure services. Quanta emphasizes electric power and renewable energy infrastructure globally, while EMCOR offers a broader range of electrical, mechanical, and facilities services primarily in the US and UK. Quanta’s workforce and market cap are larger, reflecting its extensive utility-focused operations, whereas EMCOR provides diverse building and industrial services with a smaller employee base and market value.
Income Statement Comparison
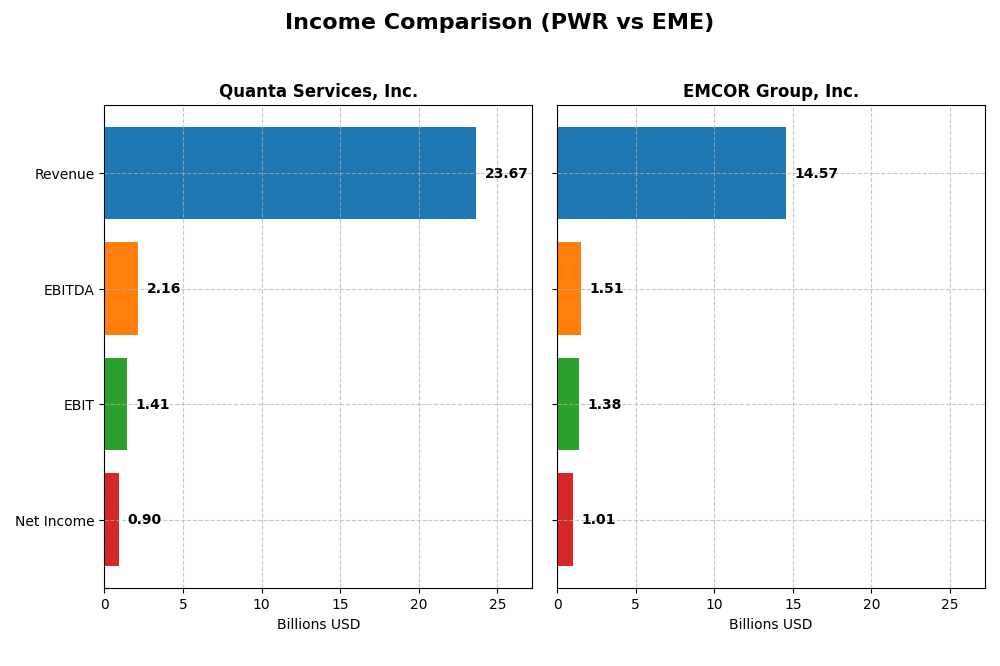
The table below compares key income statement metrics for Quanta Services, Inc. and EMCOR Group, Inc. for the fiscal year 2024.
| Metric | Quanta Services, Inc. (PWR) | EMCOR Group, Inc. (EME) |
|---|---|---|
| Market Cap | 61.3B | 28.1B |
| Revenue | 23.7B | 14.6B |
| EBITDA | 2.16B | 1.51B |
| EBIT | 1.41B | 1.38B |
| Net Income | 905M | 1.01B |
| EPS | 6.16 | 21.61 |
| Fiscal Year | 2024 | 2024 |
Income Statement Interpretations
Quanta Services, Inc.
Quanta Services showed strong growth in revenue from $11.2B in 2020 to $23.7B in 2024, doubling over five years. Net income rose steadily from $446M to $905M, reflecting a favorable increase despite a slight decline in net margin to 3.82%. The 2024 year saw a robust 13.4% revenue increase and a 7.2% net margin improvement, although operating expenses grew proportionally.
EMCOR Group, Inc.
EMCOR experienced revenue growth from $8.8B in 2020 to $14.6B in 2024, a 66% increase, with net income surging from $133M to $1.01B. Margins improved significantly, with a 2024 net margin of 6.91%, up sharply over the period. The latest year reported a 15.8% revenue rise, strong gross profit growth of 32.3%, and a 37.4% net margin increase, despite operating expenses growing in line with revenue.
Which one has the stronger fundamentals?
Both companies demonstrate favorable income statement trends, but EMCOR shows higher margin improvement and more pronounced net income growth, indicating stronger profitability gains. Quanta has doubled revenue and net income but faces slight margin pressure. EMCOR’s efficient cost management and margin expansion suggest comparatively stronger fundamentals based on the available income data.
Financial Ratios Comparison
The table below presents a side-by-side comparison of key financial ratios for Quanta Services, Inc. (PWR) and EMCOR Group, Inc. (EME) based on their most recent fiscal year data (2024).
| Ratios | Quanta Services, Inc. (PWR) | EMCOR Group, Inc. (EME) |
|---|---|---|
| ROE | 12.36% | 34.28% |
| ROIC | 7.99% | 26.38% |
| P/E | 51.32 | 21.01 |
| P/B | 6.35 | 7.20 |
| Current Ratio | 1.30 | 1.30 |
| Quick Ratio | 1.26 | 1.27 |
| D/E (Debt-to-Equity) | 0.61 | 0.12 |
| Debt-to-Assets | 23.97% | 4.52% |
| Interest Coverage | 6.60 | 355.88 |
| Asset Turnover | 1.27 | 1.89 |
| Fixed Asset Turnover | 7.89 | 27.82 |
| Payout Ratio | 5.99% | 4.31% |
| Dividend Yield | 0.12% | 0.21% |
Interpretation of the Ratios
Quanta Services, Inc.
Quanta Services shows a mixed picture with some favorable liquidity and leverage ratios such as a quick ratio of 1.26 and debt-to-assets at 23.97%, indicating solid short-term liquidity and moderate leverage. However, valuation metrics like a high PE of 51.32 and PB of 6.35 raise concerns about overvaluation. The dividend yield remains low at 0.12%, reflecting modest shareholder returns.
EMCOR Group, Inc.
EMCOR Group presents stronger profitability and efficiency ratios, including a robust ROE of 34.28% and ROIC of 26.38%, alongside a very favorable interest coverage ratio of 365.48. Its valuation is more reasonable with a PE of 21.01, although the PB of 7.2 is less attractive. The dividend yield is slightly higher at 0.21%, but still low relative to typical income stocks.
Which one has the best ratios?
Based on the evaluations, EMCOR Group has more favorable ratios overall, with superior profitability, efficiency, and interest coverage metrics. Quanta Services displays neutral to slightly favorable ratios but faces valuation and dividend yield weaknesses. EMCOR’s higher proportion of favorable ratios and stronger returns suggest a comparatively better financial profile.
Strategic Positioning
This section compares the strategic positioning of Quanta Services, Inc. and EMCOR Group, Inc., including their market position, key segments, and exposure to technological disruption:
Quanta Services, Inc.
- Larger market cap at $61.3B, facing competitive pressures in engineering & construction.
- Focused on electric power infrastructure, renewable energy, and underground utilities as main revenue drivers.
- Exposure includes smart grid technologies and renewable energy infrastructure, indicating moderate disruption risk.
EMCOR Group, Inc.
- Market cap of $28.1B, competing mainly in US and UK facilities services and construction.
- Diversified segments including electrical, mechanical, building, industrial, and UK building services.
- Involved in energy solutions and clean-room systems, with broad services reducing technological disruption impact.
Quanta Services, Inc. vs EMCOR Group, Inc. Positioning
Quanta Services has a concentrated focus on electric power and renewable infrastructure, offering specialization advantages but with narrower markets. EMCOR’s diversified portfolio across mechanical, electrical, building, and industrial services spreads risk but may dilute sector focus.
Which has the best competitive advantage?
EMCOR Group demonstrates a strong and growing ROIC significantly above WACC, indicating a durable competitive advantage. Quanta Services shows stable profitability but is currently shedding value with an unfavorable moat evaluation.
Stock Comparison
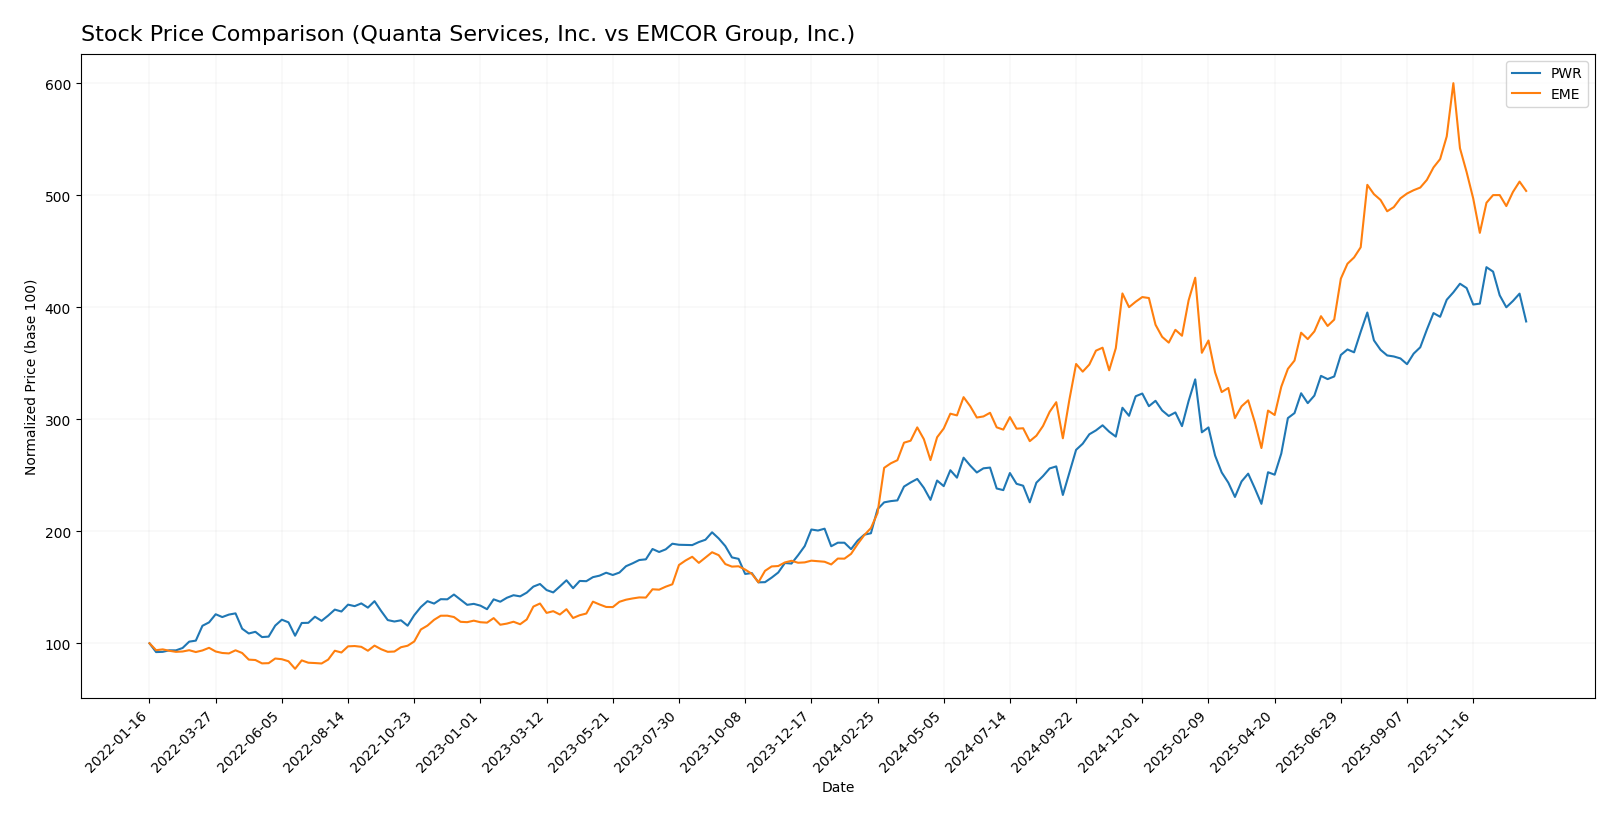
The stock price movements of Quanta Services, Inc. (PWR) and EMCOR Group, Inc. (EME) over the past 12 months exhibit strong overall gains with recent downward adjustments, reflecting dynamic trading conditions and decelerating bullish momentum.
Trend Analysis
Quanta Services, Inc. (PWR) showed a 95.41% price increase over the past year, indicating a bullish trend with decelerating momentum and a high volatility level (std deviation 66.85). The price ranged between 211.44 and 464.88.
EMCOR Group, Inc. (EME) recorded a 148.41% gain over the same period, also reflecting a bullish trend with deceleration and higher volatility (std deviation 112.47). The stock fluctuated between 252.92 and 748.24.
Comparing the two, EMCOR Group (EME) delivered the highest market performance over the last 12 months, outperforming Quanta Services (PWR) despite both experiencing recent price declines.
Target Prices
Analysts present a positive target price consensus for both Quanta Services, Inc. and EMCOR Group, Inc., indicating potential upside from current levels.
| Company | Target High | Target Low | Consensus |
|---|---|---|---|
| Quanta Services, Inc. | 540 | 415 | 486.7 |
| EMCOR Group, Inc. | 800 | 713 | 754.33 |
The consensus target prices suggest that Quanta Services could rise modestly above its current price of 413.17 USD, while EMCOR Group shows a stronger upside potential from 628.27 USD. Overall, analysts expect growth but recommend monitoring market conditions closely.
Analyst Opinions Comparison
This section compares analysts’ ratings and grades for Quanta Services, Inc. (PWR) and EMCOR Group, Inc. (EME):
Rating Comparison
PWR Rating
- Rating: B-, considered very favorable
- Discounted Cash Flow Score: 3, moderate
- ROE Score: 4, favorable
- ROA Score: 3, moderate
- Debt To Equity Score: 2, moderate
- Overall Score: 2, moderate
EME Rating
- Rating: B+, considered very favorable
- Discounted Cash Flow Score: 3, moderate
- ROE Score: 5, very favorable
- ROA Score: 5, very favorable
- Debt To Equity Score: 3, moderate
- Overall Score: 3, moderate
Which one is the best rated?
Based strictly on the provided data, EME holds a higher overall rating (B+) than PWR (B-). EME also scores better on ROE and ROA, indicating stronger profitability and asset use, while both have moderate DCF and debt-to-equity scores.
Scores Comparison
Here is a comparison of the Altman Z-Score and Piotroski Score for Quanta Services, Inc. and EMCOR Group, Inc.:
PWR Scores
- Altman Z-Score: 4.7, indicating a safe zone status, low bankruptcy risk.
- Piotroski Score: 6, reflecting average financial strength.
EME Scores
- Altman Z-Score: 6.9, indicating a safe zone status, very low bankruptcy risk.
- Piotroski Score: 5, reflecting average financial strength.
Which company has the best scores?
EMCOR Group, Inc. has a higher Altman Z-Score (6.9 vs. 4.7), suggesting stronger financial stability. Quanta Services, Inc. has a slightly better Piotroski Score (6 vs. 5). Both show average Piotroski strength and safe Altman zones.
Grades Comparison
Here is a detailed comparison of the recent grades assigned to Quanta Services, Inc. and EMCOR Group, Inc.:
Quanta Services, Inc. Grades
The following table summarizes recent ratings from established grading companies for Quanta Services, Inc.:
| Grading Company | Action | New Grade | Date |
|---|---|---|---|
| Bernstein | Maintain | Market Perform | 2025-12-19 |
| JP Morgan | Upgrade | Overweight | 2025-12-08 |
| Jefferies | Maintain | Buy | 2025-11-03 |
| Citigroup | Maintain | Buy | 2025-10-31 |
| JP Morgan | Maintain | Neutral | 2025-10-31 |
| Evercore ISI Group | Maintain | Outperform | 2025-10-31 |
| Citigroup | Maintain | Buy | 2025-10-20 |
| JP Morgan | Maintain | Neutral | 2025-10-16 |
| Stifel | Maintain | Buy | 2025-10-09 |
| Truist Securities | Maintain | Buy | 2025-10-08 |
Overall, Quanta Services has predominantly received Buy and Outperform grades, with some Neutral and Market Perform ratings, indicating a generally positive outlook from analysts.
EMCOR Group, Inc. Grades
The following table presents recent ratings from recognized grading firms for EMCOR Group, Inc.:
| Grading Company | Action | New Grade | Date |
|---|---|---|---|
| DA Davidson | Maintain | Buy | 2025-10-31 |
| Stifel | Maintain | Buy | 2025-10-13 |
| Goldman Sachs | Maintain | Neutral | 2025-10-08 |
| DA Davidson | Maintain | Buy | 2025-08-01 |
| UBS | Maintain | Buy | 2025-07-25 |
| Stifel | Maintain | Buy | 2025-07-11 |
| Goldman Sachs | Maintain | Sell | 2025-07-08 |
| Stifel | Maintain | Buy | 2025-05-01 |
| Stifel | Maintain | Buy | 2025-02-27 |
| DA Davidson | Maintain | Buy | 2024-07-26 |
EMCOR Group generally holds a Buy consensus with some Neutral and one Sell rating, indicating moderate confidence with some caution from analysts.
Which company has the best grades?
Quanta Services, Inc. shows a stronger consensus with multiple Buy and Outperform ratings, while EMCOR Group, Inc. has mostly Buy ratings but includes a Neutral and a Sell, suggesting slightly higher analyst confidence in Quanta Services. This difference could influence investor sentiment regarding potential growth and risk profiles.
Strengths and Weaknesses
Below is a comparison table summarizing the key strengths and weaknesses of Quanta Services, Inc. (PWR) and EMCOR Group, Inc. (EME) based on their latest financial and operational data.
| Criterion | Quanta Services, Inc. (PWR) | EMCOR Group, Inc. (EME) |
|---|---|---|
| Diversification | Moderate: Focused on Electric Power and Renewable Energy Infrastructure with some Underground Utility solutions; growing renewables segment (7.8B in 2024) | High: Diverse across Electrical, Mechanical, Building, Industrial, and UK services; broad service offering in construction and facilities |
| Profitability | Moderate: ROIC 7.99% slightly below WACC 8.81%, net margin 3.82% (unfavorable), PE high at 51.3 indicating possible overvaluation | Strong: ROIC 26.38% well above WACC 9.2%, net margin 6.91%, ROE 34.3%, PE 21 neutral, demonstrating efficient capital use |
| Innovation | Neutral: Stable profitability but value-destroying overall; limited moat with neutral ROIC trend | Strong: Very favorable moat with growing ROIC and durable competitive advantage |
| Global presence | Primarily US-focused with no significant international revenue noted | US-dominant with some UK presence, showing geographic diversification |
| Market Share | Leading in Electric Power Infrastructure with 11.2B revenue in 2024; expanding renewables | Leading in Mechanical Construction (6.5B) and Electrical Services (3.4B), strong foothold in multiple segments |
Key takeaways: EMCOR displays superior profitability, diversification, and innovation with a strong moat and efficient capital use. Quanta shows solid revenue growth, especially in renewables, but struggles with value creation and higher valuation risks. Investors seeking growth with risk awareness might favor EMCOR’s balanced profile.
Risk Analysis
Below is a comparison of key risks for Quanta Services, Inc. (PWR) and EMCOR Group, Inc. (EME) based on the most recent 2024 data.
| Metric | Quanta Services, Inc. (PWR) | EMCOR Group, Inc. (EME) |
|---|---|---|
| Market Risk | Beta 1.156; moderate volatility | Beta 1.174; slightly higher volatility |
| Debt level | Debt-to-equity 0.61 (neutral); Debt-to-assets 24% (favorable) | Debt-to-equity 0.12 (favorable); Debt-to-assets 4.5% (favorable) |
| Regulatory Risk | Exposure in electric power and energy infrastructure | Exposure in electrical, mechanical, and facilities services |
| Operational Risk | Complex projects in transmission, renewable energy, and pipelines | Diverse services including mechanical, electrical, and facility management |
| Environmental Risk | Renewable energy focus mitigates but infrastructure work may face environmental scrutiny | Involvement in energy solutions and industrial services may pose environmental challenges |
| Geopolitical Risk | US-based with global operations, sensitive to energy policy changes | Primarily US and UK focused, exposure to geopolitical shifts in these regions |
Quanta Services faces moderate market risk with a higher debt ratio relative to EMCOR, but maintains strong operational capabilities in critical infrastructure. EMCOR benefits from lower leverage and very high interest coverage, reducing financial risk. The most impactful risks are regulatory changes affecting energy infrastructure for PWR and operational complexity alongside geopolitical exposure for EME. Both companies remain in a safe financial zone, but investors should monitor energy policy shifts and project execution risks closely.
Which Stock to Choose?
Quanta Services, Inc. (PWR) shows strong income growth with a 111% revenue increase over five years and mostly favorable profitability metrics. Its financial ratios are slightly favorable overall, reflecting moderate debt levels (net debt/EBITDA 1.73) and a solid current ratio of 1.3. The company’s rating is very favorable (B-), though valuation multiples appear high (P/E 51.3). The MOAT evaluation signals value destruction with ROIC below WACC, indicating challenges in creating economic profit.
EMCOR Group, Inc. (EME) exhibits robust income growth, including a 658% net income increase since 2020, with favorable profitability and financial ratios overall. It maintains low leverage (debt/assets 4.5%) and excellent coverage ratios, supported by a very favorable rating (B+). Valuation is more moderate (P/E 21.0), and the MOAT assessment is very favorable, showing a durable competitive advantage with ROIC well above WACC and strong growth in invested capital returns.
Investors focused on growth potential might find EMCOR’s superior income growth, profitability, and strong economic moat appealing, while those valuing moderate valuation and stable financials could interpret Quanta’s profile as slightly favorable despite its value destruction signals. The choice may depend on the investor’s risk tolerance and preference for economic moat durability versus recent growth dynamics.
Disclaimer: Investment carries a risk of loss of initial capital. The past performance is not a reliable indicator of future results. Be sure to understand risks before making an investment decision.
Go Further
I encourage you to read the complete analyses of Quanta Services, Inc. and EMCOR Group, Inc. to enhance your investment decisions: