Home > Comparison > Healthcare > LLY vs PFE
The strategic rivalry between Eli Lilly and Company and Pfizer Inc. shapes the healthcare sector’s evolution. Eli Lilly operates as a focused innovator in drug manufacturing with a strong pipeline in diabetes and oncology. Pfizer, by contrast, is a diversified pharmaceutical giant with broad biopharmaceutical offerings and vaccine leadership. This analysis pits specialization against scale to identify which model delivers superior risk-adjusted returns for a diversified portfolio in 2026.
Table of contents
Companies Overview
Eli Lilly and Company and Pfizer Inc. stand as titans in the global pharmaceutical landscape, shaping healthcare innovations.
Eli Lilly and Company: Global Pharma Innovator
Eli Lilly dominates as a drug manufacturer focused on human pharmaceuticals, especially diabetes and oncology. Its core revenue stems from insulin products and cancer therapies like Alimta and Cyramza. In 2026, the company emphasizes expanding its biologics pipeline and strategic collaborations, reinforcing its competitive pharma innovation.
Pfizer Inc.: Biopharma Powerhouse
Pfizer leads with a broad biopharmaceutical portfolio spanning vaccines, small molecules, and immunotherapies. It generates revenue through blockbuster brands like Comirnaty (COVID-19 vaccine) and Eliquis (cardiovascular). Pfizer’s 2026 strategy intensifies focus on vaccine leadership and expanding biosimilars, leveraging global manufacturing scale and partnerships.
Strategic Collision: Similarities & Divergences
Both firms prioritize innovation in specialty medicines but diverge in business models: Eli Lilly leans on a focused, proprietary drug portfolio, while Pfizer embraces a diverse, global product mix including vaccines. Their primary competition lies in specialty pharma and immunology markets. Investment profiles differ—Eli Lilly offers concentrated growth potential; Pfizer delivers broad exposure with scale-driven resilience.
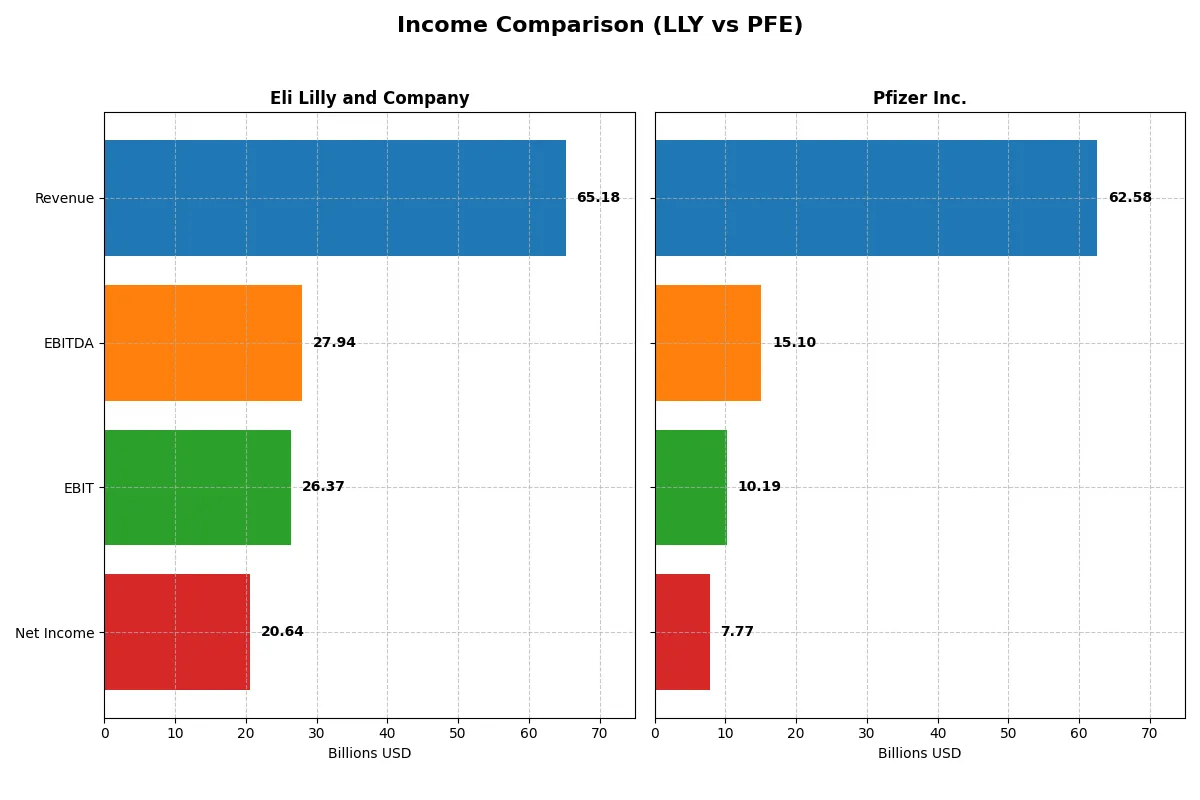
Income Statement Comparison
This data dissects the core profitability and scalability of both corporate engines to reveal who dominates the bottom line:
| Metric | Eli Lilly and Company (LLY) | Pfizer Inc. (PFE) |
|---|---|---|
| Revenue | 65.2B | 62.6B |
| Cost of Revenue | 10.6B | 18.6B |
| Operating Expenses | 24.9B | 28.6B |
| Gross Profit | 54.6B | 44.0B |
| EBITDA | 27.9B | 15.1B |
| EBIT | 26.4B | 10.2B |
| Interest Expense | 0.80B | 2.67B |
| Net Income | 20.6B | 7.75B |
| EPS | 23.00 | 1.36 |
| Fiscal Year | 2025 | 2025 |
Income Statement Analysis: The Bottom-Line Duel
This income statement comparison reveals the true efficiency and profitability trajectory of two pharmaceutical giants over recent years.
Eli Lilly and Company Analysis
Eli Lilly’s revenue surged from $28.3B in 2021 to $65.2B in 2025, more than doubling in four years. Net income exploded from $5.6B to $20.6B, reflecting a robust net margin of 31.7%. Gross margins remain stellar above 83%, and EBIT margins near 40.5% underline operational excellence. The 2025 figures highlight strong momentum, driven by disciplined cost control and impressive profitability growth.
Pfizer Inc. Analysis
Pfizer’s revenue peaked at $100.3B in 2022 but declined to $62.6B by 2025, marking a 23% drop over the period. Net income also fell sharply from $31.4B to $7.7B, yielding a modest 12.4% net margin in 2025. Gross margin at 70.3% and EBIT margin at 16.3% signal weaker profitability and operational leverage. The latest year shows contraction in revenue and earnings, indicating challenges in sustaining growth and efficiency.
Verdict: Margin Power vs. Revenue Scale
Eli Lilly outperforms Pfizer decisively in profitability growth and margin strength. Lilly’s income statement shows sustained revenue and earnings expansion with superior margins. Pfizer struggles with declining scale and compressed profitability. For investors, Eli Lilly’s profile offers a clearer path to value creation through operational efficiency and accelerating net income growth.
Financial Ratios Comparison
These vital ratios act as a diagnostic tool to expose underlying fiscal health, valuation premiums, and capital efficiency for clear comparative insights:
| Ratios | Eli Lilly and Company (LLY) | Pfizer Inc. (PFE) |
|---|---|---|
| ROE | 77.78% | 8.35% |
| ROIC | 30.20% | — |
| P/E | 46.76 | 18.21 |
| P/B | 36.37 | 1.52 |
| Current Ratio | 1.58 | 0 |
| Quick Ratio | 1.19 | 0 |
| D/E (Debt-to-Equity) | 1.60 | 0 |
| Debt-to-Assets | 37.79% | 0 |
| Interest Coverage | 37.34 | 5.78 |
| Asset Turnover | 0.58 | 0 |
| Fixed Asset Turnover | 2.64 | 0 |
| Payout Ratio | 26.09% | 125.80% |
| Dividend Yield | 0.56% | 6.91% |
| Fiscal Year | 2025 | 2025 |
Efficiency & Valuation Duel: The Vital Signs
Financial ratios act like a company’s DNA, uncovering hidden risks and signaling operational strength or weakness.
Eli Lilly and Company
Eli Lilly delivers impressive profitability with a 77.78% ROE and a strong 31.66% net margin, highlighting operational efficiency. However, its valuation appears stretched, with a high P/E of 46.76 and P/B of 36.37. Dividend yield is modest at 0.56%, suggesting a focus on reinvestment in R&D for growth.
Pfizer Inc.
Pfizer shows moderate profitability, with an 8.35% ROE and 12.42% net margin, indicating less operational efficiency than its peer. Its valuation is more reasonable, with a P/E of 18.21 and P/B at 1.52. Pfizer offers a solid 6.91% dividend yield, supporting shareholder returns through income rather than aggressive growth reinvestment.
Premium Valuation vs. Operational Safety
Eli Lilly commands a premium valuation backed by superior profitability but carries valuation risk. Pfizer offers a safer valuation and steady dividend income but lags in profitability. Growth-oriented investors may prefer Lilly’s profile, while income-focused investors might find Pfizer’s approach more suitable.
Which one offers the Superior Shareholder Reward?
I compare Eli Lilly and Pfizer’s distribution philosophies and shareholder rewards in 2026. Eli Lilly yields 0.56% with a moderate 26% payout ratio, comfortably covered by free cash flow at 53%. Its buybacks remain disciplined, supporting a sustainable capital return strategy. Pfizer offers a much higher dividend yield near 6.9% but with a payout ratio over 125%, signaling a riskier dividend sustainability. Pfizer’s buyback data is unavailable, suggesting less emphasis on share repurchases. Historically, Eli Lilly’s balanced dividend and buyback approach fosters long-term value. Pfizer’s high yield appeals to income seekers but poses cash flow risks. I conclude Eli Lilly offers superior total shareholder reward for prudent investors in 2026.
Comparative Score Analysis: The Strategic Profile
The radar chart reveals the fundamental DNA and trade-offs of both Eli Lilly and Pfizer, highlighting their strategic strengths and weaknesses across key financial metrics:
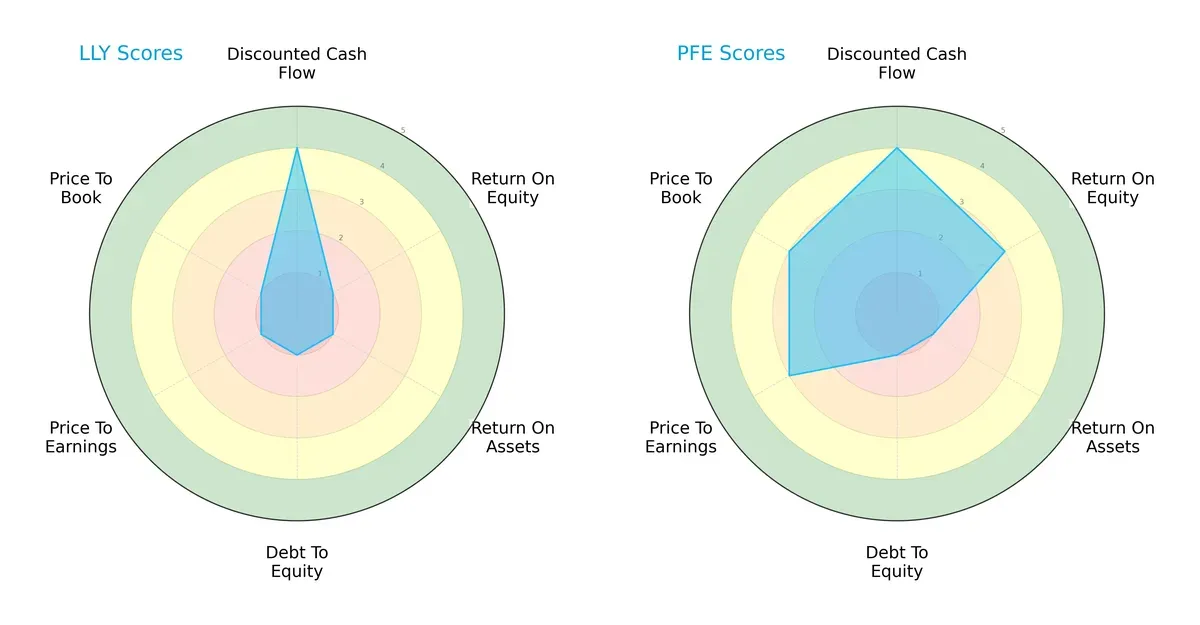
Eli Lilly shows a polarized profile with a strong discounted cash flow score (4) but very weak returns on equity (1) and assets (1), plus poor leverage and valuation metrics (all 1). Pfizer presents a more balanced profile, scoring moderately in return on equity (3), price-to-earnings (3), and price-to-book (3), while matching Lilly’s strength in discounted cash flow (4). Pfizer’s diversified strengths suggest a steadier foundation, whereas Lilly relies heavily on its cash flow advantage to offset other weaknesses.
Bankruptcy Risk: Solvency Showdown
Eli Lilly’s Altman Z-Score at 7.96 places it firmly in the safe zone, signaling robust financial stability and low bankruptcy risk in this cycle. Pfizer’s Altman Z-Score data is unavailable, limiting direct solvency comparison:

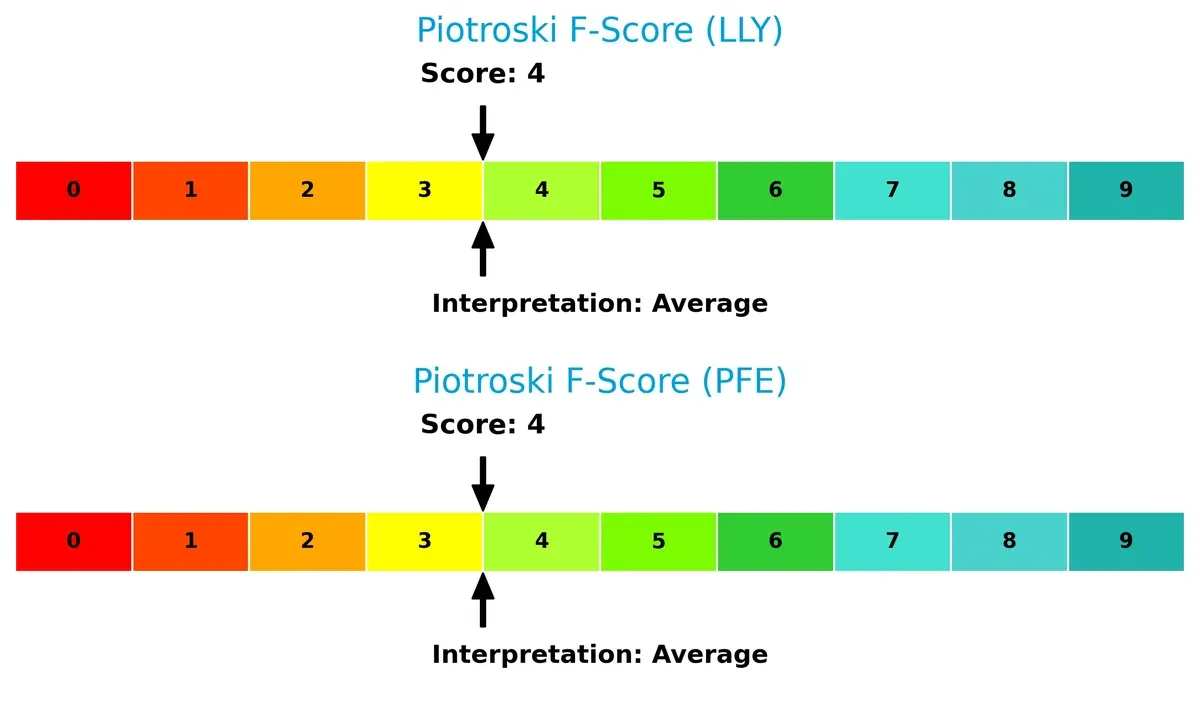
Financial Health: Quality of Operations
Both Eli Lilly and Pfizer score 4 on the Piotroski F-Score, indicating average financial health. Neither company shows peak operational quality nor significant red flags relative to each other:
How are the two companies positioned?
This section dissects Eli Lilly and Pfizer’s operational DNA by comparing their revenue distribution and internal dynamics. The goal is to confront their economic moats and identify which offers the most resilient competitive advantage today.
Revenue Segmentation: The Strategic Mix
This visual comparison dissects how Eli Lilly and Company and Pfizer Inc. diversify their income streams and reveals where their primary sector bets lie:
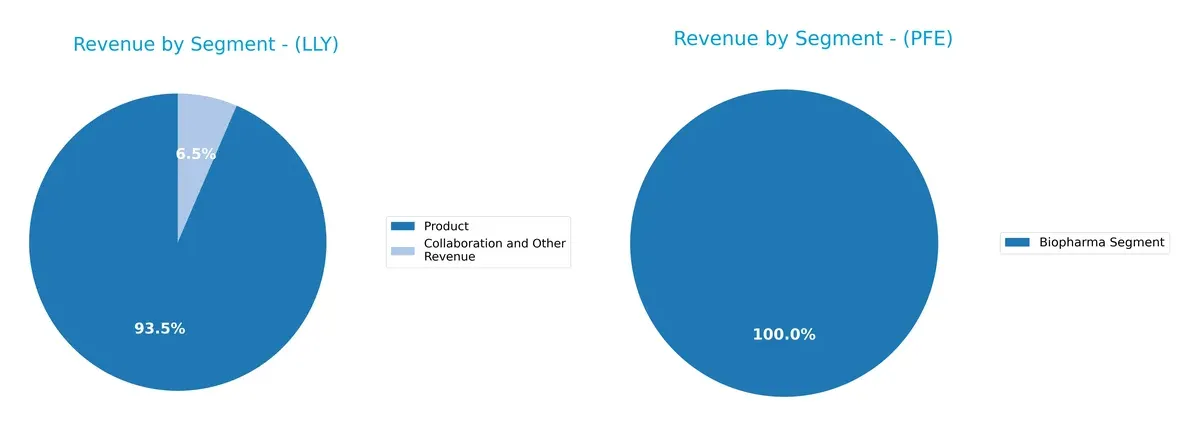
Eli Lilly anchors revenue heavily in Products at $61B (2025), with Collaboration and Other Revenue contributing $4.2B, showing moderate diversification. Pfizer pivots almost entirely on its Biopharma Segment, posting $62.4B in 2024, with minimal contribution from Business Innovation. Lilly’s broader mix reduces concentration risk, while Pfizer’s dependence on one dominant segment signals potential vulnerability to Biopharma market shifts.
Strengths and Weaknesses Comparison
This table compares the Strengths and Weaknesses of Eli Lilly and Company (LLY) and Pfizer Inc. (PFE):
LLY Strengths
- Strong profitability with 31.66% net margin and 77.78% ROE
- Favorable ROIC of 30.2% well above WACC
- Solid liquidity ratios (current 1.58, quick 1.19)
- Significant U.S. revenue base at $43.5B
- Diverse product portfolio with growing collaboration revenue at $4.2B
PFE Strengths
- Favorable net margin of 12.42% and WACC at 5.69%
- Large global presence including $38.7B U.S. and $25.7B outside U.S.
- Low debt to equity and debt to assets ratios marked favorable
- Diversified segments including Biopharma and Emerging Markets
- Moderate dividend yield of 6.91% provides income
LLY Weaknesses
- High valuation multiples (PE 46.76, PB 36.37) indicate premium pricing
- Elevated debt to equity ratio at 1.6
- Low dividend yield at 0.56%
- Asset turnover ratios neutral, indicating average asset efficiency
PFE Weaknesses
- Weak profitability metrics with ROE at 8.35% and ROIC at 0%
- Unfavorable liquidity ratios (current and quick at 0) raise solvency concerns
- Asset turnover ratios unfavorable, indicating efficiency issues
- Higher proportion of unfavorable ratios (42.86%) suggest financial stress
LLY’s strengths focus on superior profitability and liquidity, supporting its premium valuation despite some leverage concerns. PFE’s strengths lie in global diversification and lower leverage but are offset by weaker profitability and liquidity metrics, highlighting areas for operational improvement.
The Moat Duel: Analyzing Competitive Defensibility
A structural moat is the only reliable barrier protecting long-term profits from relentless competitive erosion. Let’s dissect the moats of two pharma giants:
Eli Lilly and Company: Innovation and High-Return Moat
Lilly’s moat rests on intangible assets fueled by innovation and a robust drug pipeline. It sustains a very favorable ROIC, exceeding WACC by 25%, showing efficient capital use and margin resilience. New diabetes and oncology products in 2026 promise to deepen this competitive edge.
Pfizer Inc.: Scale Without Sustainable Value Creation
Pfizer leverages scale and broad geographic reach but lacks a growing ROIC, which has declined sharply, indicating value destruction. Its moat is weaker and more cost-driven compared to Lilly’s innovation focus. Expansion hinges on pipeline breakthroughs, but current trends suggest vulnerability.
Innovation Excellence vs. Scale Efficiency
Lilly’s wider moat stems from its innovation-driven value creation and growing profitability. Pfizer’s scale fails to offset declining returns and margin pressure. Lilly is better positioned to defend market share through sustainable competitive advantages in 2026.
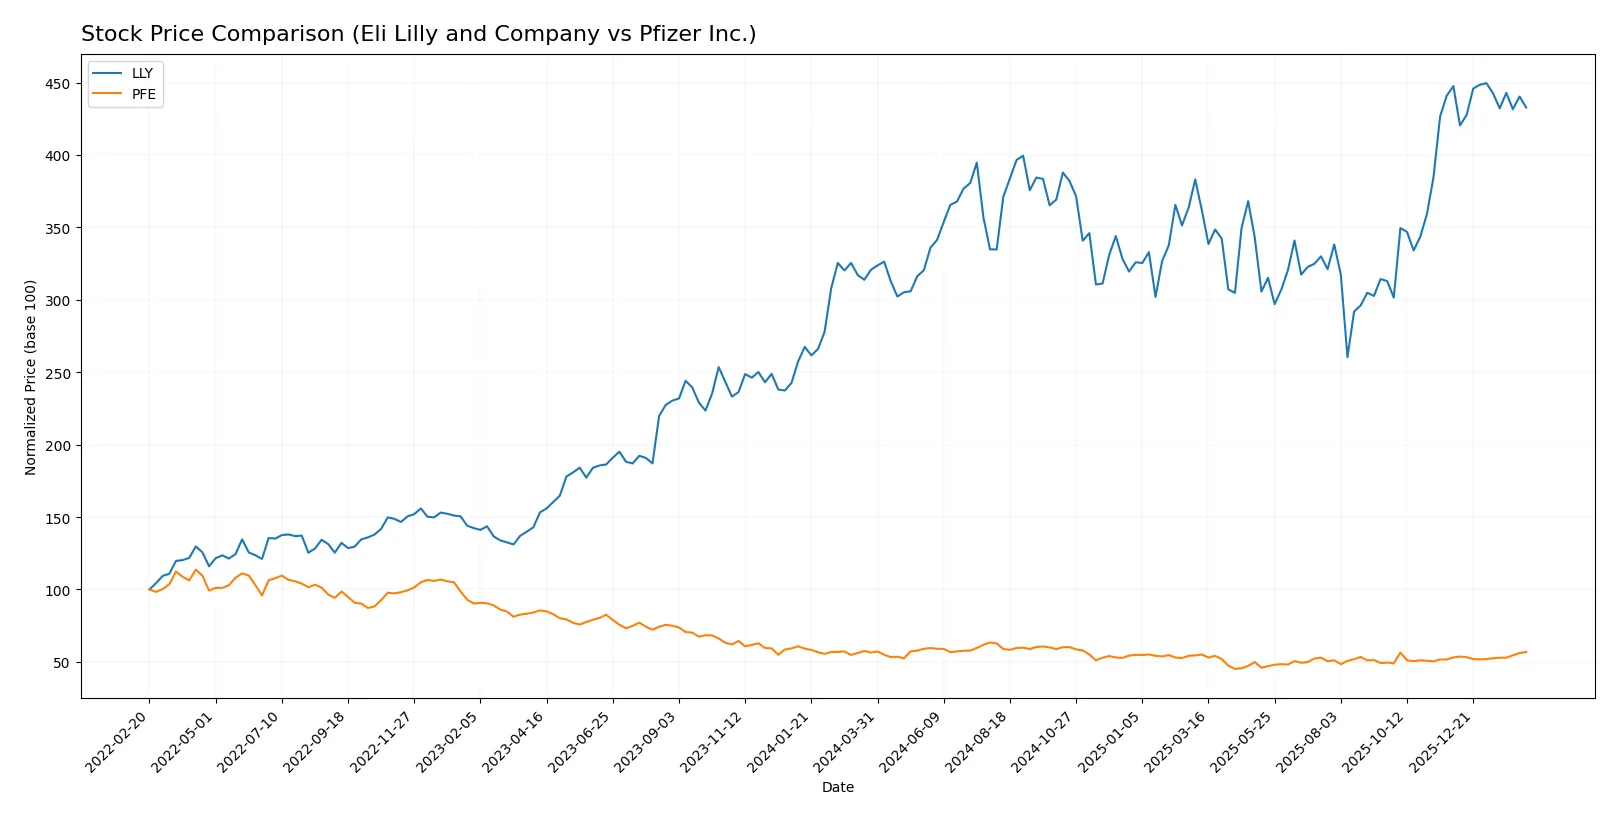
Which stock offers better returns?
The past year shows Eli Lilly’s shares surged sharply before recent mild decline, while Pfizer’s stock held steady with gradual gains and increasing buyer dominance.
Trend Comparison
Eli Lilly’s stock rose 34.96% over the past 12 months, showing a strong bullish trend with decelerating momentum and a high price range between 625.65 and 1080.36.
Pfizer’s stock gained 0.8% in the same period, reflecting a neutral trend overall but accelerating recently with a narrower price band from 21.91 to 30.77.
Eli Lilly delivered the highest market performance, outperforming Pfizer by a wide margin despite recent short-term weakness.
Target Prices
Analysts present a solid target price consensus for Eli Lilly and Pfizer, reflecting confidence in their growth potential.
| Company | Target Low | Target High | Consensus |
|---|---|---|---|
| Eli Lilly and Company | 830 | 1300 | 1203.56 |
| Pfizer Inc. | 24 | 35 | 27.89 |
Eli Lilly’s consensus target of 1203.56 exceeds its current price of 1040, signaling upside potential. Pfizer’s target consensus of 27.89 is slightly above its current price of 27.58, indicating modest expected gains.

Don’t Let Luck Decide Your Entry Point
Optimize your entry points with our advanced ProRealTime indicators. You’ll get efficient buy signals with precise price targets for maximum performance. Start outperforming now!
How do institutions grade them?
The following tables summarize recent institutional grades for Eli Lilly and Company and Pfizer Inc.:
Eli Lilly and Company Grades
These grades reflect consistent positive recommendations from major institutions.
| Grading Company | Action | New Grade | Date |
|---|---|---|---|
| Deutsche Bank | Maintain | Buy | 2026-02-09 |
| Morgan Stanley | Maintain | Overweight | 2026-02-05 |
| JP Morgan | Maintain | Overweight | 2026-02-05 |
| Cantor Fitzgerald | Maintain | Overweight | 2026-02-05 |
| Wells Fargo | Maintain | Overweight | 2026-02-05 |
| Guggenheim | Maintain | Buy | 2026-01-20 |
| B of A Securities | Maintain | Buy | 2025-12-15 |
| Wells Fargo | Maintain | Overweight | 2025-12-10 |
| BMO Capital | Maintain | Outperform | 2025-12-04 |
| Guggenheim | Maintain | Buy | 2025-12-03 |
Pfizer Inc. Grades
These grades indicate mostly neutral to moderate positive sentiment from institutions.
| Grading Company | Action | New Grade | Date |
|---|---|---|---|
| Cantor Fitzgerald | Maintain | Neutral | 2026-02-04 |
| Cantor Fitzgerald | Maintain | Neutral | 2026-01-27 |
| Morgan Stanley | Maintain | Equal Weight | 2025-12-17 |
| B of A Securities | Maintain | Neutral | 2025-12-15 |
| Morgan Stanley | Maintain | Equal Weight | 2025-12-12 |
| Guggenheim | Maintain | Buy | 2025-11-24 |
| Morgan Stanley | Maintain | Equal Weight | 2025-10-10 |
| B of A Securities | Maintain | Neutral | 2025-10-03 |
| B of A Securities | Maintain | Neutral | 2025-08-06 |
| Citigroup | Maintain | Neutral | 2025-08-06 |
Which company has the best grades?
Eli Lilly consistently receives stronger grades, mostly Buy and Overweight ratings. Pfizer shows predominantly Neutral and Equal Weight assessments. This suggests higher institutional confidence in Eli Lilly’s near-term prospects, potentially influencing investor sentiment and capital flows.
Risks specific to each company
The following categories identify the critical pressure points and systemic threats facing both firms in the 2026 market environment:
1. Market & Competition
Eli Lilly and Company
- Dominates with strong product pipeline and high ROIC (30.2%). Faces premium valuation risk (PE 46.76).
Pfizer Inc.
- Faces intense competition and lower profitability (ROIC 0%). Trades at more moderate valuation (PE 18.21).
2. Capital Structure & Debt
Eli Lilly and Company
- Moderate leverage (Debt/Equity 1.6) with excellent interest coverage (33.16x).
Pfizer Inc.
- Very low debt levels, strong balance sheet but liquidity ratios unavailable.
3. Stock Volatility
Eli Lilly and Company
- Low beta (0.394) signals defensive stock with stable price action.
Pfizer Inc.
- Low beta (0.441) but much higher trading volume suggests more market noise.
4. Regulatory & Legal
Eli Lilly and Company
- Exposed to drug approval risks but benefits from diversified oncology and diabetes portfolio.
Pfizer Inc.
- Broad vaccine and therapeutics exposure; regulatory scrutiny heightened post-COVID.
5. Supply Chain & Operations
Eli Lilly and Company
- Operations supported by global collaborations; asset turnover neutral (0.58).
Pfizer Inc.
- Supply chain risks elevated; key ratios unavailable, indicating opacity in operational efficiency.
6. ESG & Climate Transition
Eli Lilly and Company
- Active in sustainable pharma initiatives but ESG scores not provided.
Pfizer Inc.
- ESG risks unclear; must manage climate transition given large operational footprint.
7. Geopolitical Exposure
Eli Lilly and Company
- Global footprint exposes it to international trade and regulatory shifts.
Pfizer Inc.
- Extensive global presence heightens risk from geopolitical tensions and trade policies.
Which company shows a better risk-adjusted profile?
Eli Lilly’s most impactful risk is its high valuation, which could pressure returns if growth slows. Pfizer faces fundamental profitability and operational transparency challenges. Despite Pfizer’s lower leverage, Eli Lilly’s superior profitability and stable financial health deliver a better risk-adjusted profile. Eli Lilly’s Altman Z-Score of 7.96 confirms strong financial safety, while Pfizer’s lack of this data clouds risk assessment.
Final Verdict: Which stock to choose?
Eli Lilly’s superpower lies in its formidable return on invested capital, which outpaces its cost of capital by a wide margin, signaling a durable competitive advantage. Its rapid earnings growth and strong margin expansion position it as a cash-generating powerhouse. The key point of vigilance is its high valuation multiples, which could pressure future returns. It fits best in an Aggressive Growth portfolio seeking innovation-driven leadership.
Pfizer offers a strategic moat built on its diversified portfolio and steady cash flow from established products. While its profitability metrics trail Eli Lilly’s, Pfizer presents a more conservative risk profile with a lower valuation and consistent dividend yield. This makes it suitable for a GARP (Growth at a Reasonable Price) investor aiming for income plus moderate growth stability.
If you prioritize robust capital efficiency and high growth, Eli Lilly outshines due to its sustainable value creation and earnings momentum. However, if you seek better stability and income with reasonable valuation, Pfizer offers a steadier investment backdrop. Both scenarios require careful risk assessment given sector cyclicality and valuation dynamics.
Disclaimer: Investment carries a risk of loss of initial capital. The past performance is not a reliable indicator of future results. Be sure to understand risks before making an investment decision.
Go Further
I encourage you to read the complete analyses of Eli Lilly and Company and Pfizer Inc. to enhance your investment decisions: