In the competitive pharmaceutical landscape, Eli Lilly and Company (LLY) and Merck & Co., Inc. (MRK) stand out as industry leaders with significant market presence and robust innovation strategies. Both companies specialize in drug manufacturing but differentiate through diverse portfolios and cutting-edge research collaborations. This analysis will explore their strengths and risks to help you decide which stock might be the most promising addition to your investment portfolio.
Table of contents
Companies Overview
I will begin the comparison between Eli Lilly and Company and Merck & Co., Inc. by providing an overview of these two companies and their main differences.
Eli Lilly and Company Overview
Eli Lilly and Company is a global pharmaceutical firm focused on discovering, developing, and marketing human pharmaceuticals. Its portfolio includes treatments for diabetes, cancer, autoimmune diseases, and mental health disorders. Founded in 1876 and headquartered in Indianapolis, Lilly operates in the healthcare sector with a market capitalization near 955B USD and employs approximately 47,000 people worldwide.
Merck & Co., Inc. Overview
Merck & Co., Inc. is a diversified healthcare company operating globally through pharmaceutical and animal health segments. It offers human pharmaceuticals across oncology, immunology, neuroscience, and vaccines, alongside veterinary products. Founded in 1891 and based in Kenilworth, New Jersey, Merck holds a market cap of about 278B USD and has a workforce of roughly 73,000 employees.
Key similarities and differences
Both Eli Lilly and Merck are major players in the drug manufacturing industry with a broad focus on pharmaceuticals. Lilly emphasizes human pharmaceuticals with a strong diabetes and oncology portfolio, while Merck diversifies further into animal health products. Market capitalization and employee count differ significantly, with Lilly being substantially larger. Each company maintains global collaborations but targets somewhat distinct therapeutic areas and customer segments.
Income Statement Comparison
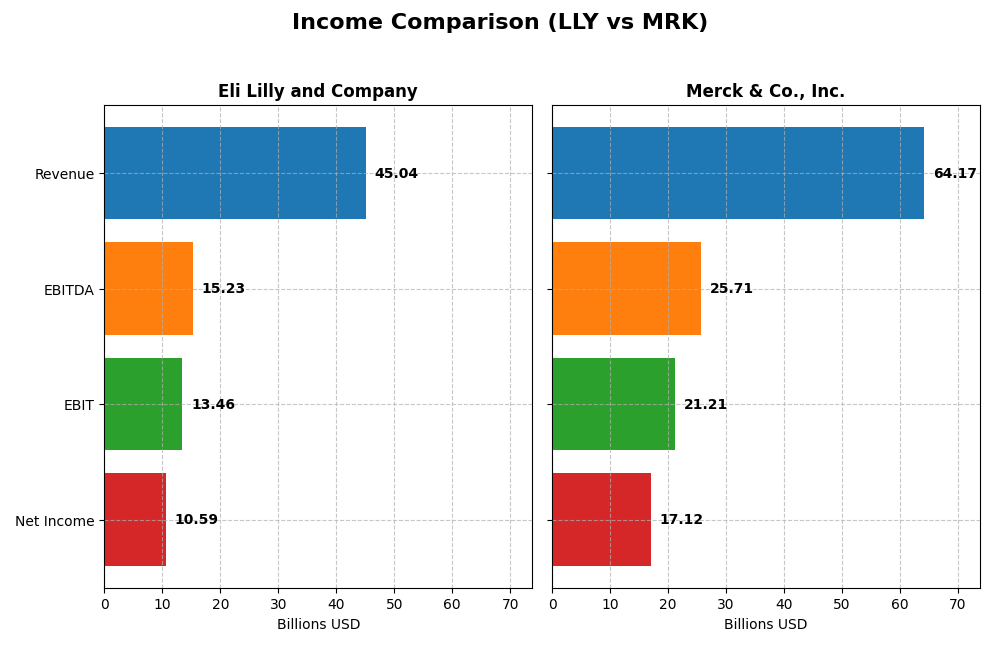
Below is a comparison of key income statement metrics for Eli Lilly and Company (LLY) and Merck & Co., Inc. (MRK) for the fiscal year 2024.
| Metric | Eli Lilly and Company (LLY) | Merck & Co., Inc. (MRK) |
|---|---|---|
| Market Cap | 955.4B | 277.8B |
| Revenue | 45.0B | 64.2B |
| EBITDA | 15.2B | 25.7B |
| EBIT | 13.5B | 21.2B |
| Net Income | 10.6B | 17.1B |
| EPS | 11.76 | 6.76 |
| Fiscal Year | 2024 | 2024 |
Income Statement Interpretations
Eli Lilly and Company
Eli Lilly’s revenue and net income have shown strong growth from 2020 to 2024, with revenue increasing by 83.55% and net income by 70.98%. Despite a slight decline in net margin by 6.85% over the period, gross and EBIT margins remained favorable, with 81.31% and 29.88%, respectively. The 2024 year saw a significant 32% revenue growth and over 53% net margin improvement, indicating robust operational performance.
Merck & Co., Inc.
Merck experienced steady revenue growth of 54.55% and an even more impressive net income increase of 142.21% from 2020 to 2024. The company maintained favorable gross (76.32%) and EBIT (33.05%) margins, with net margin at 26.68% in 2024. Although revenue growth in 2024 was moderate at 6.74%, net margin and EPS surged dramatically, reflecting strong profitability improvements and efficient cost management.
Which one has the stronger fundamentals?
Both Eli Lilly and Merck present favorable income statement fundamentals with high percentages of positive metrics. Eli Lilly shows faster revenue growth and strong margin stability, while Merck boasts superior net margin growth and a remarkable net income increase over the period. Merck’s larger margin improvement and net income acceleration give it a slight edge in fundamental strength based solely on the income statement data.
Financial Ratios Comparison
Below is a comparison of key financial ratios for Eli Lilly and Company (LLY) and Merck & Co., Inc. (MRK) for the fiscal year 2024.
| Ratios | Eli Lilly and Company (LLY) | Merck & Co., Inc. (MRK) |
|---|---|---|
| ROE | 74.6% | 37.0% |
| ROIC | 26.4% | 19.0% |
| P/E | 65.7 | 14.7 |
| P/B | 49.0 | 5.44 |
| Current Ratio | 1.15 | 1.36 |
| Quick Ratio | 0.89 | 1.15 |
| D/E (Debt-to-Equity) | 2.37 | 0.83 |
| Debt-to-Assets | 42.7% | 32.7% |
| Interest Coverage | 22.4 | 15.9 |
| Asset Turnover | 0.57 | 0.55 |
| Fixed Asset Turnover | 2.63 | 2.70 |
| Payout ratio | 44.2% | 45.8% |
| Dividend yield | 0.67% | 3.11% |
Interpretation of the Ratios
Eli Lilly and Company
Eli Lilly shows strong profitability with favorable net margin (23.51%), ROE (74.62%), and ROIC (26.36%), but valuation ratios like PE (65.65) and PB (48.99) are unfavorable. Its liquidity ratios are neutral, while debt levels are somewhat high (DE 2.37). The dividend yield is low at 0.67%, indicating modest shareholder returns supported by dividends and buybacks, but payout sustainability may be a concern.
Merck & Co., Inc.
Merck displays robust profitability with favorable net margin (26.68%), ROE (36.96%), and ROIC (18.97%), accompanied by attractive valuation metrics such as PE (14.72). Liquidity is solid with a current ratio of 1.36 and quick ratio of 1.15. The dividend yield is attractive at 3.11%, supported by steady payouts and manageable debt, reflecting a balanced approach to shareholder returns.
Which one has the best ratios?
Merck’s ratios are overall more favorable, with 57.14% of its metrics positive and fewer unfavorable ratios compared to Eli Lilly’s 35.71% favorable and higher valuation concerns. Merck also maintains stronger liquidity and a higher dividend yield, making its financial profile comparatively more balanced than Eli Lilly’s slightly favorable but more stretched valuation and leverage ratios.
Strategic Positioning
This section compares the strategic positioning of Eli Lilly and Company (LLY) and Merck & Co., Inc. (MRK) on Market position, Key segments, and Exposure to technological disruption:
Eli Lilly and Company
- Leading pharmaceutical manufacturer with a large market cap of 955B USD, facing typical industry pressures.
- Focused on human pharmaceuticals with key segments in diabetes, oncology, immunology, and collaborations.
- Exposure to technological disruption through collaborations with biotech firms and development in innovative treatments.
Merck & Co., Inc.
- Significant healthcare player with 278B USD market cap, contending with competitive pressures in pharma.
- Operates two main segments: Pharmaceuticals and Animal Health, with diversified healthcare product lines.
- Engages in partnerships for long-acting HIV treatments, reflecting adaptation to biopharmaceutical innovations.
Eli Lilly and Company vs Merck & Co., Inc. Positioning
LLY maintains a concentrated focus on human pharmaceuticals with extensive diabetes and oncology portfolios, while MRK operates a more diversified business including animal health. LLY’s collaborations emphasize innovation in human treatments; MRK balances pharmaceutical innovations with animal health solutions.
Which has the best competitive advantage?
Both companies show very favorable MOAT evaluations with growing ROIC trends. LLY’s higher market cap and focused innovation suggest a durable competitive advantage, while MRK’s diversification also supports sustained profitability.
Stock Comparison
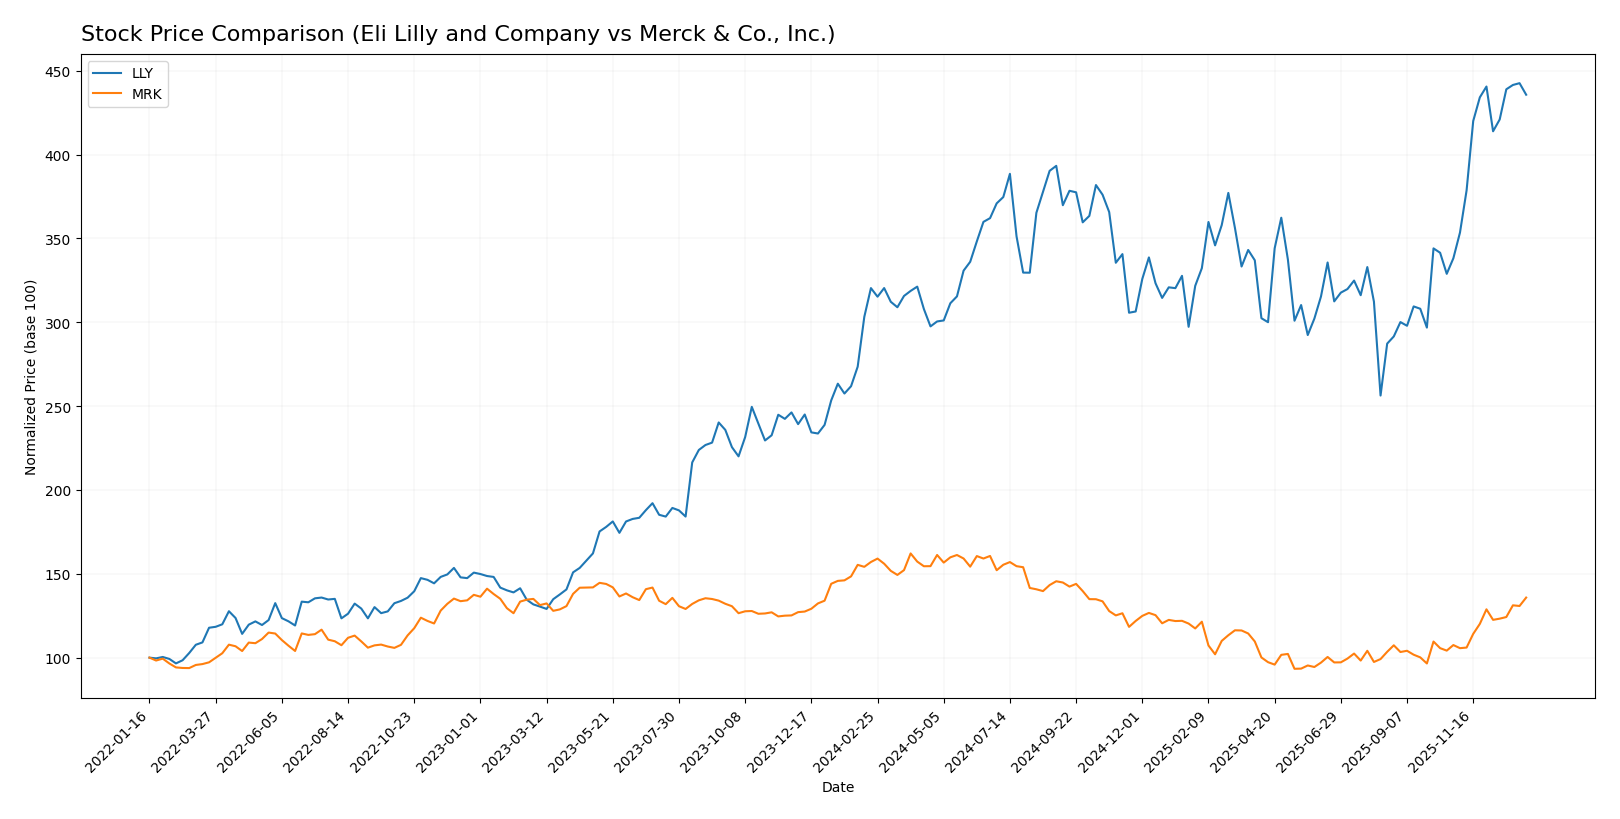
The stock price trends of Eli Lilly and Company (LLY) and Merck & Co., Inc. (MRK) over the past 12 months reveal contrasting dynamics, with LLY showing strong bullish momentum and MRK exhibiting a bearish overall trend despite recent gains.
Trend Analysis
Eli Lilly and Company’s stock rose 35.99% over the past year, indicating a bullish trend with acceleration and high volatility, reaching a peak price of 1080.36 and a low of 625.65.
Merck & Co., Inc.’s stock declined by 13.51% over the same period, marking a bearish trend with acceleration but lower volatility; its price ranged between 75.97 and 131.95.
Comparing the two, Eli Lilly delivered the highest market performance with a strong positive price change, while Merck experienced an overall decline despite recent upward momentum.
Target Prices
The consensus target prices for Eli Lilly and Company and Merck & Co., Inc. suggest moderate upside potential.
| Company | Target High | Target Low | Consensus |
|---|---|---|---|
| Eli Lilly and Company | 1300 | 830 | 1151.07 |
| Merck & Co., Inc. | 135 | 90 | 118.78 |
Eli Lilly’s consensus target price of 1151.07 USD is above its current price of 1063.56 USD, indicating expected growth. Merck’s consensus target of 118.78 USD also exceeds its current price of 110.53 USD, reflecting analyst optimism.
Analyst Opinions Comparison
This section compares analysts’ ratings and financial scores for Eli Lilly and Company (LLY) and Merck & Co., Inc. (MRK):
Rating Comparison
LLY Rating
- Rating: B+, considered very favorable by analysts.
- Discounted Cash Flow Score: 4, indicating a favorable valuation outlook.
- ROE Score: 5, showing very favorable efficiency in generating shareholder profit.
- ROA Score: 5, reflecting very favorable asset utilization.
- Debt To Equity Score: 1, indicating a very unfavorable financial risk profile.
- Overall Score: 3, classified as moderate overall financial health.
MRK Rating
- Rating: A-, also considered very favorable by analysts.
- Discounted Cash Flow Score: 5, suggesting a very favorable valuation outlook.
- ROE Score: 5, equally very favorable in generating shareholder profit.
- ROA Score: 5, equally very favorable asset utilization.
- Debt To Equity Score: 1, also indicating a very unfavorable financial risk profile.
- Overall Score: 4, indicating a favorable overall financial health.
Which one is the best rated?
Based strictly on provided data, MRK holds a superior overall rating (A- vs B+) and a higher overall score (4 vs 3) compared to LLY. Both share the same highest scores in ROE and ROA, but MRK’s discounted cash flow score and overall financial health are rated more favorably.
Scores Comparison
Here is a comparison of the Altman Z-Score and Piotroski Score for Eli Lilly and Company (LLY) and Merck & Co., Inc. (MRK):
LLY Scores
- Altman Z-Score: 8.08, indicating a safe zone.
- Piotroski Score: 7, classified as strong.
MRK Scores
- Altman Z-Score: 4.52, indicating a safe zone.
- Piotroski Score: 6, classified as average.
Which company has the best scores?
LLY has higher scores with an Altman Z-Score of 8.08 and Piotroski Score of 7, compared to MRK’s 4.52 and 6 respectively. Both are in the safe zone, but LLY’s financial strength measures are stronger.
Grades Comparison
Here is a comparison of recent grades and ratings from reputable grading companies for the two pharmaceutical companies:
Eli Lilly and Company Grades
The following table summarizes recent grades from major financial institutions for Eli Lilly and Company:
| Grading Company | Action | New Grade | Date |
|---|---|---|---|
| B of A Securities | Maintain | Buy | 2025-12-15 |
| Wells Fargo | Maintain | Overweight | 2025-12-10 |
| BMO Capital | Maintain | Outperform | 2025-12-04 |
| Guggenheim | Maintain | Buy | 2025-12-03 |
| Morgan Stanley | Maintain | Overweight | 2025-11-24 |
| Bernstein | Maintain | Outperform | 2025-11-24 |
| Truist Securities | Maintain | Buy | 2025-11-19 |
| JP Morgan | Maintain | Overweight | 2025-11-18 |
| Morgan Stanley | Maintain | Overweight | 2025-11-13 |
| Citigroup | Maintain | Buy | 2025-11-12 |
Eli Lilly’s grades predominantly indicate strong buy-side sentiment with consistent maintenance of Buy, Overweight, and Outperform ratings across multiple reputable institutions.
Merck & Co., Inc. Grades
The table below presents the latest grades from established grading companies for Merck & Co., Inc.:
| Grading Company | Action | New Grade | Date |
|---|---|---|---|
| Wolfe Research | Upgrade | Outperform | 2026-01-08 |
| Citigroup | Maintain | Neutral | 2026-01-07 |
| UBS | Maintain | Buy | 2026-01-07 |
| BMO Capital | Upgrade | Outperform | 2025-12-18 |
| B of A Securities | Maintain | Buy | 2025-12-15 |
| Morgan Stanley | Maintain | Equal Weight | 2025-12-12 |
| Scotiabank | Maintain | Sector Outperform | 2025-12-04 |
| Goldman Sachs | Maintain | Buy | 2025-12-02 |
| Wells Fargo | Upgrade | Overweight | 2025-11-24 |
| Deutsche Bank | Maintain | Hold | 2025-11-18 |
Merck’s grades show a mixture of Buy, Outperform, and Neutral ratings, with several recent upgrades, indicating improving analyst sentiment but some variability in outlook.
Which company has the best grades?
Eli Lilly has received a more consistent and stronger set of grades, predominantly Buy and Outperform, while Merck’s ratings include more Neutral and Hold grades alongside upgrades. For investors, Eli Lilly’s steadier positive consensus may imply greater confidence among analysts compared to Merck’s more mixed outlook.
Strengths and Weaknesses
Below is a comparative overview of Eli Lilly and Company (LLY) and Merck & Co., Inc. (MRK) based on key financial and strategic criteria as of 2024.
| Criterion | Eli Lilly and Company (LLY) | Merck & Co., Inc. (MRK) |
|---|---|---|
| Diversification | Strong pharmaceutical focus with growing collaboration revenue; limited product segments but expanding | Diversified across pharmaceutical, animal health, and other segments, with substantial pharma dominance |
| Profitability | High net margin (23.5%) and ROIC (26.4%), but high PE and PB ratios suggest premium valuation | Solid net margin (26.7%), ROIC (19.0%), and attractive PE ratio indicating reasonable valuation |
| Innovation | Demonstrates durable competitive advantage with very favorable moat and growing ROIC trend | Also has a very favorable moat with strong ROIC growth, supporting innovation and profitability |
| Global presence | Significant global sales mainly in pharmaceuticals, steady revenue growth | Extensive global reach with diverse product lines and consistent revenue growth in pharma and animal health |
| Market Share | Leading positions in key therapeutic areas but more focused | Large market share in pharmaceuticals with diversified segments enhancing resilience |
Key takeaways: Eli Lilly shows exceptional profitability and a durable competitive moat, though valuation metrics are stretched. Merck offers a more diversified portfolio with strong profitability and a favorable valuation, making it a balanced choice for investors seeking growth with moderate risk.
Risk Analysis
Below is a comparative overview of key risks for Eli Lilly and Company (LLY) and Merck & Co., Inc. (MRK) based on the latest data from 2024:
| Metric | Eli Lilly and Company (LLY) | Merck & Co., Inc. (MRK) |
|---|---|---|
| Market Risk | Low beta (0.35) indicates lower volatility versus market | Low beta (0.30) indicates low market volatility |
| Debt Level | High debt-to-equity (2.37) and moderate debt to assets (42.7%) | Moderate debt-to-equity (0.83) and debt to assets (32.7%) |
| Regulatory Risk | High exposure to drug approval and patent expiration risks | Similar regulatory exposure in pharma and vaccine sectors |
| Operational Risk | Large workforce (47K) and complex product portfolio | Larger workforce (73K) and diversified pharma and animal health segments |
| Environmental Risk | Standard pharma sector risks, limited public data on ESG | Same sector-related environmental risks, ongoing sustainability efforts |
| Geopolitical Risk | Global operations with exposure to trade policies and supply chains | Global reach with similar geopolitical exposure |
Eli Lilly’s most impactful risk is its elevated debt level, which may constrain financial flexibility despite strong profitability. Merck benefits from a more balanced debt profile and a favorable valuation but faces typical pharmaceutical regulatory risks. Both companies remain in the safe zone for bankruptcy risk, yet investors should monitor debt management and regulatory changes closely.
Which Stock to Choose?
Eli Lilly and Company (LLY) shows strong income growth with a 32% revenue increase in 2024 and favorable profitability metrics, including a 74.6% ROE and 26.4% ROIC, despite carrying a relatively high debt level and mixed financial ratios. The company holds a very favorable B+ rating supported by a very favorable moat and solid Altman Z-Score indicating financial safety.
Merck & Co., Inc. (MRK) presents steady income growth with a 6.7% revenue increase in 2024 and favorable profitability ratios such as a 37.0% ROE and 19.0% ROIC, coupled with lower debt levels and a generally favorable financial profile. MRK holds a very favorable A- rating, supported by a very favorable moat and a safe-zone Altman Z-Score, though some ratios show moderate concerns.
For investors, the choice might depend on their profile: those seeking higher growth and strong profitability metrics may find Eli Lilly’s performance and durable competitive advantage appealing, while those valuing financial stability and a more balanced risk profile could see Merck as potentially more favorable given its lower debt and favorable ratings.
Disclaimer: Investment carries a risk of loss of initial capital. The past performance is not a reliable indicator of future results. Be sure to understand risks before making an investment decision.
Go Further
I encourage you to read the complete analyses of Eli Lilly and Company and Merck & Co., Inc. to enhance your investment decisions: