Home > Comparison > Healthcare > LLY vs JNJ
The strategic rivalry between Eli Lilly and Company and Johnson & Johnson defines the current trajectory of the healthcare sector. Eli Lilly operates as a focused pharmaceutical innovator specializing in complex drug development. Johnson & Johnson combines innovative medicine with advanced medical devices, offering a diversified healthcare model. This analysis will assess which company’s distinct corporate trajectory delivers superior risk-adjusted returns for a well-diversified portfolio amid evolving sector dynamics.
Table of contents
Companies Overview
Eli Lilly and Johnson & Johnson stand as titans in healthcare innovation and market influence.
Eli Lilly and Company: Specialty Pharmaceutical Innovator
Eli Lilly dominates the drug manufacturers sector with a focus on human pharmaceuticals. Its core revenue stems from diabetes and oncology products like Humalog, Jardiance, and Alimta. In 2026, the company sharpens its strategic focus on developing targeted therapies and expanding collaborations with biotech firms to sustain its competitive edge.
Johnson & Johnson: Diversified Healthcare Powerhouse
Johnson & Johnson leads with a diversified healthcare model, combining innovative medicines and medical devices. Its core revenue engines include prescription drugs for complex diseases and advanced MedTech solutions such as orthopaedics and ACUVUE lenses. Post-2023, the company concentrates on high-growth innovation by divesting consumer health brands to Kenvue.
Strategic Collision: Similarities & Divergences
Both companies pursue innovation-driven growth but differ fundamentally; Lilly focuses on a specialized pharmaceutical portfolio, while Johnson & Johnson embraces a broader healthcare platform including MedTech. Their primary battleground lies in the oncology and immunology markets. Investors face distinct profiles: Lilly offers a concentrated play on specialty drugs, whereas Johnson & Johnson provides diversified exposure across healthcare segments.
Income Statement Comparison
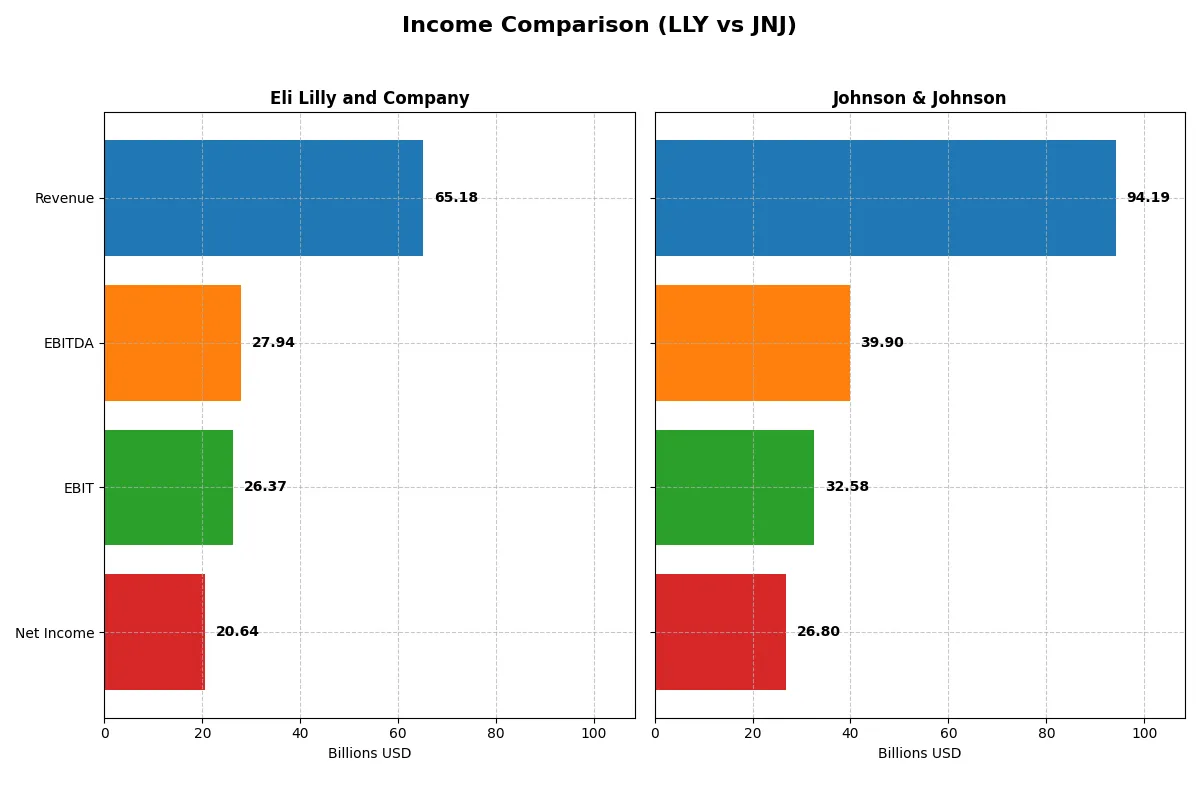
This data dissects the core profitability and scalability of both corporate engines to reveal who dominates the bottom line for 2025:
| Metric | Eli Lilly and Company (LLY) | Johnson & Johnson (JNJ) |
|---|---|---|
| Revenue | 65.2B | 94.2B |
| Cost of Revenue | 10.6B | 25.6B |
| Operating Expenses | 24.9B | 42.9B |
| Gross Profit | 54.6B | 68.6B |
| EBITDA | 27.9B | 39.9B |
| EBIT | 26.4B | 32.6B |
| Interest Expense | 0.8B | 1.0B |
| Net Income | 20.6B | 26.8B |
| EPS | 23.00 | 11.03 |
| Fiscal Year | 2025 | 2025 |
Income Statement Analysis: The Bottom-Line Duel
This income statement comparison will uncover which company operates with greater efficiency and generates superior profitability from its revenues.
Eli Lilly and Company Analysis
Eli Lilly’s revenue surged from 28.3B in 2021 to 65.2B in 2025, more than doubling over five years. Net income followed suit, tripling to 20.6B in 2025. Gross margins remain robust at 83.8%, and net margins reached 31.7%, highlighting exceptional cost control. The 2025 figures reveal powerful momentum, with nearly 45% revenue growth year-over-year and a striking 96% EBIT increase.
Johnson & Johnson Analysis
Johnson & Johnson posted steady revenue growth, rising from 78.7B in 2021 to 94.2B in 2025, a 20% increase over five years. Net income grew modestly to 26.8B in 2025, with net margins at 28.5%. Gross margin stands at 72.8%. Despite slower top-line expansion, J&J improved EBIT by nearly 87% year-over-year in 2025, reflecting operational leverage. However, revenue growth in 2025 was a modest 6%, indicating less aggressive scale gains.
Momentum Surge vs. Steady Scale
Eli Lilly outpaces Johnson & Johnson with superior revenue and net income growth, paired with higher gross and net margins. Lilly’s nearly 45% annual revenue jump and 32% net margin demonstrate a more dynamic, efficient earnings engine. Johnson & Johnson’s profile favors stable scale and solid profitability but lacks Lilly’s explosive momentum. Investors favoring rapid growth and margin expansion will find Lilly’s profile more compelling.
Financial Ratios Comparison
These vital ratios act as a diagnostic tool to expose the underlying fiscal health, valuation premiums, and capital efficiency of the companies compared below:
| Ratios | Eli Lilly and Company (LLY) | Johnson & Johnson (JNJ) |
|---|---|---|
| ROE | 77.78% | 32.87% |
| ROIC | 30.20% | 13.71% |
| P/E | 46.76 | 18.81 |
| P/B | 36.37 | 6.18 |
| Current Ratio | 1.58 | 1.03 |
| Quick Ratio | 1.19 | 0.77 |
| D/E (Debt-to-Equity) | 1.60 | 0.59 |
| Debt-to-Assets | 37.79% | 24.06% |
| Interest Coverage | 37.34 | 26.36 |
| Asset Turnover | 0.58 | 0.47 |
| Fixed Asset Turnover | 2.64 | 4.07 |
| Payout ratio | 26.09% | 46.19% |
| Dividend yield | 0.56% | 2.46% |
| Fiscal Year | 2025 | 2025 |
Efficiency & Valuation Duel: The Vital Signs
Financial ratios act as the company’s DNA, exposing hidden risks and operational strengths crucial for investment decisions.
Eli Lilly and Company
Eli Lilly displays superior profitability with a 77.78% ROE and 31.66% net margin, signaling operational excellence. However, its valuation appears stretched with a high P/E of 46.76 and PB of 36.37. The company offers a modest 0.56% dividend yield, suggesting most capital reinvests in growth and R&D.
Johnson & Johnson
Johnson & Johnson posts a solid 32.87% ROE and a healthy 28.46% net margin, reflecting efficient asset use. Its valuation is more reasonable, with a P/E of 18.81 and PB of 6.18, though quick ratio signals liquidity caution. A 2.46% dividend yield highlights a shareholder-friendly return approach.
Premium Valuation vs. Operational Safety
Eli Lilly excels in profitability but trades at a premium, increasing valuation risk. Johnson & Johnson balances decent returns with a more conservative valuation and stronger dividend yield. Growth-focused investors may prefer Lilly, while income and risk-averse profiles fit Johnson & Johnson better.
Which one offers the Superior Shareholder Reward?
I see Eli Lilly (LLY) offers a low dividend yield near 0.56%, with a moderate 26% payout ratio backed by strong free cash flow coverage (1.27x). Its buybacks are aggressive, enhancing shareholder returns despite a modest dividend. Johnson & Johnson (JNJ) yields 2.46%, with a higher 46% payout ratio but solid FCF coverage (1.43x). JNJ’s buyback activity is steady but less intense. Historically, Lilly’s reinvestment and buybacks fuel growth, while JNJ focuses on steady income and moderate growth. I conclude Lilly’s distribution model is more sustainable and offers superior total return potential in 2026.
Comparative Score Analysis: The Strategic Profile
The radar chart reveals the fundamental DNA and trade-offs of Eli Lilly and Company versus Johnson & Johnson, illustrating their core financial strengths and vulnerabilities:
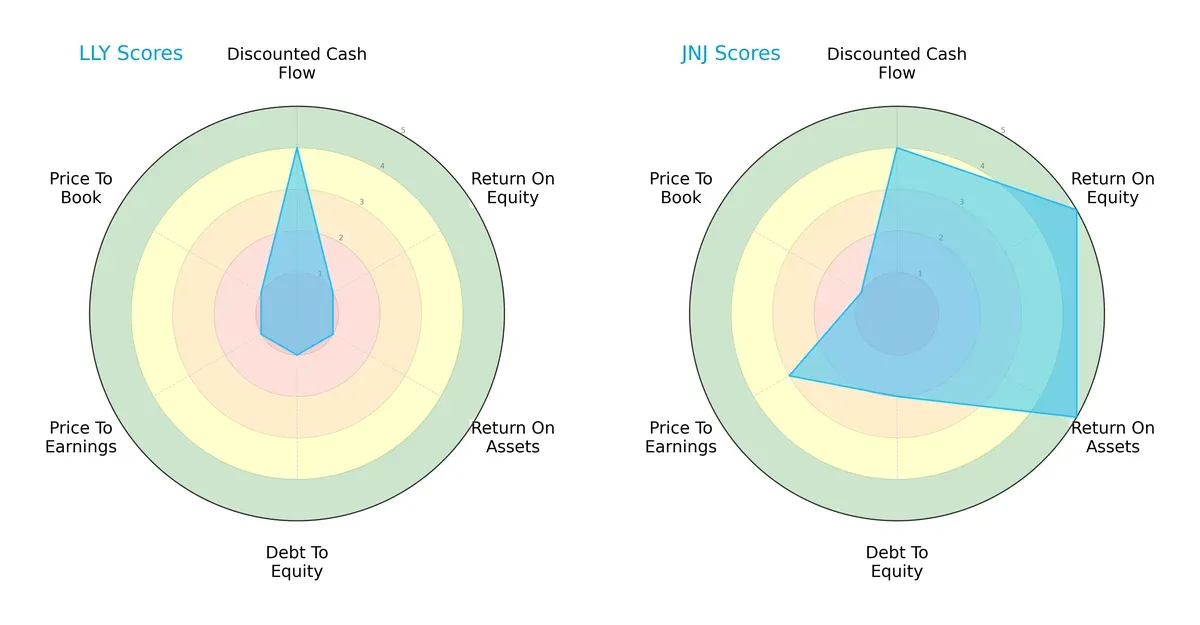
Johnson & Johnson displays a balanced profile with top-tier ROE (5) and ROA (5), signaling efficient asset use and shareholder value creation. Its debt-to-equity (2) and valuation metrics (PE at 3, PB at 1) show moderate risk and fair pricing. Eli Lilly struggles with very unfavorable scores across ROE (1), ROA (1), leverage (1), and valuation (PE/PB at 1), relying solely on a decent DCF score (4). Johnson & Johnson’s diversified strengths outweigh Eli Lilly’s narrow edge in cash flow projections.
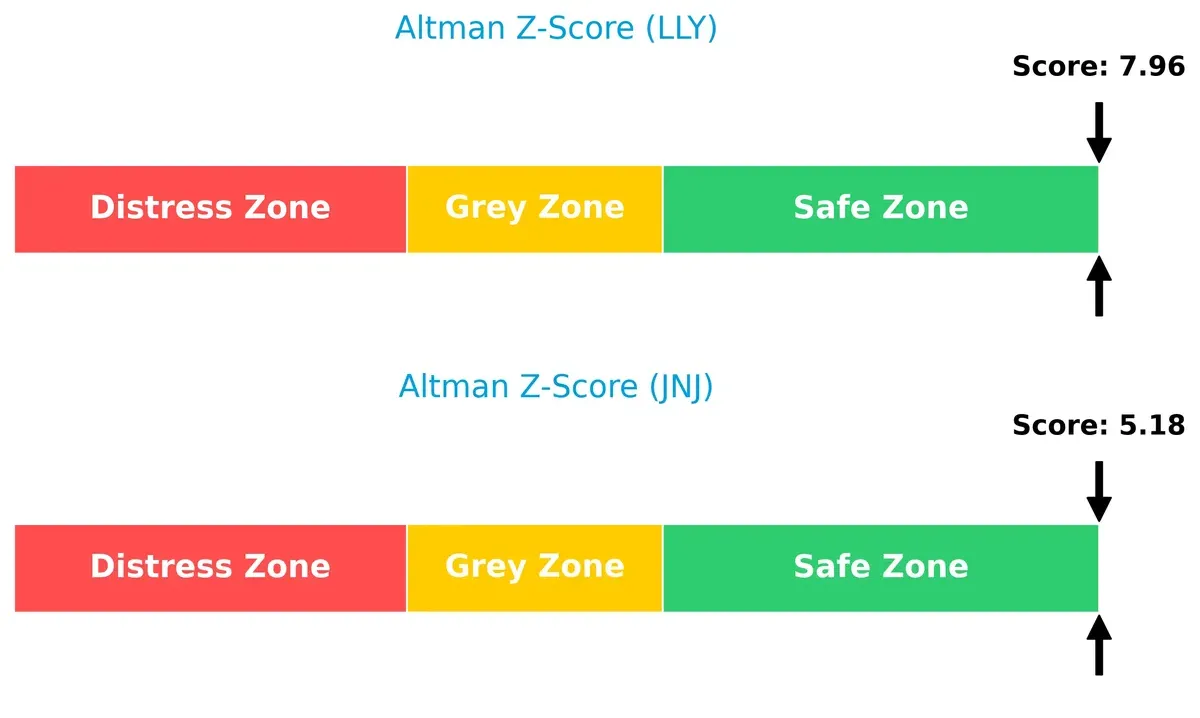
Bankruptcy Risk: Solvency Showdown
The Altman Z-Scores of 7.96 for Eli Lilly and 5.18 for Johnson & Johnson place both firms comfortably in the safe zone. Eli Lilly’s higher score suggests a marginally stronger buffer against financial distress in this cycle:
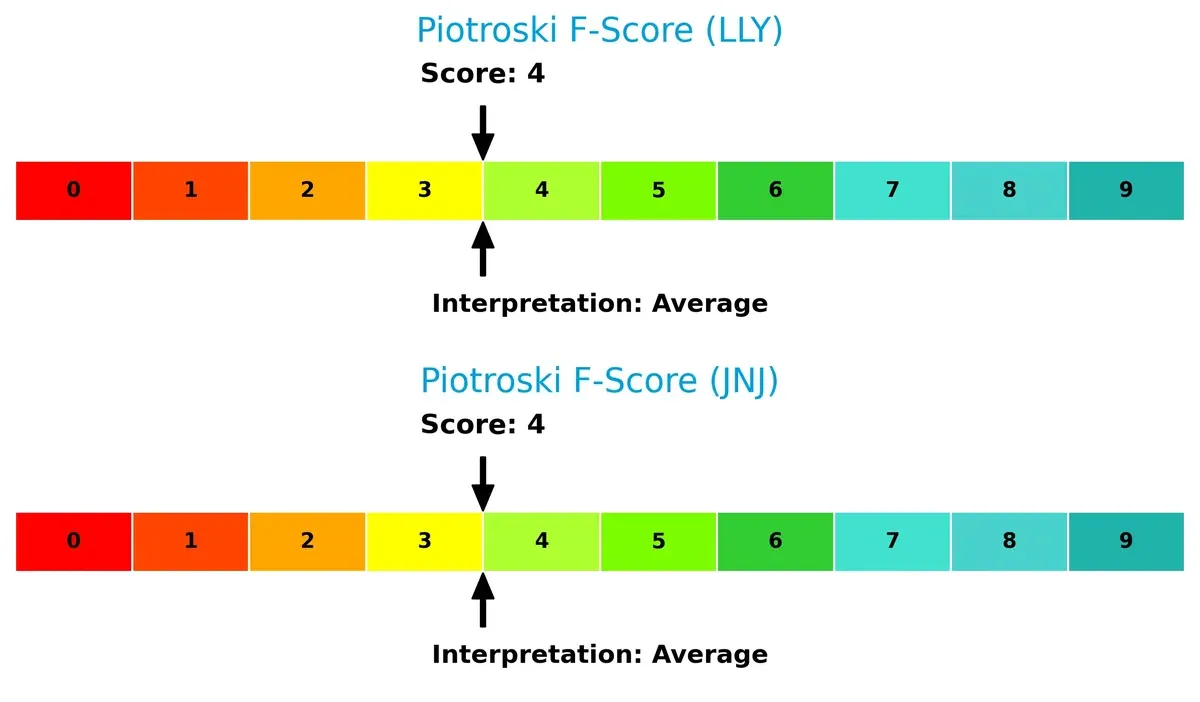
Financial Health: Quality of Operations
Both companies score a moderate 4 on the Piotroski F-Score, indicating average financial health. Neither firm exhibits clear red flags, but this middling score suggests room for operational improvement to reach peak strength:
How are the two companies positioned?
This section dissects LLY and JNJ’s operational DNA by comparing revenue distribution and internal strengths and weaknesses. The goal is to confront their economic moats and reveal which model delivers a more resilient, sustainable advantage today.
Revenue Segmentation: The Strategic Mix
The following visual comparison dissects how Eli Lilly and Johnson & Johnson diversify their income streams and where their primary sector bets lie:
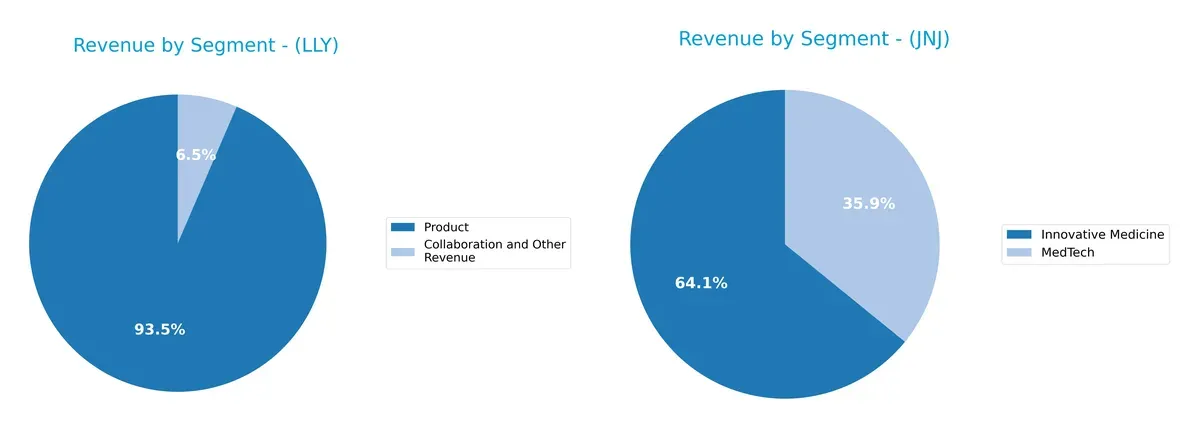
Eli Lilly anchors its revenue heavily in its Product segment, with $61B in 2025, while Collaboration and Other Revenue trails at $4.2B. This signals a concentrated pharmaceutical focus with limited diversification. Conversely, Johnson & Johnson presents a more balanced profile. Its Innovative Medicine segment dwarfs others at $60.4B, but MedTech contributes a substantial $33.8B, indicating a robust multi-sector ecosystem reducing concentration risk. JNJ’s mix pivots on infrastructure dominance and sector breadth.
Strengths and Weaknesses Comparison
This table compares the Strengths and Weaknesses of Eli Lilly and Company (LLY) and Johnson & Johnson (JNJ):
LLY Strengths
- High profitability with net margin 31.66% and ROIC 30.2%
- Strong return on equity at 77.78%
- Solid liquidity ratios with current ratio 1.58 and quick ratio 1.19
- Robust interest coverage at 33.16
- Significant US market share with $43.5B revenue
- Increasing product revenue, $60.9B in 2025
JNJ Strengths
- Favorable overall ratios with 57.14% favorable
- Diversified revenue streams across Innovative Medicine, MedTech, Consumer
- Global presence strong with $53.8B US and $35.8B in other regions
- Healthy dividend yield at 2.46%
- High fixed asset turnover at 4.07
- Stable interest coverage at 33.55
LLY Weaknesses
- Elevated valuation multiples: PE 46.76 and PB 36.37
- Moderate leverage with debt/equity 1.6
- Dividend yield low at 0.56%
- Neutral asset turnover at 0.58
- Revenue heavily US concentrated, less geographic diversification
JNJ Weaknesses
- Lower profitability metrics: ROE 32.87%, ROIC 13.71%
- Quick ratio weak at 0.77 indicates liquidity risk
- Asset turnover low at 0.47
- PB ratio unfavorable at 6.18
- Moderate debt/equity ratio at 0.59
Both companies show strong profitability and global presence, but LLY’s higher valuation and leverage contrast with JNJ’s broader diversification and higher dividend yield. These factors shape their strategic positioning and risk profiles.
The Moat Duel: Analyzing Competitive Defensibility
A structural moat is the only durable shield protecting a firm’s long-term profits from relentless competition erosion:
Eli Lilly and Company: Innovation-Driven Patent Moat
Eli Lilly’s moat stems from intangible assets—strong patent protections fuel sustained high ROIC above 24%, with 2025 margins exceeding 40%. New oncology and diabetes drugs in 2026 promise deeper moat entrenchment.
Johnson & Johnson: Diversified MedTech & Pharma Moat
Johnson & Johnson relies on a diversified portfolio moat, blending pharmaceuticals and medical devices. Its ROIC above WACC at 8.6% shows value creation but declining profitability signals pressure. Expansion in MedTech and innovative medicines could reverse this trend.
Patents vs. Diversification: The Moat Endurance Test
Eli Lilly’s patent moat is deeper and expanding, evidenced by accelerating revenue and margin gains. Johnson & Johnson’s broader but weakening moat faces challenges in sustaining ROIC growth. Lilly stands better poised to defend market share in 2026.
Which stock offers better returns?
The past year reveals contrasting trading dynamics for Eli Lilly and Johnson & Johnson, marked by differing price trajectories and volume patterns.
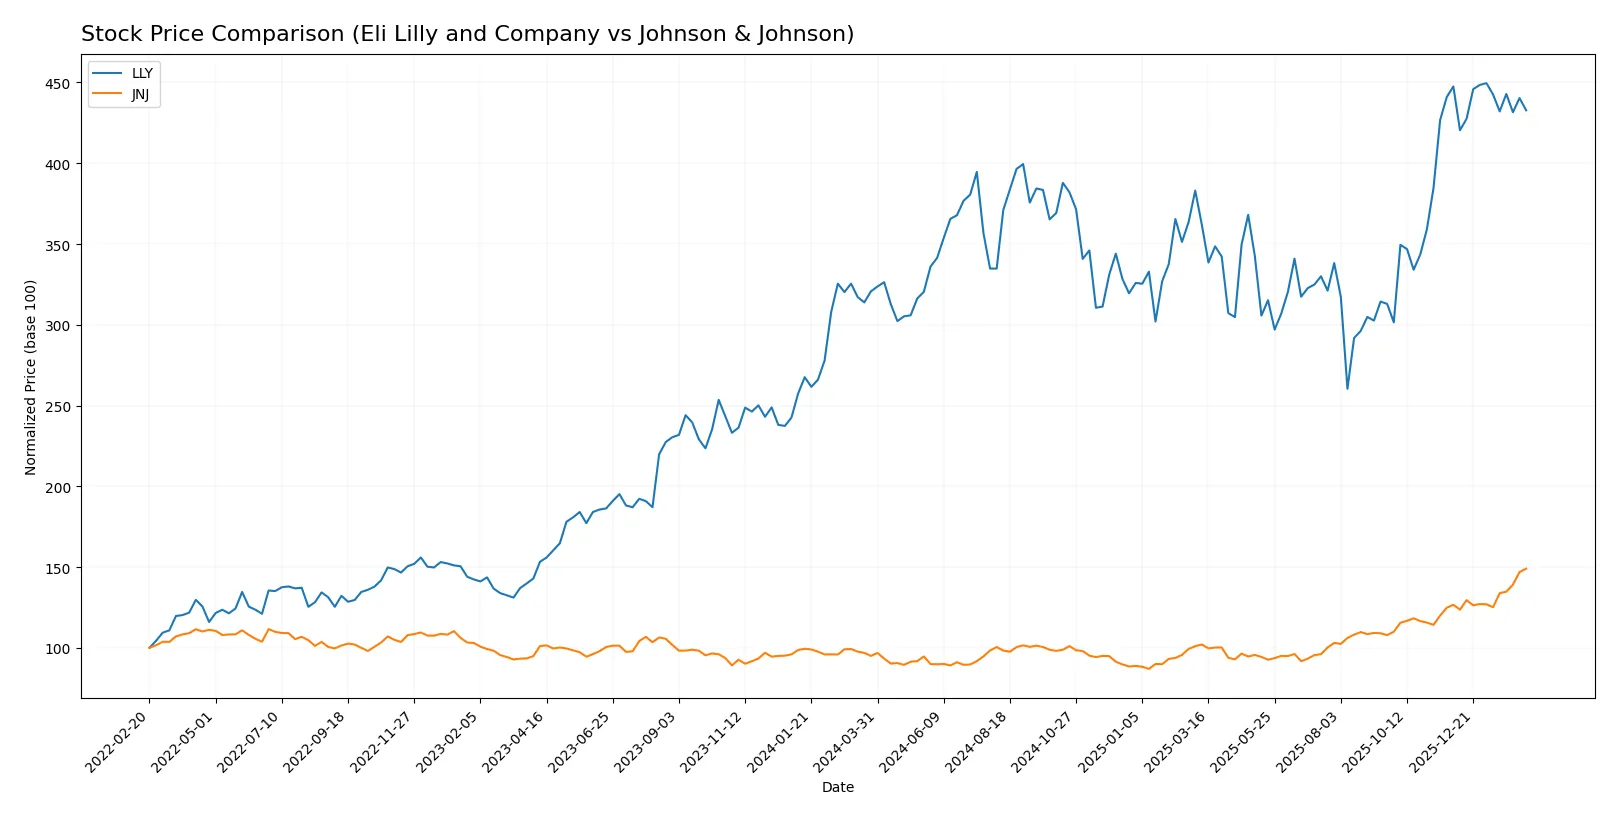
Trend Comparison
Eli Lilly’s stock gained 35% over the past year, reflecting a bullish trend with decelerating momentum. It ranged between 625.65 and 1080.36, showing strong volatility with a 105.38 std deviation.
Johnson & Johnson’s stock rose 56.8% in the same period, signaling a bullish trend with accelerating momentum. Price fluctuated between 142.06 and 243.45, supported by lower volatility at 22.57 std deviation.
Johnson & Johnson outperformed Eli Lilly with a higher total price gain and accelerating trend, indicating stronger market performance over the last 12 months.
Target Prices
Analysts project solid upside potential for Eli Lilly and Johnson & Johnson based on current consensus targets.
| Company | Target Low | Target High | Consensus |
|---|---|---|---|
| Eli Lilly and Company | 830 | 1300 | 1203.56 |
| Johnson & Johnson | 190 | 265 | 229.33 |
Eli Lilly’s target consensus at 1203.56 suggests roughly 16% upside versus its 1040 current price. Johnson & Johnson’s 229.33 consensus implies a modest 6% downside from its 243.45 price.

Don’t Let Luck Decide Your Entry Point
Optimize your entry points with our advanced ProRealTime indicators. You’ll get efficient buy signals with precise price targets for maximum performance. Start outperforming now!
How do institutions grade them?
This section compares recent institutional grades for Eli Lilly and Company and Johnson & Johnson:
Eli Lilly and Company Grades
The following table summarizes recent grades from reputable institutions for Eli Lilly and Company:
| Grading Company | Action | New Grade | Date |
|---|---|---|---|
| Deutsche Bank | Maintain | Buy | 2026-02-09 |
| Morgan Stanley | Maintain | Overweight | 2026-02-05 |
| JP Morgan | Maintain | Overweight | 2026-02-05 |
| Cantor Fitzgerald | Maintain | Overweight | 2026-02-05 |
| Wells Fargo | Maintain | Overweight | 2026-02-05 |
| Guggenheim | Maintain | Buy | 2026-01-20 |
| B of A Securities | Maintain | Buy | 2025-12-15 |
| Wells Fargo | Maintain | Overweight | 2025-12-10 |
| BMO Capital | Maintain | Outperform | 2025-12-04 |
| Guggenheim | Maintain | Buy | 2025-12-03 |
Johnson & Johnson Grades
The following table summarizes recent grades from reputable institutions for Johnson & Johnson:
| Grading Company | Action | New Grade | Date |
|---|---|---|---|
| RBC Capital | Maintain | Outperform | 2026-02-03 |
| Morgan Stanley | Upgrade | Overweight | 2026-01-28 |
| Freedom Capital Markets | Maintain | Hold | 2026-01-27 |
| Guggenheim | Maintain | Buy | 2026-01-23 |
| Citigroup | Maintain | Buy | 2026-01-22 |
| Wells Fargo | Maintain | Overweight | 2026-01-22 |
| TD Cowen | Maintain | Buy | 2026-01-22 |
| Morgan Stanley | Maintain | Equal Weight | 2026-01-22 |
| Stifel | Maintain | Hold | 2026-01-22 |
| B of A Securities | Maintain | Neutral | 2026-01-22 |
Which company has the best grades?
Eli Lilly consistently earns buy and overweight ratings, with multiple firms maintaining positive views. Johnson & Johnson shows a wider range, including hold and neutral ratings. Investors may perceive Eli Lilly’s more uniform strong grades as a sign of higher institutional confidence.
Risks specific to each company
The following categories identify the critical pressure points and systemic threats facing both firms in the 2026 market environment:
1. Market & Competition
Eli Lilly and Company
- Faces intense competition in diabetes and oncology drugs from large pharma and biosimilars.
Johnson & Johnson
- Competes across diversified healthcare segments, challenged by innovation pace and MedTech rivals.
2. Capital Structure & Debt
Eli Lilly and Company
- Higher debt-to-equity ratio (1.6), raising financial leverage concerns despite strong interest coverage.
Johnson & Johnson
- Lower debt-to-equity (0.59), indicating better balance sheet strength and lower financial risk.
3. Stock Volatility
Eli Lilly and Company
- Beta at 0.394 suggests modest volatility, offering relative stability in turbulent markets.
Johnson & Johnson
- Slightly lower beta at 0.347, reflecting marginally less sensitivity to market swings.
4. Regulatory & Legal
Eli Lilly and Company
- Ongoing drug approvals and patent cliffs pose regulatory risks.
Johnson & Johnson
- Recent spin-off of Consumer Health reduces regulatory complexity but legal challenges remain in pharmaceuticals.
5. Supply Chain & Operations
Eli Lilly and Company
- Supply chain exposed to raw material cost inflation and global logistics disruptions.
Johnson & Johnson
- Larger scale with diversified supply chains, but complexity may increase operational risks.
6. ESG & Climate Transition
Eli Lilly and Company
- Active ESG initiatives but faces pressure to align with climate transition in pharma manufacturing.
Johnson & Johnson
- Stronger ESG commitments post-Kenvue spin-off, with focus on sustainable MedTech and pharma operations.
7. Geopolitical Exposure
Eli Lilly and Company
- Global footprint exposes it to trade tensions and emerging market volatility.
Johnson & Johnson
- Similarly exposed, but diversified segments may mitigate localized geopolitical risks.
Which company shows a better risk-adjusted profile?
Eli Lilly’s most impactful risk is its elevated financial leverage, which could amplify stress during market downturns despite robust profitability. Johnson & Johnson faces significant competitive pressure in innovation but benefits from a stronger balance sheet and diversified operations. Overall, Johnson & Johnson offers a better risk-adjusted profile, supported by its favorable Altman Z-score of 5.18 and a lower debt burden, reflecting greater financial resilience in 2026’s complex healthcare landscape.
Final Verdict: Which stock to choose?
Eli Lilly dominates with an unmatched efficiency in capital allocation, driving soaring returns on invested capital well above its cost. Its robust innovation engine fuels rapid growth, yet elevated leverage marks a point of vigilance. It suits portfolios chasing aggressive growth with a tolerance for elevated risk.
Johnson & Johnson commands a wide strategic moat through diversified healthcare segments and steady recurring revenue streams. Its conservative balance sheet offers better stability than Lilly, appealing to investors favoring consistent income and capital preservation. It fits well within a GARP (Growth at a Reasonable Price) portfolio.
If you prioritize high-growth potential and are comfortable with leverage, Eli Lilly is the compelling choice due to its superior ROIC and dynamic profitability. However, if you seek durability and income stability, Johnson & Johnson offers better risk management and a more balanced financial profile. Both represent strong contenders, but investor strategy dictates the preferred path.
Disclaimer: Investment carries a risk of loss of initial capital. The past performance is not a reliable indicator of future results. Be sure to understand risks before making an investment decision.
Go Further
I encourage you to read the complete analyses of Eli Lilly and Company and Johnson & Johnson to enhance your investment decisions: