Home > Comparison > Healthcare > LLY vs GILD
The strategic rivalry between Eli Lilly and Company and Gilead Sciences defines the competitive landscape of the healthcare sector. Eli Lilly operates as a diversified pharmaceutical powerhouse with a broad portfolio across chronic and acute conditions. In contrast, Gilead focuses on specialized biopharmaceutical innovation targeting viral diseases and oncology. This analysis will assess which company’s operational model and strategic positioning deliver a superior risk-adjusted return for a diversified portfolio.
Table of contents
Companies Overview
Eli Lilly and Company and Gilead Sciences, Inc. are pivotal players in the global pharmaceutical landscape.
Eli Lilly and Company: Global Pharma Innovator
Eli Lilly dominates as a broad-spectrum drug manufacturer with a $932B market cap. Its revenue centers on human pharmaceuticals, notably diabetes and oncology treatments. In 2026, it sharpens focus on expanding innovative therapies for cancer and autoimmune diseases, leveraging a deep pipeline and strategic collaborations.
Gilead Sciences, Inc.: Biopharma Specialist in Viral and Oncology Treatments
Gilead Sciences, valued at $192B, specializes in antiviral and oncology medicines, generating revenue through HIV, liver disease, and cancer therapies. In 2026, Gilead prioritizes advancing cell therapy and immuno-oncology while strengthening alliances with biotech firms to address unmet medical needs.
Strategic Collision: Similarities & Divergences
Both companies emphasize specialty pharmaceuticals but differ in scope; Lilly pursues a diversified portfolio, whereas Gilead focuses on niche viral and oncology segments. Their battleground lies in innovative cancer therapies and immunology. Investors face contrasting profiles: Lilly’s scale and broad pipeline versus Gilead’s targeted innovation and strategic partnerships.
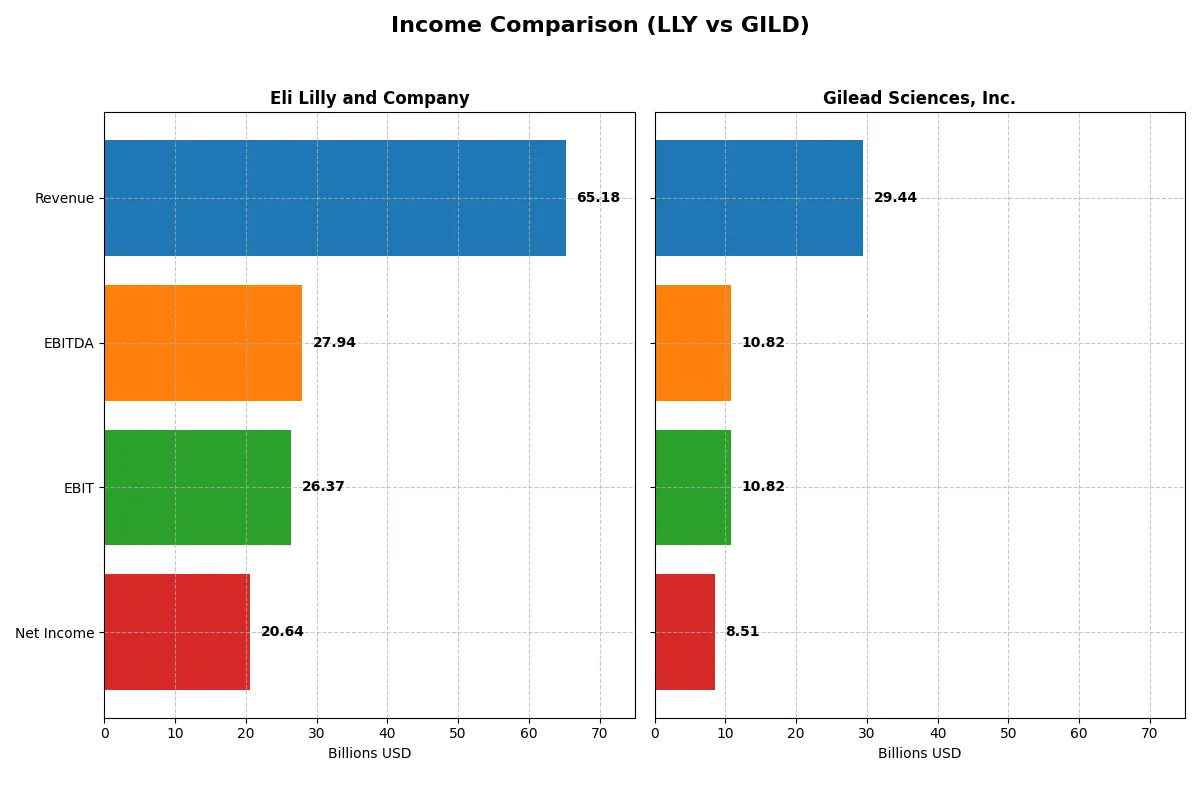
Income Statement Comparison
This data dissects the core profitability and scalability of both corporate engines to reveal who dominates the bottom line in 2025:
| Metric | Eli Lilly and Company (LLY) | Gilead Sciences, Inc. (GILD) |
|---|---|---|
| Revenue | 65.2B | 29.4B |
| Cost of Revenue | 10.6B | 3.9B |
| Operating Expenses | 24.9B | 13.7B |
| Gross Profit | 54.6B | 25.5B |
| EBITDA | 27.9B | 10.8B |
| EBIT | 26.4B | 10.8B |
| Interest Expense | 0.8B | 1.0B |
| Net Income | 20.6B | 8.5B |
| EPS | 23.00 | 6.84 |
| Fiscal Year | 2025 | 2025 |
Income Statement Analysis: The Bottom-Line Duel
This income statement comparison reveals how efficiently each company converts revenue into profit and sustains margin strength over time.
Eli Lilly and Company Analysis
Eli Lilly’s revenue surged from 28B in 2021 to 65B in 2025, doubling its top line in five years. Net income grew even faster, nearly quadrupling to 20.6B, reflecting outstanding bottom-line momentum. Gross margin stays robust near 84%, and net margin improves to 31.7%, showing superb cost control and operational efficiency in 2025.
Gilead Sciences, Inc. Analysis
Gilead’s revenue expanded modestly from 27.3B in 2021 to 29.4B in 2025, showing limited top-line growth. Net income rose from 6.2B to 8.5B, with a notable jump in 2025 driven by margin improvements. Gross margin stands higher at 86.7%, but net margin trails at 28.9%. The company boosted EBIT and net margin significantly last year, signaling improved profitability.
Revenue Explosion vs. Margin Refinement
Eli Lilly dominates with explosive revenue and net income growth, underpinned by strong margin expansion and efficient cost management. Gilead delivers higher gross margin but lags in revenue growth and net margin scale. For investors, Lilly’s profile offers powerful growth paired with consistent margin gains, while Gilead’s appeal lies in margin quality and recent profitability momentum.
Financial Ratios Comparison
These vital ratios act as a diagnostic tool to expose the underlying fiscal health, valuation premiums, and capital efficiency of the companies analyzed:
| Ratios | Eli Lilly and Company (LLY) | Gilead Sciences, Inc. (GILD) |
|---|---|---|
| ROE | 77.78% | 0% |
| ROIC | 30.20% | 0% |
| P/E | 46.76 | 17.94 |
| P/B | 36.37 | 0 |
| Current Ratio | 1.58 | 0 |
| Quick Ratio | 1.19 | 0 |
| D/E | 1.60 | 0 |
| Debt-to-Assets | 37.79% | 0% |
| Interest Coverage | 37.34 | 11.54 |
| Asset Turnover | 0.58 | 0 |
| Fixed Asset Turnover | 2.64 | 0 |
| Payout ratio | 26.09% | 46.19% |
| Dividend yield | 0.56% | 2.57% |
| Fiscal Year | 2025 | 2025 |
Efficiency & Valuation Duel: The Vital Signs
Financial ratios act as a company’s DNA, revealing hidden risks and operational excellence behind headline numbers.
Eli Lilly and Company
Eli Lilly demonstrates strong profitability with a 77.78% ROE and a 31.66% net margin, signaling operational efficiency. However, its valuation appears stretched, trading at a high P/E of 46.76 and a P/B of 36.37. Dividend yield is low at 0.56%, reflecting a preference for reinvestment in R&D and growth initiatives.
Gilead Sciences, Inc.
Gilead shows a favorable net margin of 28.9% but reports zero ROE and ROIC, indicating profitability challenges. The valuation is more moderate with a P/E of 17.94 and a favorable dividend yield of 2.57%, suggesting a shareholder return focus through dividends rather than aggressive growth reinvestment.
Premium Valuation vs. Operational Safety
Eli Lilly’s high profitability and reinvestment strategy come at a premium valuation, while Gilead offers moderate valuation with dividend income but weaker profitability metrics. Investors seeking growth might favor Lilly’s profile; those prioritizing income and valuation stability might prefer Gilead.
Which one offers the Superior Shareholder Reward?
I see Eli Lilly (LLY) delivers a modest 0.56% dividend yield with a conservative 26% payout ratio, supported by strong free cash flow of 10B in 2025. Its buyback activity is robust, sustaining long-term value. Gilead Sciences (GILD) offers a higher 2.57% yield and a 46% payout ratio, fully covered by free cash flow of 8B. GILD’s buybacks are active but less intense than LLY’s. I favor Eli Lilly’s balanced distribution and superior buyback discipline for a more sustainable total return in 2026.
Comparative Score Analysis: The Strategic Profile
The radar chart reveals the fundamental DNA and trade-offs of Eli Lilly and Company versus Gilead Sciences, Inc., highlighting their core financial strengths and weaknesses:
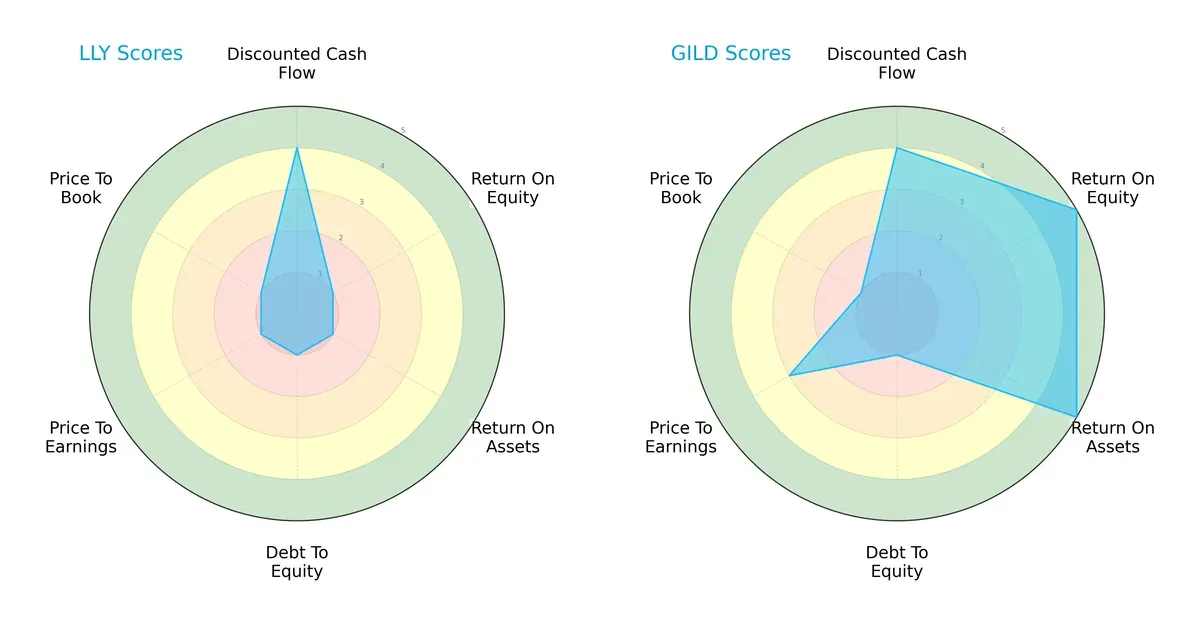
Gilead Sciences exhibits superior profitability with high ROE and ROA scores (5 each), contrasting sharply with Eli Lilly’s weak performance (scores of 1). Both firms share a strong DCF score of 4, signaling reasonable valuation expectations. However, Eli Lilly struggles with balance sheet risk, reflected in poor debt-to-equity and valuation metrics. Gilead shows a more balanced profile, leveraging operational efficiency, despite a high debt burden.
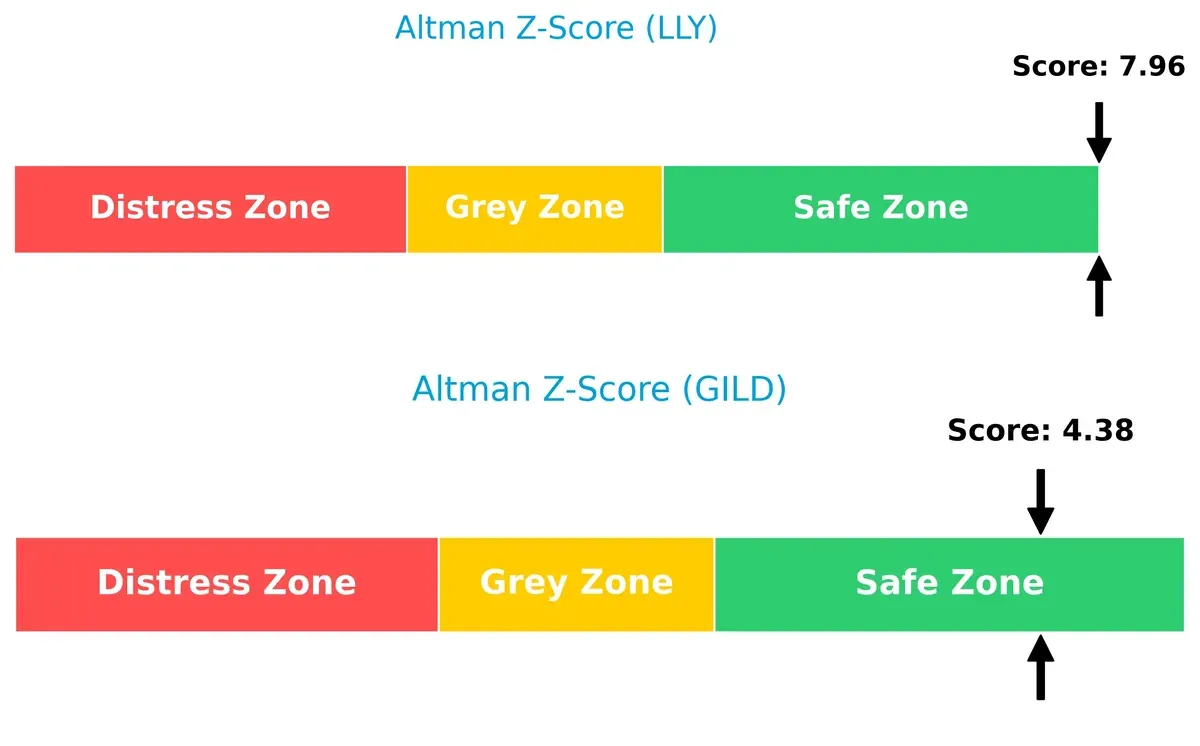
Bankruptcy Risk: Solvency Showdown
The Altman Z-Score gap indicates both companies are in the safe zone, but Eli Lilly’s score of 7.96 far surpasses Gilead’s 4.38, implying stronger long-term solvency and lower bankruptcy risk in this cycle:
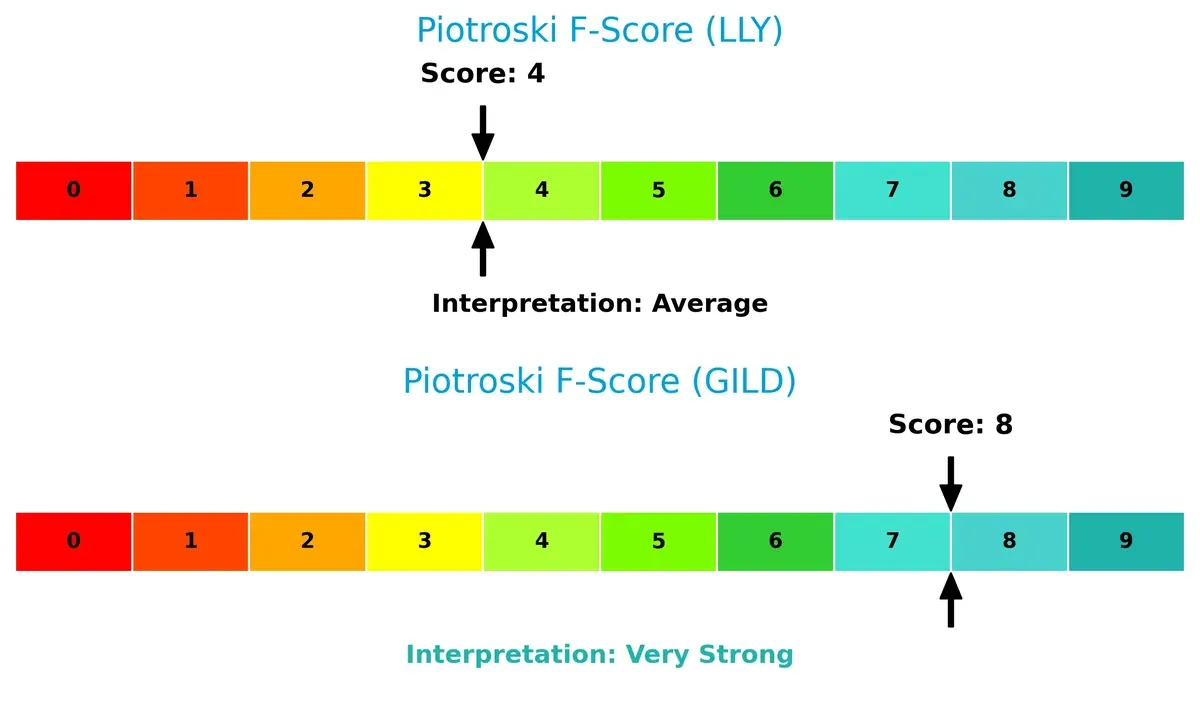
Financial Health: Quality of Operations
Gilead’s Piotroski F-Score of 8 signals very strong financial health, reflecting robust internal operations. Eli Lilly’s score of 4 is average, raising caution on operational quality and financial stability:
How are the two companies positioned?
This section dissects the operational DNA of Eli Lilly and Gilead Sciences by comparing their revenue distribution by segment and internal dynamics. The goal is to confront their economic moats to determine which model offers the most resilient, sustainable competitive advantage today.
Revenue Segmentation: The Strategic Mix
This visual comparison dissects how Eli Lilly and Company and Gilead Sciences diversify their income streams and where their primary sector bets lie:
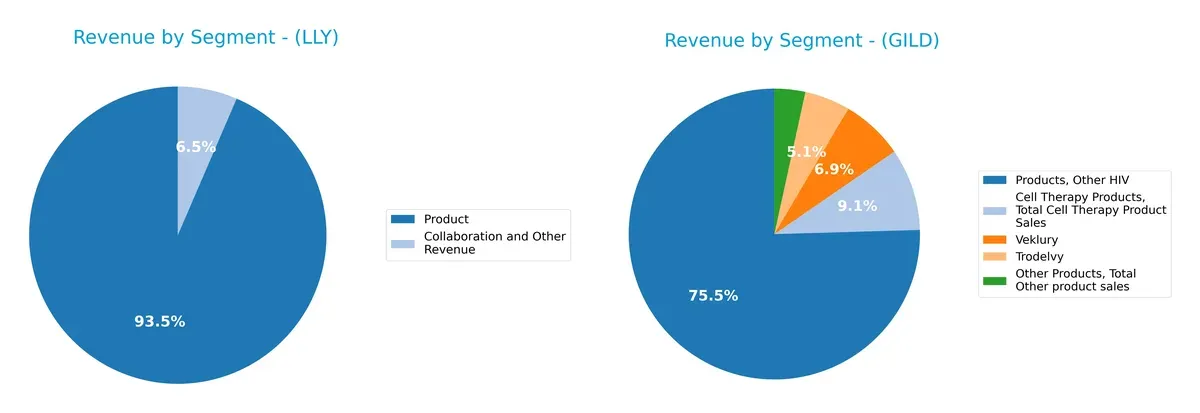
Eli Lilly anchors its revenue heavily in a dominant product segment with $60.96B in 2025, supplemented by $4.22B from collaboration revenues, showing a focused but slightly diversified base. Gilead’s 2024 revenue spreads across multiple antiviral and specialty products, with “Other HIV” sales at $19.61B, but smaller contributions from cell therapy and other drugs. Lilly’s concentration signals strong ecosystem lock-in, while Gilead’s mix balances concentration risk with innovation bets.
Strengths and Weaknesses Comparison
This table compares the strengths and weaknesses of Eli Lilly and Company (LLY) and Gilead Sciences, Inc. (GILD):
LLY Strengths
- High profitability with 31.66% net margin
- Strong ROE at 77.78% and ROIC at 30.2%
- Favorable liquidity ratios with current ratio 1.58
- Diverse product and collaboration revenue streams
- Significant global sales with US and Europe leading
- Strong interest coverage at 33.16
GILD Strengths
- Favorable net margin at 28.9%
- Low debt-to-equity and debt-to-assets ratios
- Solid interest coverage at 10.57
- Favorable price-to-book ratio
- Higher dividend yield at 2.57%
- Diverse antiviral and cell therapy product portfolio
LLY Weaknesses
- High valuation multiples with P/E 46.76 and P/B 36.37
- Elevated debt-to-equity ratio at 1.6
- Moderate asset turnover at 0.58
- Low dividend yield at 0.56%
- Neutral debt to assets at 37.79%
- Some unfavorable ratios reduce global rating
GILD Weaknesses
- Zero ROE and ROIC indicate weak profitability efficiency
- Unavailable WACC complicates cost of capital assessment
- Unfavorable liquidity ratios (current and quick at 0)
- Poor asset turnover ratios
- Neutral P/E at 17.94 but no reported book value
- Higher proportion of unfavorable ratios lowers overall rating
Both companies show competitive strengths in profitability and product diversity but differ in financial structure and valuation metrics. LLY’s strong returns contrast with GILD’s liquidity and efficiency concerns, influencing their strategic financial positioning.
The Moat Duel: Analyzing Competitive Defensibility
A structural moat protects long-term profits from being eroded by competition’s relentless pressure. Let’s dissect the competitive advantages of these two pharma giants:
Eli Lilly and Company: Innovation-Driven Intangible Assets
Eli Lilly’s moat stems from its robust portfolio of patented drugs and continuous R&D. This manifests in a high ROIC exceeding WACC by 25%, signaling strong value creation. With expanding diabetes and oncology franchises, its moat deepens in 2026 amid new drug launches.
Gilead Sciences, Inc.: Specialized Therapeutic Focus
Gilead relies on niche antiviral therapies as its moat, contrasting Lilly’s broad innovation scope. Its ROIC trend declines sharply, indicating weakening capital efficiency. Yet, breakthroughs in cell therapy offer potential disruption and modest moat reinforcement in 2026.
Innovation Breadth vs. Niche Specialization
Eli Lilly’s wider moat, supported by growing ROIC and diversified product pipeline, outmatches Gilead’s narrowing moat and declining ROIC. Lilly stands better poised to defend and expand market share amid intensifying competition.
Which stock offers better returns?
Over the past year, both Eli Lilly and Gilead Sciences showed strong price gains, with Gilead accelerating its upward trend while Eli Lilly’s momentum slowed recently.
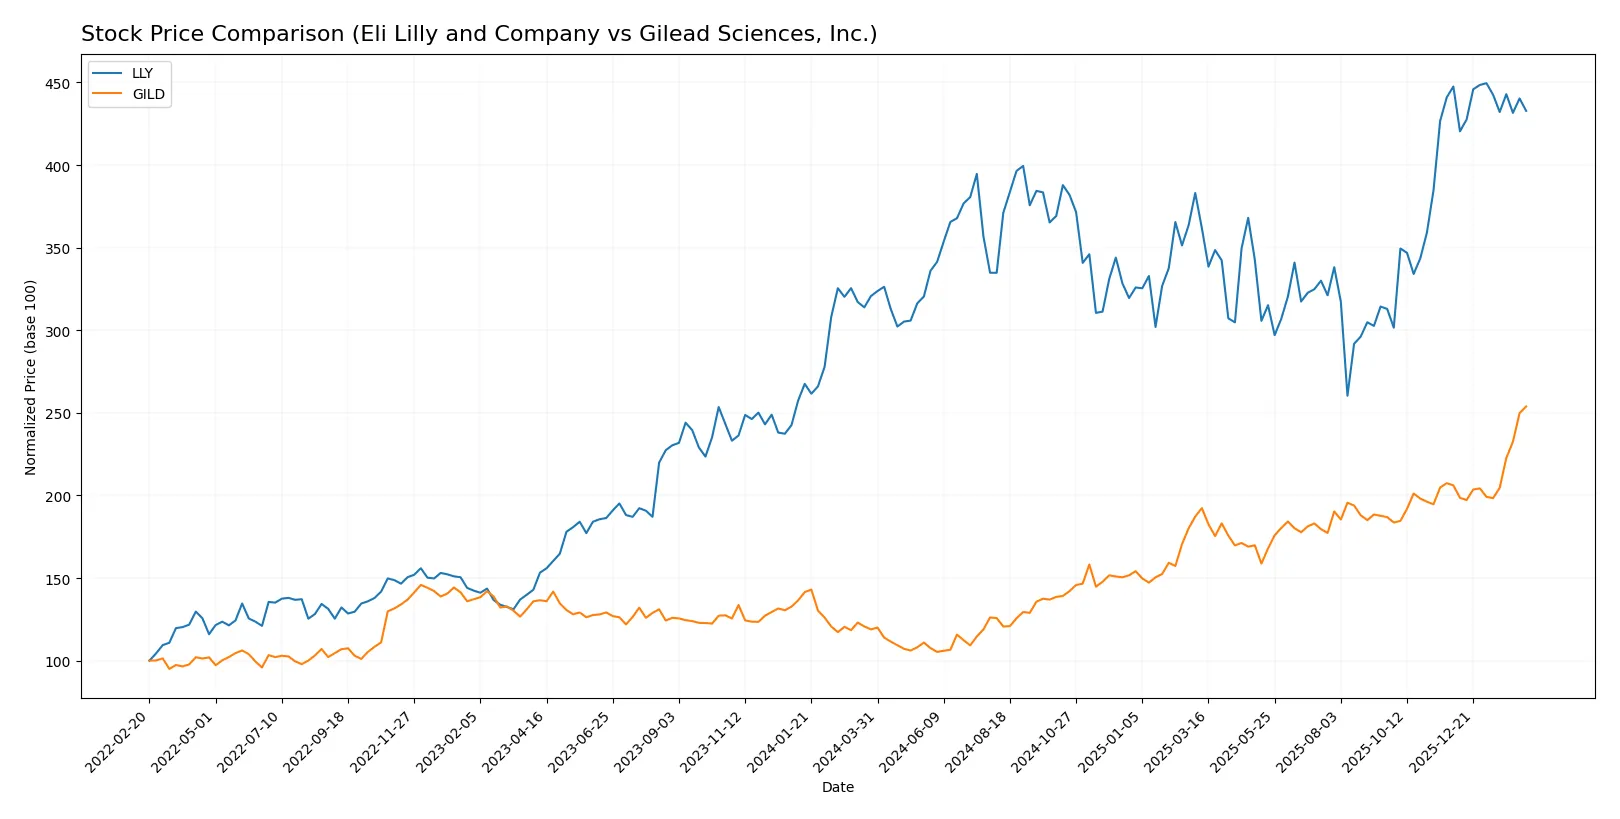
Trend Comparison
Eli Lilly’s stock rose 34.96% over the last 12 months, reflecting a bullish trend with decelerating gains and a high volatility of 105.38. The recent three-month period saw a slight pullback of -3.3%.
Gilead Sciences surged 113.44% in the past year, confirming a bullish and accelerating trend with low volatility of 21.42. Its recent three-month gain of 23.16% further supports strong upward momentum.
Gilead outperformed Eli Lilly by a wide margin, delivering the highest market returns and demonstrating sustained acceleration compared to Eli Lilly’s recent deceleration.
Target Prices
Analysts present a bullish consensus with meaningful upside potential for both Eli Lilly and Gilead Sciences.
| Company | Target Low | Target High | Consensus |
|---|---|---|---|
| Eli Lilly and Company | 830 | 1300 | 1203.56 |
| Gilead Sciences, Inc. | 105 | 177 | 154.2 |
Eli Lilly’s consensus target exceeds its current price by about 16%, signaling confidence in continued growth. Gilead’s target aligns closely with its price, reflecting tempered but positive expectations.

Don’t Let Luck Decide Your Entry Point
Optimize your entry points with our advanced ProRealTime indicators. You’ll get efficient buy signals with precise price targets for maximum performance. Start outperforming now!
How do institutions grade them?
Eli Lilly and Company Grades
The following table summarizes recent grades from major financial institutions for Eli Lilly and Company.
| Grading Company | Action | New Grade | Date |
|---|---|---|---|
| Deutsche Bank | Maintain | Buy | 2026-02-09 |
| Morgan Stanley | Maintain | Overweight | 2026-02-05 |
| JP Morgan | Maintain | Overweight | 2026-02-05 |
| Cantor Fitzgerald | Maintain | Overweight | 2026-02-05 |
| Wells Fargo | Maintain | Overweight | 2026-02-05 |
| Guggenheim | Maintain | Buy | 2026-01-20 |
| B of A Securities | Maintain | Buy | 2025-12-15 |
| Wells Fargo | Maintain | Overweight | 2025-12-10 |
| BMO Capital | Maintain | Outperform | 2025-12-04 |
| Guggenheim | Maintain | Buy | 2025-12-03 |
Gilead Sciences, Inc. Grades
This table shows recent grade updates from recognized firms for Gilead Sciences, Inc.
| Grading Company | Action | New Grade | Date |
|---|---|---|---|
| RBC Capital | Maintain | Sector Perform | 2026-02-11 |
| Needham | Maintain | Buy | 2026-02-11 |
| Wells Fargo | Maintain | Overweight | 2026-02-11 |
| Truist Securities | Maintain | Buy | 2026-02-11 |
| Cantor Fitzgerald | Maintain | Overweight | 2026-02-11 |
| Scotiabank | Maintain | Sector Outperform | 2026-02-11 |
| Truist Securities | Maintain | Buy | 2026-01-27 |
| Citigroup | Maintain | Buy | 2026-01-27 |
| UBS | Maintain | Buy | 2026-01-26 |
| Morgan Stanley | Maintain | Overweight | 2026-01-13 |
Which company has the best grades?
Eli Lilly consistently receives “Buy” and “Overweight” ratings, often labeled “Outperform,” indicating strong institutional confidence. Gilead’s ratings mix “Buy,” “Overweight,” and some “Sector Perform,” suggesting more cautious optimism. Investors might interpret Eli Lilly’s grades as signaling steadier consensus on growth potential.
Risks specific to each company
The following categories identify the critical pressure points and systemic threats facing both firms in the 2026 market environment:
1. Market & Competition
Eli Lilly and Company
- Dominates broad pharmaceutical markets with diversified drug portfolio and strong collaborations, but faces high P/E and P/B ratios signaling valuation concerns.
Gilead Sciences, Inc.
- Focuses on niche biopharmaceutical segments with moderate valuation, but limited asset turnover and product diversification pose competitive risks.
2. Capital Structure & Debt
Eli Lilly and Company
- Moderate debt-to-assets (38%) with high interest coverage (33x), but debt-to-equity ratio at 1.6 flags financial leverage risk.
Gilead Sciences, Inc.
- Virtually no reported debt, signaling conservative leverage and stronger balance sheet resilience.
3. Stock Volatility
Eli Lilly and Company
- Demonstrates low beta (0.39), reflecting stability and less sensitivity to market swings.
Gilead Sciences, Inc.
- Similarly low beta (0.39), suggesting stable stock with low volatility.
4. Regulatory & Legal
Eli Lilly and Company
- Exposed to regulatory risks inherent in diverse global pharmaceutical markets and ongoing drug approvals.
Gilead Sciences, Inc.
- Faces regulatory scrutiny especially in specialized therapies and international markets, with potential trial-related liabilities.
5. Supply Chain & Operations
Eli Lilly and Company
- Larger workforce (47K) and extensive product line increase operational complexity and supply chain vulnerability.
Gilead Sciences, Inc.
- Smaller workforce (17.6K) may enhance agility but reliance on fewer products heightens operational risk.
6. ESG & Climate Transition
Eli Lilly and Company
- ESG initiatives face pressure to align with climate goals given large scale and manufacturing footprint.
Gilead Sciences, Inc.
- Smaller scale may ease ESG transitions but industry-wide expectations on sustainability remain a challenge.
7. Geopolitical Exposure
Eli Lilly and Company
- Global operations expose it to geopolitical risks including trade tensions and regulatory shifts.
Gilead Sciences, Inc.
- International presence also vulnerable, but more concentrated markets may limit exposure breadth.
Which company shows a better risk-adjusted profile?
Eli Lilly faces leverage and valuation risks but benefits from strong profitability and operational scale. Gilead shows conservative capital structure and strong financial health scores but struggles with asset utilization and regulatory concentration. Gilead’s better Piotroski score (8 vs. 4) and safer Altman Z-Score confirm a stronger risk-adjusted profile. Yet, Eli Lilly’s stable stock and diversified portfolio provide resilience. The sharp contrast in debt profiles and asset efficiency defines their risk dynamics for 2026.
Final Verdict: Which stock to choose?
Eli Lilly’s superpower lies in its exceptional capital efficiency and robust profitability, demonstrating a very favorable moat with a growing ROIC well above its WACC. Its main point of vigilance is a high valuation multiple, which could pressure future returns. This stock fits well in an aggressive growth portfolio aiming for long-term value creation.
Gilead Sciences maintains a strategic moat through steady cash flow generation and solid income quality, supported by a safer dividend yield profile. While its ROIC trend is less favorable, Gilead offers a more moderate valuation and comparatively lower financial risk, making it suitable for a GARP investor seeking stable income with growth potential.
If you prioritize high growth backed by strong capital returns, Eli Lilly outshines due to its sustainable competitive advantage and profitability. However, if you seek better stability with reasonable growth and income, Gilead offers a more balanced risk profile and attractive cash flow resilience. Each scenario appeals to distinct investor strategies with differing tolerance for valuation and growth variability.
Disclaimer: Investment carries a risk of loss of initial capital. The past performance is not a reliable indicator of future results. Be sure to understand risks before making an investment decision.
Go Further
I encourage you to read the complete analyses of Eli Lilly and Company and Gilead Sciences, Inc. to enhance your investment decisions: