Home > Comparison > Healthcare > ELV vs HUM
The strategic rivalry between Elevance Health Inc. and Humana Inc. shapes the evolving healthcare plans sector. Elevance operates as a vast, integrated health benefits provider, serving over 100M members with comprehensive care solutions. Humana, smaller but specialized, focuses on retail and specialty health services, including Medicare and Medicaid programs. This analysis pits scale against specialization to identify which model delivers superior risk-adjusted returns for diversified portfolios in healthcare’s complex landscape.
Table of contents
Companies Overview
Elevance Health and Humana stand as two major players reshaping the U.S. healthcare plans market with distinct scales and strategies.
Elevance Health Inc.: Comprehensive Care Network Leader
Elevance Health dominates as a health benefits company serving 118M people with a broad portfolio spanning medical, digital, pharmacy, and behavioral solutions. Its revenue engine relies on connecting consumers to comprehensive care services across the entire health journey. In 2026, its strategic focus centers on expanding integrated care and digital health capabilities to enhance member outcomes.
Humana Inc.: Specialized Health and Wellness Provider
Humana operates as a health and well-being company focusing on medical, supplemental, and specialty plans. It serves roughly 22M members through retail, group, and healthcare services segments, including government contracts for Medicare and Medicaid programs. In 2026, Humana prioritizes growth in specialty products and home health services to deepen member engagement and diversify revenue.
Strategic Collision: Similarities & Divergences
Both firms compete fiercely in healthcare plans but diverge philosophically: Elevance favors a broad integrated ecosystem, while Humana emphasizes targeted specialty and home care solutions. Their primary battleground lies in government and commercial insurance segments where scale and service innovation drive market share. Elevance’s expansive scale contrasts with Humana’s focused niche strategy, shaping distinct risk and growth profiles for investors.
Income Statement Comparison
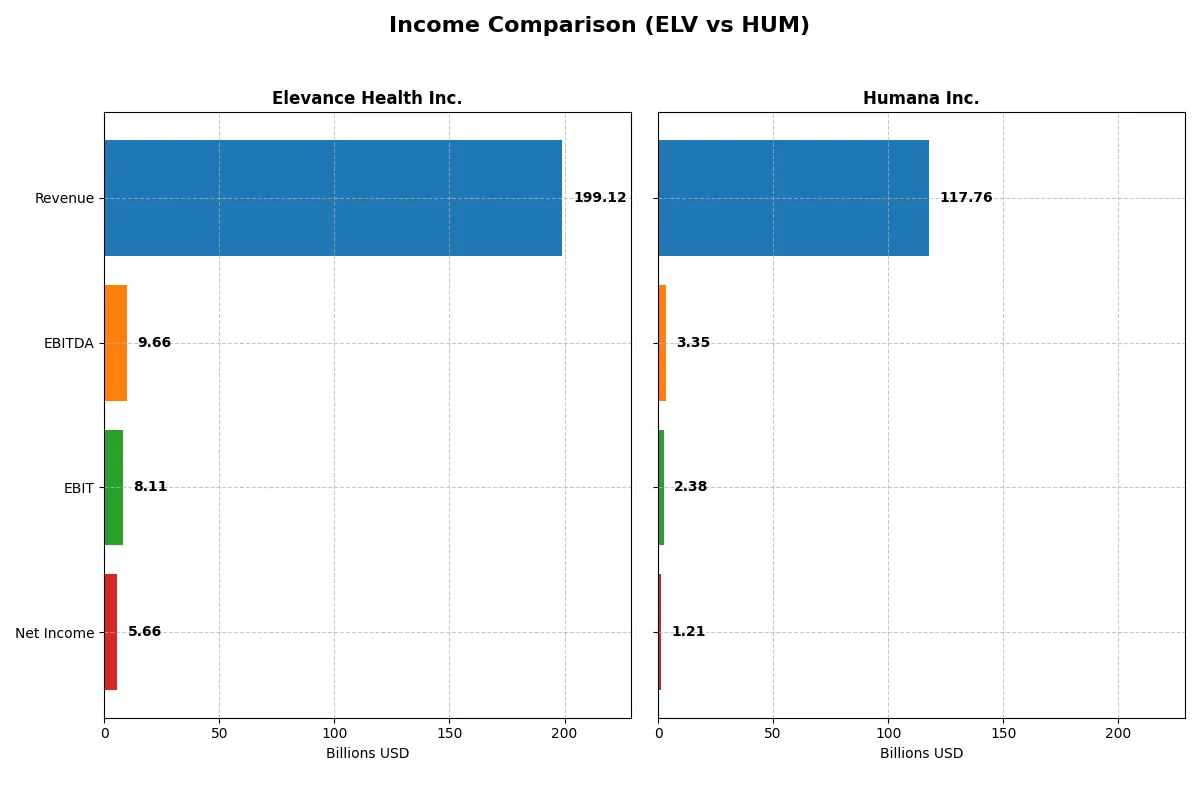
This data dissects the core profitability and scalability of both corporate engines to reveal who dominates the bottom line:
| Metric | Elevance Health Inc. (ELV) | Humana Inc. (HUM) |
|---|---|---|
| Revenue | 199.1B | 117.8B |
| Cost of Revenue | 148.2B | 0 |
| Operating Expenses | 42.8B | 116.0B |
| Gross Profit | 50.9B | 117.8B |
| EBITDA | 9.7B | 3.3B |
| EBIT | 8.1B | 2.4B |
| Interest Expense | 1.4B | 660M |
| Net Income | 5.7B | 1.2B |
| EPS | 25.18 | 10.01 |
| Fiscal Year | 2025 | 2024 |
Income Statement Analysis: The Bottom-Line Duel
This income statement comparison reveals which company runs a more efficient and profitable business engine over recent years.
Elevance Health Inc. Analysis
Elevance Health’s revenue rose sharply from 139B in 2021 to 199B in 2025, showing robust growth. Net income, however, declined slightly, reaching 5.66B in 2025. The company maintains a healthy gross margin around 25.6% but faces pressure on EBIT and net margins, which fell to 4.1% and 2.8% respectively, signaling margin compression despite growing top-line momentum.
Humana Inc. Analysis
Humana expanded revenue from 77B in 2020 to nearly 118B in 2024, marking solid growth. However, net income plunged from 3.37B to 1.21B over the same period, reflecting steep margin deterioration. While gross margin stands at an ideal 100% by accounting terms, EBIT and net margins remain low at 2.0% and 1.0%, respectively, highlighting operational challenges and shrinking profitability.
Verdict: Growth Trajectory vs. Margin Sustainability
Elevance Health commands a higher revenue scale with better margin sustainability despite recent earnings softness. Humana shows strong top-line growth but suffers substantial net income erosion and weaker profitability metrics. For investors prioritizing margin resilience and size, Elevance presents a more attractive profile, while Humana’s current margin pressures warrant caution.
Financial Ratios Comparison
These vital ratios act as a diagnostic tool to expose the underlying fiscal health, valuation premiums, and capital efficiency of each company:
| Ratios | Elevance Health Inc. (ELV) | Humana Inc. (HUM) |
|---|---|---|
| ROE | 12.9% | 7.4% |
| ROIC | 7.2% | N/A |
| P/E | 13.7 | 25.3 |
| P/B | 1.77 | 1.87 |
| Current Ratio | 1.54 | N/A |
| Quick Ratio | 1.54 | N/A |
| D/E | 0.73 | 0.68 |
| Debt-to-Assets | 26.4% | 24.0% |
| Interest Coverage | 5.0 | 2.6 |
| Asset Turnover | 1.64 | 2.53 |
| Fixed Asset Turnover | 42.5 | 39.6 |
| Payout ratio | 27.0% | 35.7% |
| Dividend yield | 1.97% | 1.41% |
| Fiscal Year | 2025 | 2024 |
Efficiency & Valuation Duel: The Vital Signs
Financial ratios serve as a company’s DNA, uncovering hidden risks and operational strengths crucial for investment decisions.
Elevance Health Inc.
Elevance Health posts a solid 12.9% ROE, signaling decent profitability, though its 2.85% net margin is less impressive. The stock trades at a reasonable 13.7 P/E, suggesting fair valuation. It supports shareholders with a 1.97% dividend yield, reflecting balanced capital allocation amid stable operational efficiency.
Humana Inc.
Humana’s profitability lags with a 7.4% ROE and a weak 1.02% net margin, indicating operational challenges. The stock appears expensive at a 25.3 P/E, reflecting stretched valuation. Dividend yield stands modest at 1.41%, signaling moderate shareholder returns despite less favorable profitability metrics.
Balanced Efficiency vs. Premium Valuation
Elevance Health delivers a more balanced risk-reward profile with reasonable valuation and better profitability. Humana’s higher valuation contrasts with weaker returns and operational efficiency. Risk-tolerant investors may consider Humana’s growth potential, while those preferring stability might lean toward Elevance’s steadier financial footing.
Which one offers the Superior Shareholder Reward?
I observe Elevance Health (ELV) pays a higher dividend yield (~1.97%) with a moderate payout ratio (~27%), supported by strong free cash flow coverage (~74%). Humana (HUM) yields lower (~1.41%) but with a higher payout ratio (~36%). ELV executes more intense buybacks, enhancing total return sustainability. ELV’s balanced yield and buybacks offer a superior 2026 shareholder reward.
Comparative Score Analysis: The Strategic Profile
The radar chart reveals the fundamental DNA and trade-offs of Elevance Health and Humana, highlighting their core financial strengths and vulnerabilities:
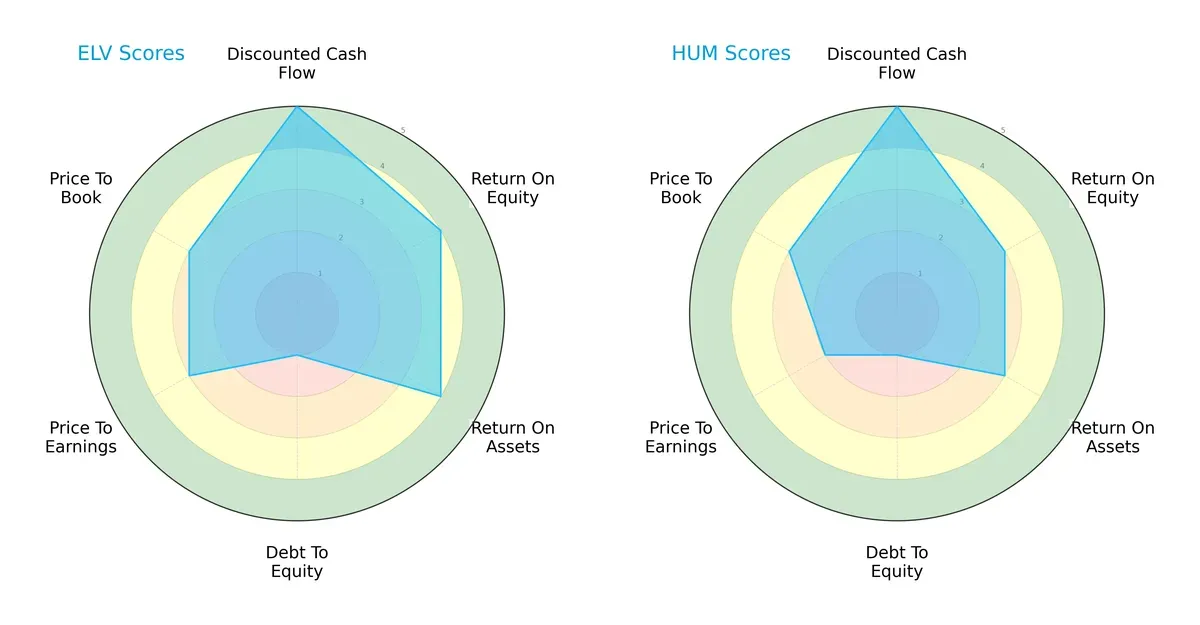
Elevance Health shows a more balanced profile with strong DCF (5), ROE (4), and ROA (4) scores, indicating efficient asset use and profitability. Both firms suffer from weak debt-to-equity scores (1), signaling high leverage risks. Humana lags in ROE (3) and ROA (3), relying more on cash flow strength (DCF 5) but struggles with valuation metrics, especially P/E (2), reflecting less favorable market pricing.
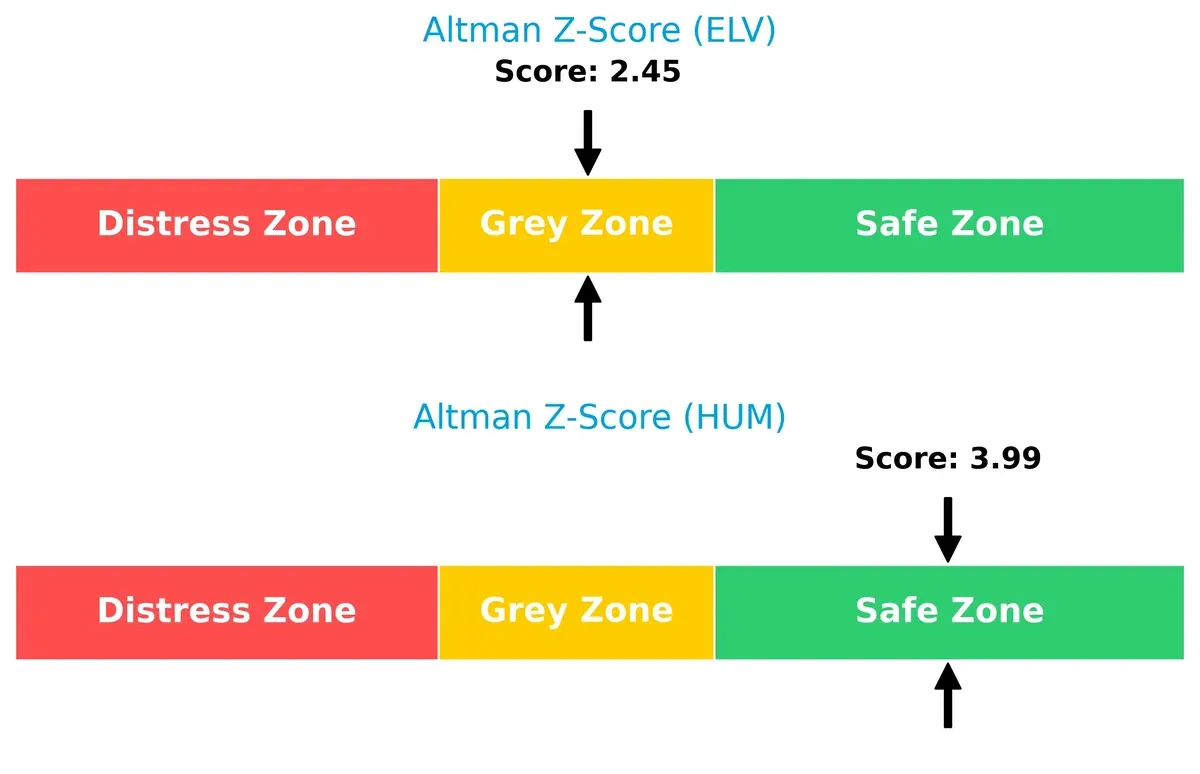
Bankruptcy Risk: Solvency Showdown
Humana’s Altman Z-Score of 3.99 places it firmly in the safe zone, signaling robust financial stability. Elevance Health’s 2.45 score is in the grey zone, indicating moderate bankruptcy risk in this cycle:
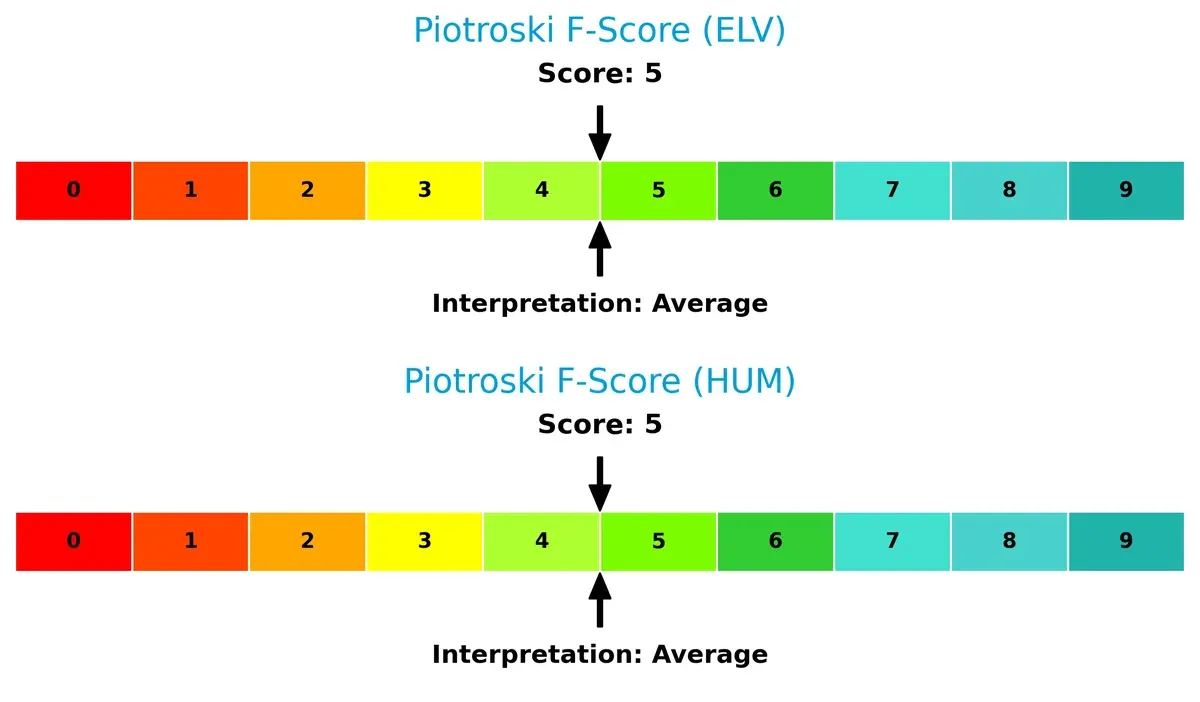
Financial Health: Quality of Operations
Both companies share an identical Piotroski F-Score of 5, suggesting average financial health. Neither displays peak operational quality, but also no immediate red flags in internal metrics:
How are the two companies positioned?
This section dissects the operational DNA of Elevance Health and Humana by comparing their revenue distribution by segment alongside their internal strengths and weaknesses. The goal is to confront their economic moats to determine which business model offers the most resilient and sustainable competitive advantage today.
Revenue Segmentation: The Strategic Mix
This visual comparison dissects how Elevance Health Inc. and Humana Inc. diversify their income streams and highlights their primary sector bets:
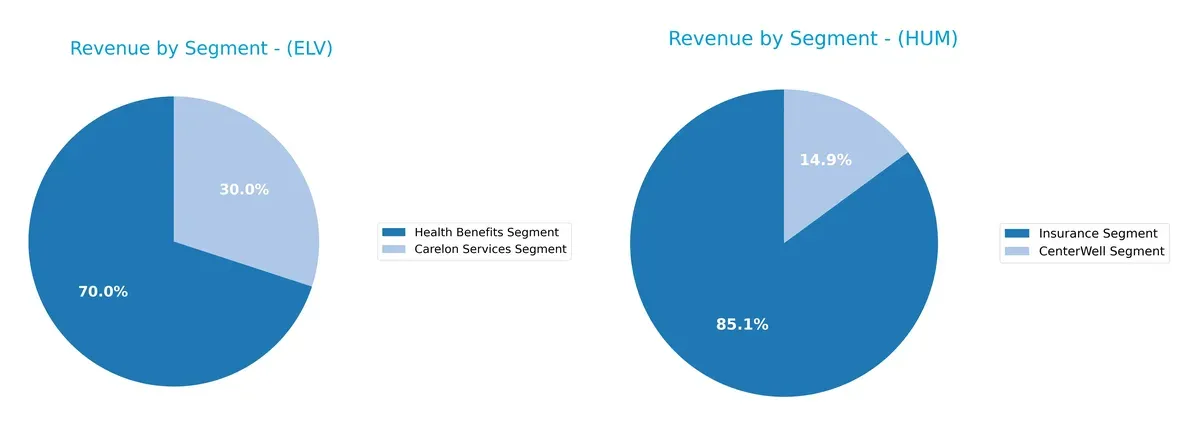
Elevance Health anchors revenue in its Health Benefits Segment with $167B, while Carelon Services adds $72B, showing a clear two-pronged focus. Humana relies heavily on its Insurance Segment at $114B, with CenterWell contributing $20B. Elevance’s mix indicates a balanced bet on insurance and care services, reducing concentration risk. Humana’s dominance in insurance suggests ecosystem lock-in but exposes it to regulatory shifts in that core segment.
Strengths and Weaknesses Comparison
This table compares the strengths and weaknesses of Elevance Health Inc. and Humana Inc.:
Elevance Health Inc. Strengths
- Favorable WACC and P/E indicate cost-effective capital and valuation
- Strong current and quick ratios show liquidity
- Debt-to-assets ratio and interest coverage are favorable
- High asset and fixed asset turnover demonstrate operational efficiency
Humana Inc. Strengths
- Favorable WACC supports capital cost control
- Strong asset and fixed asset turnover reflect efficiency
- Debt-to-assets ratio remains favorable
- Neutral interest coverage and dividend yield provide stability
Elevance Health Inc. Weaknesses
- Unfavorable net margin signals profitability pressure
- Neutral ROE and ROIC suggest moderate capital returns
- Neutral debt-to-equity ratio indicates balanced leverage
Humana Inc. Weaknesses
- Unfavorable net margin, ROE, and ROIC show weak profitability and returns
- Unfavorable current and quick ratios raise liquidity concerns
- Unfavorable P/E may indicate overvaluation risk
Elevance Health shows financial strength with favorable liquidity and capital cost metrics but faces profitability challenges. Humana struggles with profitability and liquidity, which could impact its strategic flexibility despite operational efficiency.
The Moat Duel: Analyzing Competitive Defensibility
A structural moat shields long-term profits from competitive erosion. Without it, market gains quickly vanish. Let’s explore how Elevance Health and Humana defend their turf:
Elevance Health Inc.: Scale and Integration Moat
Elevance leverages scale and integrated care solutions, generating stable gross margins near 26%. Its slightly declining ROIC signals pressure, but new digital health initiatives could reinforce its moat in 2026.
Humana Inc.: Specialized Service Moat
Humana’s moat relies on specialized Medicare and Medicaid services, contrasting Elevance’s broad scale. Despite steep margin declines and negative ROIC spread, focused expansions in home health could stabilize future returns.
Scale Dominance vs. Specialized Focus: The Moat Verdict
Elevance Health holds a wider moat through scale and diversified offerings, despite a slight profitability dip. Humana’s narrower, service-based moat faces tougher value creation challenges. Elevance is better positioned to defend market share long term.
Which stock offers better returns?
Over the past year, both Elevance Health Inc. and Humana Inc. experienced significant price declines with contrasting recent momentum, reflecting divergent trading dynamics and investor sentiment.
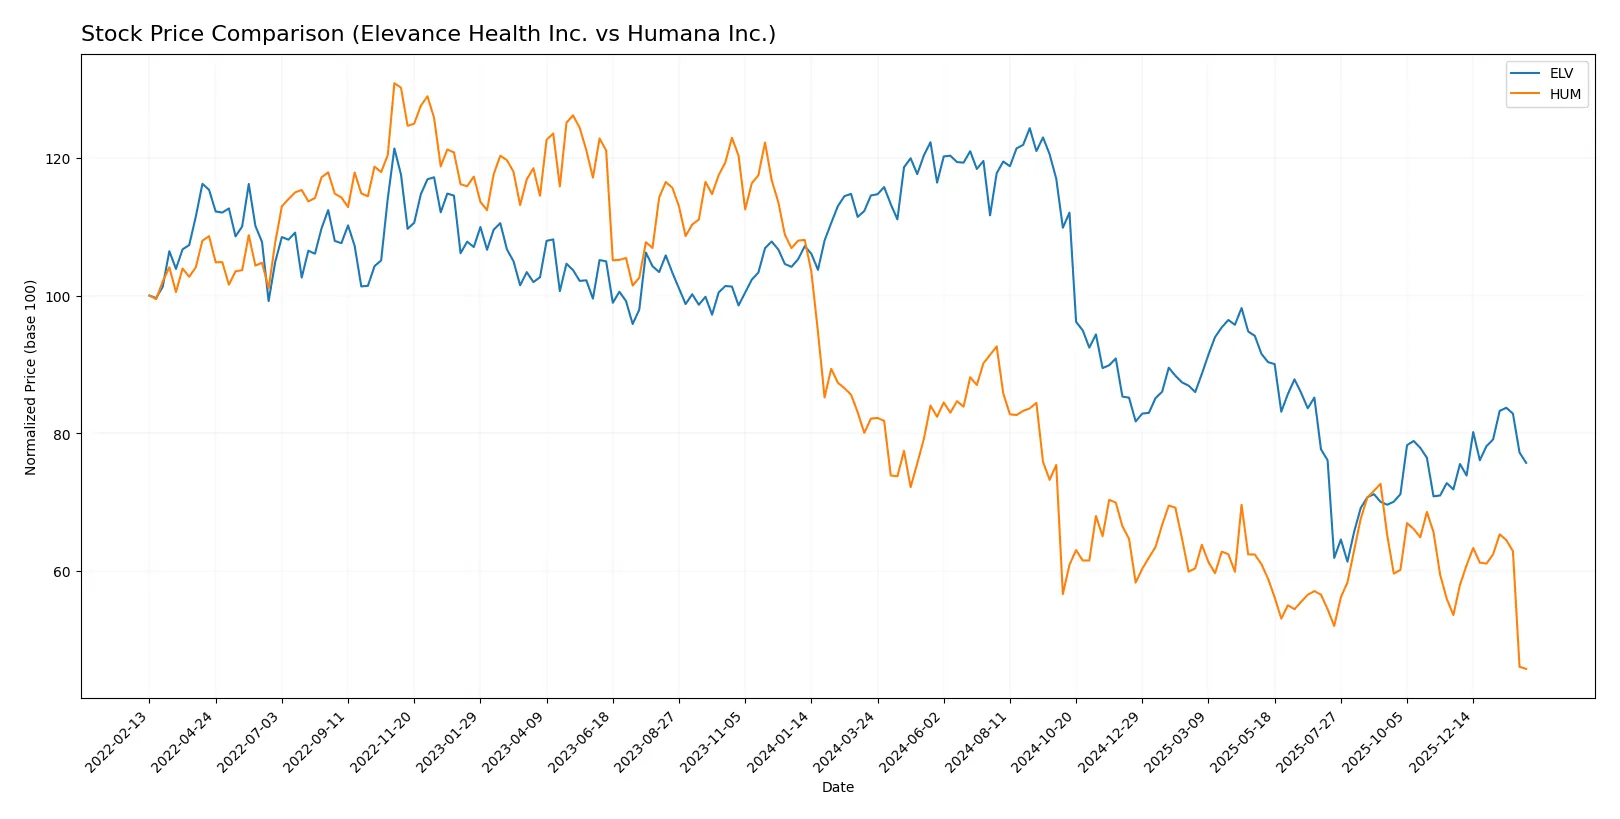
Trend Comparison
Elevance Health’s stock fell 33.93% over the past year, marking a bearish trend with accelerating decline and high volatility. It reached a high of 556.89 and a low of 274.66.
Humana’s stock dropped 44.29% in the same period, also bearish but with decelerating losses and lower volatility. Its price fluctuated between 392.63 at high and 193.94 at low.
Comparing recent trends, Elevance gained 5.36% showing bullish momentum, while Humana’s price declined further by 14.6%. Elevance delivered relatively stronger market performance overall.
Target Prices
Analysts present a broad but optimistic target price consensus for Elevance Health Inc. and Humana Inc.
| Company | Target Low | Target High | Consensus |
|---|---|---|---|
| Elevance Health Inc. | 332 | 425 | 387.14 |
| Humana Inc. | 174 | 345 | 277.5 |
Elevance Health’s consensus target of 387.14 sits about 14% above its current 339 price, signaling moderate upside. Humana’s consensus target of 277.5 implies a significant 43% potential gain from its current 194 price.

Don’t Let Luck Decide Your Entry Point
Optimize your entry points with our advanced ProRealTime indicators. You’ll get efficient buy signals with precise price targets for maximum performance. Start outperforming now!
How do institutions grade them?
The following tables summarize recent institutional grades for Elevance Health Inc. and Humana Inc.:
Elevance Health Inc. Grades
This table shows recent grades assigned to Elevance Health Inc. by key financial institutions.
| Grading Company | Action | New Grade | Date |
|---|---|---|---|
| JP Morgan | Maintain | Overweight | 2026-02-02 |
| Truist Securities | Maintain | Buy | 2026-02-02 |
| Barclays | Maintain | Overweight | 2026-01-30 |
| Wells Fargo | Maintain | Overweight | 2026-01-30 |
| Guggenheim | Maintain | Buy | 2026-01-29 |
| Guggenheim | Maintain | Buy | 2026-01-22 |
| Wolfe Research | Upgrade | Outperform | 2026-01-08 |
| Wells Fargo | Maintain | Overweight | 2026-01-07 |
| Barclays | Maintain | Overweight | 2026-01-05 |
| Deutsche Bank | Downgrade | Hold | 2025-12-19 |
Humana Inc. Grades
This table shows recent grades assigned to Humana Inc. by key financial institutions.
| Grading Company | Action | New Grade | Date |
|---|---|---|---|
| Morgan Stanley | Downgrade | Underweight | 2026-02-02 |
| Wells Fargo | Downgrade | Equal Weight | 2026-01-07 |
| Barclays | Maintain | Equal Weight | 2026-01-05 |
| Morgan Stanley | Maintain | Equal Weight | 2025-12-18 |
| Jefferies | Upgrade | Buy | 2025-12-05 |
| Barclays | Maintain | Equal Weight | 2025-11-25 |
| Truist Securities | Maintain | Hold | 2025-11-10 |
| Deutsche Bank | Maintain | Hold | 2025-11-07 |
| B of A Securities | Maintain | Neutral | 2025-10-10 |
| Mizuho | Maintain | Outperform | 2025-10-09 |
Which company has the best grades?
Elevance Health holds consistently positive grades, with multiple “Buy” and “Overweight” ratings and one upgrade to “Outperform.” Humana exhibits more mixed grades, including recent downgrades and several “Equal Weight” or “Hold” ratings. Investors may view Elevance Health’s stronger consensus as a sign of greater institutional confidence.
Risks specific to each company
The following categories identify critical pressure points and systemic threats facing Elevance Health Inc. and Humana Inc. in the 2026 market environment:
1. Market & Competition
Elevance Health Inc.
- Larger market cap of $75B supports competitive resilience.
- Beta 0.503 shows moderate market sensitivity.
Humana Inc.
- Smaller $23B cap limits scale against major rivals.
- Beta 0.441 reflects slightly lower volatility.
2. Capital Structure & Debt
Elevance Health Inc.
- Debt-to-assets 26.38% is manageable; interest coverage of 5.79x is strong.
- D/E ratio 0.73 is neutral but debt-to-equity score very unfavorable.
Humana Inc.
- Debt-to-assets 23.98% is similar; interest coverage 3.61x weaker, riskier.
- D/E 0.68 neutral but also very unfavorable debt-to-equity score.
3. Stock Volatility
Elevance Health Inc.
- Price range wider: $273.71–458.75, indicating higher price swings.
- Beta 0.503 suggests moderate price fluctuations.
Humana Inc.
- Narrower range $186–315.35, implying less price volatility.
- Beta 0.441 indicates slightly lower volatility.
4. Regulatory & Legal
Elevance Health Inc.
- Large scale and diverse plans increase regulatory scrutiny risk.
- Recent rebranding and expansion could draw compliance challenges.
Humana Inc.
- Heavy reliance on government contracts raises regulatory exposure.
- Medicaid and Medicare program contracts pose legal and policy risks.
5. Supply Chain & Operations
Elevance Health Inc.
- 104,200 employees suggest complex operational management.
- Asset turnover 1.64 and fixed asset turnover 42.46 indicate operational efficiency.
Humana Inc.
- Smaller workforce of 65,680 may streamline operations but limits scale.
- Higher asset turnover 2.53 and fixed asset turnover 39.56 show strong asset use.
6. ESG & Climate Transition
Elevance Health Inc.
- Larger footprint implies greater ESG risks and opportunities.
- No direct data on ESG; must monitor evolving healthcare sustainability standards.
Humana Inc.
- Smaller size may reduce ESG impact but limits transition resources.
- ESG risks tied to care delivery and supply chain sustainability.
7. Geopolitical Exposure
Elevance Health Inc.
- Primarily US-focused, limiting direct geopolitical risks.
- Healthcare policy shifts in the US remain key geopolitical risk.
Humana Inc.
- US concentration similarly limits geopolitical risk but policy shifts impact.
- Medicaid and TRICARE contracts sensitive to federal/state policy changes.
Which company shows a better risk-adjusted profile?
Elevance Health’s most impactful risk is regulatory complexity due to its scale and market presence. Humana’s greatest risk lies in its regulatory and legal exposure from government contracts. I see Elevance Health as having a better risk-adjusted profile, supported by stronger interest coverage and more favorable financial ratios. Humana’s weaker profitability ratios and lower current/quick ratios raise caution. Recent data showing Elevance’s higher interest coverage (5.79x vs. 3.61x) justifies concern over Humana’s debt servicing ability under adverse conditions.
Final Verdict: Which stock to choose?
Elevance Health’s superpower lies in its operational efficiency and solid cash flow generation, positioning it as a resilient cash machine. Its point of vigilance is the slightly declining return on invested capital, which signals potential challenges in sustaining value creation. This stock suits aggressive growth portfolios seeking steady cash generation with manageable risks.
Humana’s strategic moat stems from its recurring revenue base and asset turnover strength, providing a defensive edge amid market volatility. It exhibits a safer profile than Elevance, though its value destruction trend and weaker profitability warrant caution. It fits well in GARP portfolios prioritizing steady income with moderate growth prospects.
If you prioritize operational efficiency and cash flow resilience, Elevance outshines due to its superior capital turnover and favorable valuation metrics. However, if you seek defensive stability and recurring revenue safety, Humana offers better stability despite its challenges. Each presents distinct analytical scenarios for investors aligned with either growth or value-focused strategies.
Disclaimer: Investment carries a risk of loss of initial capital. The past performance is not a reliable indicator of future results. Be sure to understand risks before making an investment decision.
Go Further
I encourage you to read the complete analyses of Elevance Health Inc. and Humana Inc. to enhance your investment decisions: