Unity Software Inc. and Elastic N.V. are two dynamic players in the software application industry, each driving innovation in their respective niches—interactive 3D content creation and advanced search analytics. Both companies leverage cutting-edge technology to address evolving market demands, making them compelling choices for investors seeking growth in tech. In this article, I will analyze their strengths and risks to help you decide which company deserves a place in your portfolio.
Table of contents
Companies Overview
I will begin the comparison between Unity Software Inc. and Elastic N.V. by providing an overview of these two companies and their main differences.
Unity Software Inc. Overview
Unity Software Inc. creates and operates an interactive real-time 3D content platform. Its mission is to provide software solutions that enable the creation, running, and monetization of interactive real-time 2D and 3D content across multiple devices, including mobile phones, PCs, consoles, and AR/VR hardware. Founded in 2004 and based in San Francisco, Unity serves developers, artists, and designers worldwide through direct and indirect sales channels.
Elastic N.V. Overview
Elastic N.V. delivers search technology solutions designed for multi-cloud environments, focusing on its Elastic Stack software suite. The company’s platform ingests, stores, analyzes, and visualizes data from diverse sources, supporting use cases such as app search, logging, and performance monitoring. Founded in 2012 and headquartered in Mountain View, California, Elastic targets enterprises requiring flexible data search and analytics capabilities in both public and private clouds.
Key similarities and differences
Both companies operate in the Software – Application industry with platforms designed to enhance digital content and data management. Unity specializes in interactive 3D content creation and monetization, serving content creators and developers, while Elastic focuses on data ingestion, search, and analytics for multi-cloud environments. Unity’s offering centers on real-time content across devices, whereas Elastic provides a comprehensive data search and visualization stack for enterprise applications.
Income Statement Comparison
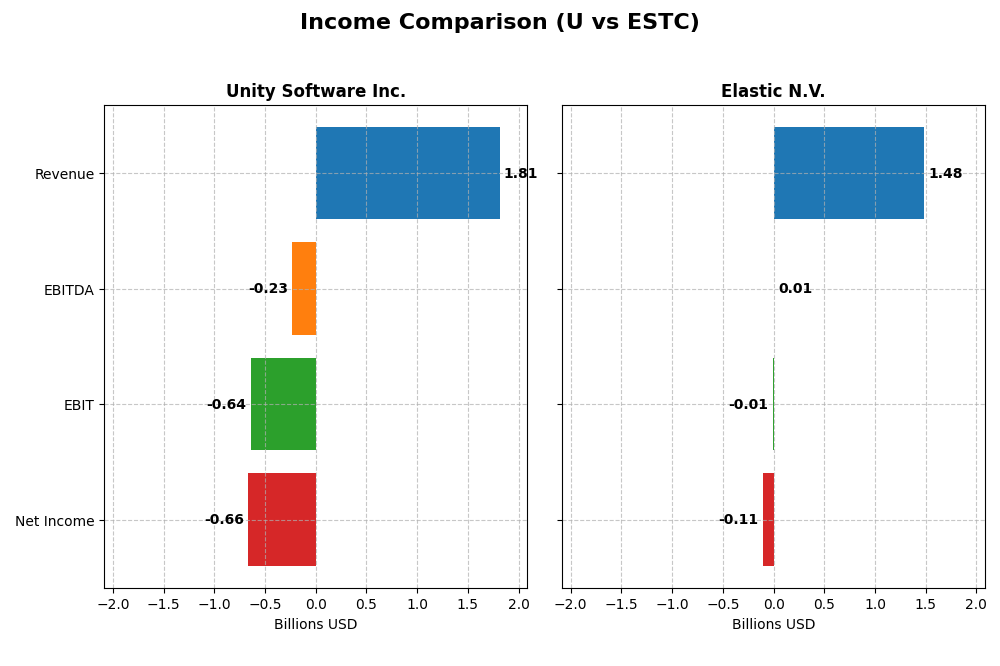
The table below presents the latest fiscal year income statement metrics for Unity Software Inc. and Elastic N.V., offering a snapshot of their financial performance.
| Metric | Unity Software Inc. (U) | Elastic N.V. (ESTC) |
|---|---|---|
| Market Cap | 17.5B | 7.5B |
| Revenue | 1.81B | 1.48B |
| EBITDA | -235M | 6.1M |
| EBIT | -644M | -6.3M |
| Net Income | -664M | -108M |
| EPS | -1.68 | -1.04 |
| Fiscal Year | 2024 | 2025 |
Income Statement Interpretations
Unity Software Inc.
Unity Software Inc.’s revenue grew significantly from 2020 to 2023 but declined by 17.1% in 2024 to $1.81B. Net income remained negative throughout, though the net loss narrowed from -$822M in 2023 to -$664M in 2024. Gross margin stayed strong at 73.48%, while EBIT and net margins remained negative but showed slight improvement, reflecting ongoing operating challenges despite revenue fluctuations.
Elastic N.V.
Elastic N.V. experienced consistent revenue growth, reaching $1.48B in 2025, a 17.04% increase from 2024. Despite this, net income swung from a positive $61.7M in 2024 to a loss of -$108.1M in 2025. Gross margin remained robust at 74.39%, but EBIT and net margins stayed negative. The company’s operating efficiency improved, with a near break-even EBIT margin of -0.42%, yet net margin deteriorated sharply in the latest year.
Which one has the stronger fundamentals?
Elastic N.V. presents stronger fundamentals with 71.43% favorable income statement metrics versus Unity’s 35.71%. Elastic shows sustained revenue growth and positive net income growth over the period, despite a recent net loss. Unity’s larger net losses and declining revenue in the latest year weigh against it, despite solid gross margins. Elastic’s more balanced margins and consistent growth suggest better income statement health.
Financial Ratios Comparison
The table below presents a side-by-side comparison of key financial ratios for Unity Software Inc. (U) and Elastic N.V. (ESTC) based on their most recent fiscal year data, facilitating a clear view of their financial health and performance metrics.
| Ratios | Unity Software Inc. (2024) | Elastic N.V. (2025) |
|---|---|---|
| ROE | -20.8% | -11.7% |
| ROIC | -12.8% | -3.4% |
| P/E | -13.4 | -82.7 |
| P/B | 2.79 | 9.64 |
| Current Ratio | 2.50 | 1.92 |
| Quick Ratio | 2.50 | 1.92 |
| D/E | 0.74 | 0.64 |
| Debt-to-Assets | 34.9% | 22.9% |
| Interest Coverage | -32.1 | -2.17 |
| Asset Turnover | 0.27 | 0.57 |
| Fixed Asset Turnover | 18.35 | 51.28 |
| Payout ratio | 0 | 0 |
| Dividend yield | 0 | 0 |
Interpretation of the Ratios
Unity Software Inc.
Unity Software shows several unfavorable ratios, including a net margin of -36.63%, ROE of -20.81%, and ROIC of -12.78%, indicating weak profitability and efficiency. Its current and quick ratios at 2.5 are favorable, reflecting good short-term liquidity. The company does not pay dividends, likely due to ongoing reinvestment in R&D and growth, supported by no dividend yield and no share buybacks.
Elastic N.V.
Elastic exhibits mixed ratios with a less negative net margin at -7.29% and ROE at -11.66%, still unfavorable but somewhat better than Unity. The weighted average cost of capital (WACC) is favorable at 7.83%, and liquidity ratios near 1.92 are sound. Like Unity, Elastic does not pay dividends, presumably prioritizing reinvestment and growth over distributions, consistent with zero dividend yield and no buybacks.
Which one has the best ratios?
Elastic N.V. presents a more balanced profile with a higher proportion of favorable ratios (42.86%) versus unfavorable (42.86%), compared to Unity’s predominantly unfavorable (50%) and fewer favorable (28.57%). Elastic’s stronger liquidity, lower debt burden, and better asset turnover suggest a slightly stronger ratio set than Unity, which faces deeper profitability and coverage challenges.
Strategic Positioning
This section compares the strategic positioning of Unity Software Inc. and Elastic N.V. in terms of Market position, Key segments, and Exposure to technological disruption:
Unity Software Inc.
- Market position and competitive pressure
- Key segments and business drivers
- Exposure to technological disruption
Elastic N.V.
- MarketCap 17.5B, high beta 2.05 indicates higher volatility.
- Revenue driven by Create Solutions and Operate Solutions segments.
- Operates in interactive real-time 3D content for diverse platforms.
Unity Software Inc. vs Elastic N.V. Positioning
Unity shows a diversified approach with two major revenue segments serving interactive content creation and operation. Elastic concentrates on cloud-based search and analytics software with subscription dominance. Unity’s market size and volatility are higher, while Elastic targets steady growth through cloud technologies.
Which has the best competitive advantage?
Both companies currently shed value as ROIC is below WACC. Unity’s ROIC trend declines, indicating worsening profitability, while Elastic’s ROIC trend is growing, suggesting improving efficiency despite a slightly unfavorable moat.
Stock Comparison
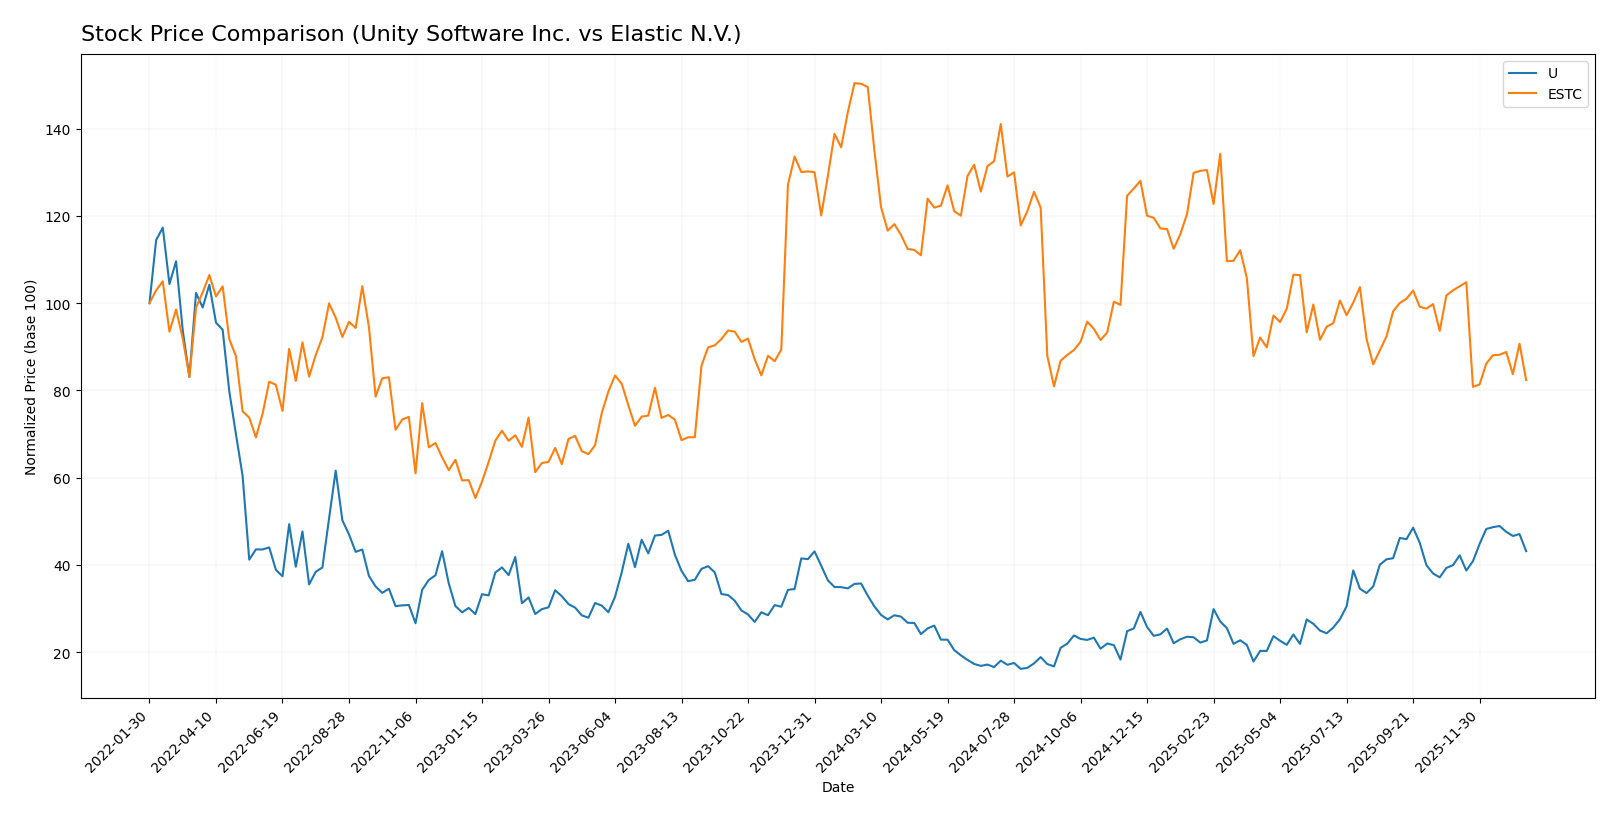
The stock prices of Unity Software Inc. and Elastic N.V. have shown contrasting dynamics over the past 12 months, with Unity experiencing a strong upward momentum while Elastic faced a significant decline amid changing trading volumes.
Trend Analysis
Unity Software Inc. displayed a bullish trend with a 31.0% price increase over the past year, accompanied by acceleration and a standard deviation of 9.04, reaching a high of 46.42 and a low of 15.32.
Elastic N.V. experienced a bearish trend marked by a 44.93% price decline over the same period, with deceleration and higher volatility, reflected by a standard deviation of 14.08, peaking at 129.62 and bottoming at 70.04.
Comparing the two, Unity Software Inc. delivered the highest market performance with a significant positive return, while Elastic N.V. showed a strong negative price movement throughout the last year.
Target Prices
Analysts provide a clear target consensus that suggests potential upside for both Unity Software Inc. and Elastic N.V.
| Company | Target High | Target Low | Consensus |
|---|---|---|---|
| Unity Software Inc. | 60 | 39 | 50.98 |
| Elastic N.V. | 134 | 76 | 108 |
Overall, Unity’s consensus target at 50.98 exceeds its current price of 40.95, indicating moderate growth expectations. Elastic’s 108 consensus target is significantly above its current 71.38 price, reflecting stronger bullish sentiment from analysts.
Analyst Opinions Comparison
This section compares analysts’ ratings and grades for Unity Software Inc. and Elastic N.V.:
Rating Comparison
Unity Software Inc. Rating
- Rating: D+ with a very favorable status
- Discounted Cash Flow Score: 1, indicating very unfavorable valuation
- ROE Score: 1, reflecting very unfavorable profitability
- ROA Score: 1, reflecting very unfavorable asset efficiency
- Debt To Equity Score: 1, indicating very unfavorable financial stability
- Overall Score: 1, reflecting very unfavorable overall financial health
Elastic N.V. Rating
- Rating: C- with a very favorable status
- Discounted Cash Flow Score: 3, indicating moderate valuation
- ROE Score: 1, reflecting very unfavorable profitability
- ROA Score: 1, reflecting very unfavorable asset efficiency
- Debt To Equity Score: 1, indicating very unfavorable financial stability
- Overall Score: 1, reflecting very unfavorable overall financial health
Which one is the best rated?
Based strictly on the data, Elastic N.V. holds a higher rating of C- compared to Unity’s D+, largely due to a better discounted cash flow score. However, both share equally low scores in profitability, asset efficiency, debt management, and overall financial health.
Scores Comparison
Here is a comparison of the Altman Z-Score and Piotroski Score for Unity Software Inc. and Elastic N.V.:
Unity Software Inc. Scores
- Altman Z-Score: 2.93, placing the company in the grey zone with moderate bankruptcy risk.
- Piotroski Score: 4, reflecting average financial strength.
Elastic N.V. Scores
- Altman Z-Score: 3.51, indicating a safe zone with low bankruptcy risk.
- Piotroski Score: 4, reflecting average financial strength.
Which company has the best scores?
Elastic N.V. has a higher Altman Z-Score, placing it in the safe zone, while Unity Software is in the grey zone. Both companies have the same Piotroski Score of 4, indicating average financial health.
Grades Comparison
Here is a detailed comparison of the latest grades assigned to Unity Software Inc. and Elastic N.V.:
Unity Software Inc. Grades
The table below shows recent grades from major financial institutions for Unity Software Inc.:
| Grading Company | Action | New Grade | Date |
|---|---|---|---|
| Morgan Stanley | Maintain | Overweight | 2026-01-13 |
| Goldman Sachs | Maintain | Neutral | 2026-01-13 |
| Wells Fargo | Maintain | Overweight | 2026-01-08 |
| Jefferies | Maintain | Buy | 2026-01-05 |
| Piper Sandler | Upgrade | Overweight | 2025-12-11 |
| BTIG | Upgrade | Buy | 2025-12-11 |
| Wells Fargo | Upgrade | Overweight | 2025-12-05 |
| Arete Research | Upgrade | Buy | 2025-12-01 |
| Citigroup | Maintain | Buy | 2025-11-11 |
| Wells Fargo | Maintain | Equal Weight | 2025-11-07 |
Unity Software Inc. shows a generally positive trend with multiple upgrades and mostly Buy or Overweight grades from well-known firms.
Elastic N.V. Grades
The table below presents recent grades assigned to Elastic N.V. by recognized financial analysts:
| Grading Company | Action | New Grade | Date |
|---|---|---|---|
| Barclays | Maintain | Overweight | 2026-01-12 |
| RBC Capital | Maintain | Outperform | 2026-01-05 |
| Jefferies | Maintain | Buy | 2026-01-05 |
| Citigroup | Maintain | Buy | 2025-11-24 |
| Wedbush | Maintain | Outperform | 2025-11-21 |
| B of A Securities | Maintain | Neutral | 2025-11-21 |
| Guggenheim | Maintain | Buy | 2025-11-21 |
| Wells Fargo | Maintain | Equal Weight | 2025-11-21 |
| RBC Capital | Maintain | Outperform | 2025-11-21 |
| Canaccord Genuity | Maintain | Buy | 2025-11-21 |
Elastic N.V.’s grades remain stable with a strong presence of Buy and Outperform ratings, showing consistent analyst confidence.
Which company has the best grades?
Both Unity Software Inc. and Elastic N.V. hold predominantly Buy or Overweight consensus grades, but Elastic N.V. has more Outperform ratings, suggesting slightly stronger analyst optimism, potentially influencing investors toward expecting steadier performance.
Strengths and Weaknesses
Below is a comparison of key strengths and weaknesses for Unity Software Inc. (U) and Elastic N.V. (ESTC) based on their recent financial and operational data.
| Criterion | Unity Software Inc. (U) | Elastic N.V. (ESTC) |
|---|---|---|
| Diversification | Moderate: revenues split between Create Solutions (~$614M) and Operate Solutions (~$1.2B), with some strategic partnerships | Moderate: mostly Subscription (~$1.38B) with smaller Professional Services (~$99M) |
| Profitability | Weak: negative net margin (-36.6%), negative ROIC (-12.8%), value destroying with declining profitability | Weak but improving: negative net margin (-7.3%), negative ROIC (-3.5%), value destroying but with growing ROIC |
| Innovation | Strong fixed asset turnover (18.35), indicating efficient use of assets in product creation | Very strong fixed asset turnover (51.28), reflecting efficient asset use, innovation focus |
| Global presence | Solid current and quick ratios (2.5 each), reflecting good liquidity and operational stability | Good liquidity with current and quick ratios of 1.92, lower than Unity but still healthy |
| Market Share | Challenged: declining ROIC and unfavorable interest coverage (-27.3) suggest operational and competitive pressures | Improving: growing ROIC and neutral asset turnover (0.57) imply gaining competitive ground |
Key takeaways: Unity Software shows strong asset efficiency but suffers from deteriorating profitability and value destruction, posing risks for investors. Elastic N.V. is also unprofitable but demonstrates improving profitability trends and operational efficiency, suggesting cautious optimism. Both require careful risk management before investment.
Risk Analysis
Below is a comparison of key risk factors for Unity Software Inc. and Elastic N.V. based on their most recent financial and operational data.
| Metric | Unity Software Inc. (U) | Elastic N.V. (ESTC) |
|---|---|---|
| Market Risk | High beta (2.05) indicates higher volatility and sensitivity to market fluctuations. | Moderate beta (0.93), less volatile but still subject to market changes. |
| Debt level | Debt-to-equity ratio: 0.74 (neutral), debt-to-assets 34.9% (neutral). Moderate leverage. | Debt-to-equity ratio: 0.64 (neutral), debt-to-assets 23% (favorable). Lower leverage risk. |
| Regulatory Risk | Operating globally with exposure to data privacy and software regulations in multiple countries. | Similar multi-cloud environment exposure; regulatory compliance in data security is critical. |
| Operational Risk | Negative net margin (-36.6%) and poor profitability ratios suggest operational inefficiencies. | Negative net margin (-7.3%) but better operating efficiency; still loss-making. |
| Environmental Risk | Limited direct environmental impact; main risk relates to data center energy use and sustainability policies. | Similar environmental footprint; growing focus on energy-efficient cloud operations. |
| Geopolitical Risk | Exposure in China, Europe, and US markets; geopolitical tensions could disrupt operations or sales. | Also exposed to global markets; potential risks from US-China tech tensions and EU regulations. |
The most significant risks are market volatility for Unity due to its high beta and operational losses for both companies, with Unity showing deeper profitability challenges. Debt levels are moderate but manageable. Regulatory risks remain relevant given their global software service models.
Which Stock to Choose?
Unity Software Inc. shows a declining income trend with a 17.1% revenue decrease in 2024, unfavorable profitability ratios including a -36.63% net margin, and a very unfavorable overall rating despite a favorable current ratio and PE ratio. Its ROIC is well below WACC, signaling value destruction.
Elastic N.V. presents favorable income growth with a 17.04% revenue increase in 2025 and mostly positive income statement trends. Its financial ratios are neutral to favorable overall, including a favorable WACC, though profitability remains negative. The rating is very favorable but with some weaknesses in valuation metrics.
For risk-tolerant investors seeking growth with improving profitability, Elastic N.V. may appear more attractive due to its favorable income growth and neutral financial ratios. Conversely, those preferring caution might see Unity Software’s high current ratio but note its value destruction and unfavorable ratings. The choice could depend on the investor’s risk appetite and focus on either growth potential or financial stability.
Disclaimer: Investment carries a risk of loss of initial capital. The past performance is not a reliable indicator of future results. Be sure to understand risks before making an investment decision.
Go Further
I encourage you to read the complete analyses of Unity Software Inc. and Elastic N.V. to enhance your investment decisions: