In today’s fast-evolving tech landscape, Uber Technologies, Inc. and Elastic N.V. stand out as dynamic players in the software application industry. While Uber revolutionizes mobility and delivery services across global markets, Elastic excels in data search and analytics solutions for cloud environments. This comparison explores their innovation strategies and market positions to help you decide which company offers the most promising investment potential in 2026. Let’s find out which one deserves a spot in your portfolio.
Table of contents
Companies Overview
I will begin the comparison between Uber Technologies, Inc. and Elastic N.V. by providing an overview of these two companies and their main differences.
Uber Technologies, Inc. Overview
Uber Technologies, Inc. operates proprietary technology applications globally, connecting consumers with independent providers for ride-sharing, delivery, and freight services. The company’s three segments—Mobility, Delivery, and Freight—offer diverse transportation and logistics solutions. Headquartered in San Francisco and founded in 2009, Uber positions itself as a leader in the software application industry with a market cap of $176.3B.
Elastic N.V. Overview
Elastic N.V. delivers search technology solutions for multi-cloud environments, centered on its Elastic Stack software products. These include Elasticsearch, Kibana, Beats, Elastic Agent, and Logstash, supporting data ingestion, search, analysis, and visualization. Founded in 2012 and based in Mountain View, Elastic serves enterprise needs in logging, metrics, and application performance management, with a market cap of $7.5B.
Key similarities and differences
Both companies operate in the software application sector and trade on the NYSE, but Uber focuses on consumer-facing mobility and delivery services, while Elastic targets enterprise software solutions for data search and analytics. Uber’s business model integrates various transportation modes and logistics, contrasting with Elastic’s emphasis on cloud-based software platforms for data management. Uber is significantly larger in market capitalization and employee count than Elastic.
Income Statement Comparison
Below is a comparison of the key income statement metrics for Uber Technologies, Inc. and Elastic N.V. for their most recent fiscal years, providing an overview of their financial performance.
| Metric | Uber Technologies, Inc. | Elastic N.V. |
|---|---|---|
| Market Cap | 176.3B | 7.52B |
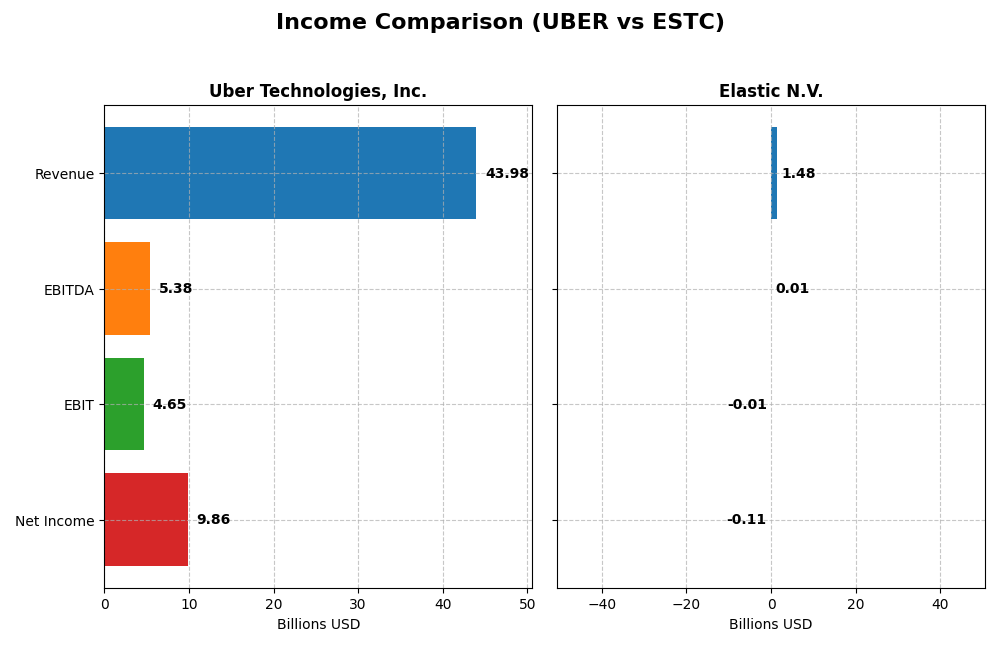
| Revenue | 43.98B | 1.48B |
| EBITDA | 5.39B | 6.05M |
| EBIT | 4.65B | -6.26M |
| Net Income | 9.86B | -108.11M |
| EPS | 4.71 | -1.04 |
| Fiscal Year | 2024 | 2025 |
Income Statement Interpretations
Uber Technologies, Inc.
Uber showed strong revenue growth from 2020 to 2024, reaching $43.98B in 2024, with net income improving dramatically to $9.81B. Margins have steadily improved, with a gross margin of 39.4% and a net margin of 22.41% in 2024. The latest year exhibited robust growth in revenue and net income, alongside a significant increase in earnings per share, reflecting enhanced profitability and operational efficiency.
Elastic N.V.
Elastic’s revenue grew steadily from $608M in 2021 to $1.48B in 2025, with net income fluctuating and turning negative again in 2025 at -$108M. The company maintains a high gross margin of 74.39%, but EBIT and net margins remain negative, indicating ongoing operating losses. Despite favorable revenue and gross profit growth, the recent year saw deteriorating net margin and earnings per share, signaling challenges in controlling costs or achieving profitability.
Which one has the stronger fundamentals?
Uber demonstrates stronger fundamentals, with consistent and significant improvements in revenue, net income, and margins over the period. Its profitability and margin expansion contrast with Elastic’s persistent operating losses and negative net margins, despite its high gross margin and revenue growth. Uber’s financial metrics suggest a more favorable income statement trajectory compared to Elastic.
Financial Ratios Comparison
Below is a comparison of key financial ratios for Uber Technologies, Inc. and Elastic N.V. based on the most recent fiscal year data available.
| Ratios | Uber Technologies, Inc. (2024) | Elastic N.V. (2025) |
|---|---|---|
| ROE | 45.7% | -11.7% |
| ROIC | 6.8% | -3.4% |
| P/E | 12.8 | -82.7 |
| P/B | 5.86 | 9.64 |
| Current Ratio | 1.07 | 1.92 |
| Quick Ratio | 1.07 | 1.92 |
| D/E | 0.53 | 0.64 |
| Debt-to-Assets | 22.3% | 22.9% |
| Interest Coverage | 5.35 | -2.17 |
| Asset Turnover | 0.86 | 0.57 |
| Fixed Asset Turnover | 14.1 | 51.3 |
| Payout Ratio | 0% | 0% |
| Dividend Yield | 0% | 0% |
Interpretation of the Ratios
Uber Technologies, Inc.
Uber presents a mixed ratio profile with strengths in net margin (22.41%), return on equity (45.72%), and interest coverage (8.89), indicating solid profitability and debt servicing capacity. Some concerns arise from an elevated price-to-book ratio (5.86) and a neutral return on invested capital (6.79%). The company does not pay dividends, reflecting a reinvestment strategy likely focused on growth and operational expansion.
Elastic N.V.
Elastic shows weaker profitability ratios, including a negative net margin (-7.29%) and return on equity (-11.66%), highlighting operational challenges. The company’s favorable current (1.92) and quick ratios (1.92) suggest good liquidity, but the negative interest coverage (-0.25) signals difficulties in covering interest expenses. Like Uber, Elastic does not pay dividends, probably prioritizing reinvestment and R&D.
Which one has the best ratios?
Uber’s ratios are generally more favorable, particularly with strong profitability and solvency metrics, despite some valuation concerns. Elastic’s ratios reflect profitability struggles and interest coverage issues, though liquidity remains solid. Overall, Uber displays a slightly more positive ratio outlook compared to Elastic’s neutral evaluation.
Strategic Positioning
This section compares the strategic positioning of Uber Technologies, Inc. and Elastic N.V., including market position, key segments, and exposure to technological disruption:
Uber Technologies, Inc.
- Leading global platform in mobility, delivery, and freight services facing intense competition.
- Revenue driven by Mobility, Delivery, and Freight segments with diverse service offerings.
- Faces disruption from evolving transportation technologies and logistics innovations.
Elastic N.V.
- Focused search technology provider with growing presence in multi-cloud environments.
- Revenue mainly from subscription and professional services for Elastic Stack products.
- Subject to technological shifts in cloud computing and data analytics platforms.
Uber Technologies, Inc. vs Elastic N.V. Positioning
Uber operates a diversified platform across mobility, delivery, and freight, leveraging scale but facing competitive pressure. Elastic concentrates on software search solutions in cloud environments, emphasizing specialized technology with narrower market scope.
Which has the best competitive advantage?
Both companies exhibit a slightly unfavorable economic moat due to ROIC below WACC, yet both show improving profitability trends, indicating increasing efficiency but ongoing challenges in value creation.
Stock Comparison
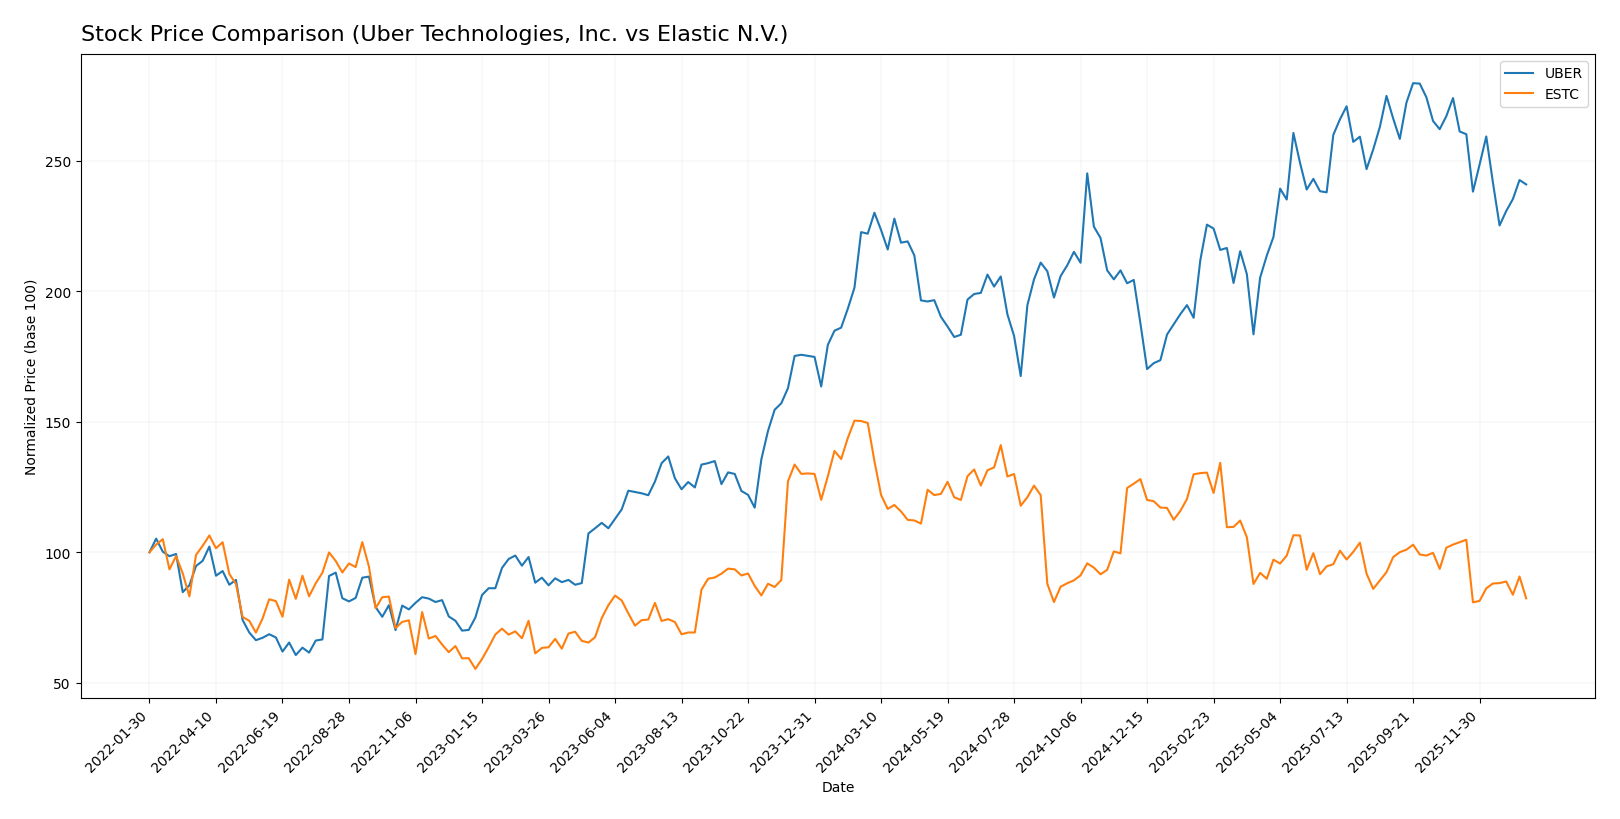
The past year showed divergent stock performances for Uber Technologies, Inc. and Elastic N.V., with Uber exhibiting a bullish but decelerating trend and Elastic facing a pronounced bearish trend amid contrasting volume dynamics.
Trend Analysis
Uber Technologies, Inc. experienced a bullish trend over the past 12 months with an 8.5% price increase, though this growth showed deceleration; recent months revealed a -12.07% decline and seller dominance in volume.
Elastic N.V. displayed a bearish trend with a -44.93% price drop over the last year and further deceleration; recent trading saw a sharper -20.0% fall paired with strongly buyer-dominant volume behavior.
Comparing both stocks, Uber delivered the highest market performance over the year despite recent weakness, whereas Elastic’s trend remains significantly negative with larger price declines.
Target Prices
Analyst consensus target prices suggest a promising upside potential for both Uber Technologies, Inc. and Elastic N.V.
| Company | Target High | Target Low | Consensus |
|---|---|---|---|
| Uber Technologies, Inc. | 140 | 73 | 111.26 |
| Elastic N.V. | 134 | 76 | 108 |
For Uber, the consensus target price of 111.26 USD is significantly above the current price of 84.85 USD, indicating optimistic analyst expectations. Elastic’s target consensus of 108 USD also exceeds its trading price of 71.38 USD, suggesting potential appreciation according to market experts.
Analyst Opinions Comparison
This section compares analysts’ ratings and grades for Uber Technologies, Inc. and Elastic N.V.:
Rating Comparison
Uber Rating
- Rating: B, evaluated as Very Favorable.
- Discounted Cash Flow Score: 1, considered Very Unfavorable.
- ROE Score: 5, rated Very Favorable for profit generation efficiency.
- ROA Score: 5, rated Very Favorable for effective asset utilization.
- Debt To Equity Score: 2, assessed as Moderate financial risk.
- Overall Score: 3, classified as Moderate.
Elastic Rating
- Rating: C-, evaluated as Very Favorable.
- Discounted Cash Flow Score: 3, considered Moderate.
- ROE Score: 1, rated Very Unfavorable for profit generation efficiency.
- ROA Score: 1, rated Very Unfavorable for effective asset utilization.
- Debt To Equity Score: 1, assessed as Very Unfavorable financial risk.
- Overall Score: 1, classified as Very Unfavorable.
Which one is the best rated?
Based strictly on provided data, Uber holds a stronger overall rating (B versus C-) and superior scores in ROE, ROA, and overall financial health, despite a low discounted cash flow score. Elastic shows weaker performance across most metrics.
Scores Comparison
Here is a comparison of the Altman Z-Score and Piotroski Score for Uber and Elastic:
Uber Scores
- Altman Z-Score: 4.44, in safe zone indicating low bankruptcy risk.
- Piotroski Score: 6, indicating average financial strength.
Elastic Scores
- Altman Z-Score: 3.51, in safe zone indicating low bankruptcy risk.
- Piotroski Score: 4, indicating average financial strength.
Which company has the best scores?
Uber has a higher Altman Z-Score (4.44 vs. 3.51) and a higher Piotroski Score (6 vs. 4) than Elastic, reflecting relatively stronger financial stability and health based on these metrics.
Grades Comparison
Here is a detailed comparison of recent grades assigned to Uber Technologies, Inc. and Elastic N.V.:
Uber Technologies, Inc. Grades
This table shows recent grades from reputable grading companies for Uber Technologies, Inc.:
| Grading Company | Action | New Grade | Date |
|---|---|---|---|
| BTIG | Maintain | Buy | 2026-01-15 |
| Wells Fargo | Maintain | Overweight | 2026-01-08 |
| Cantor Fitzgerald | Maintain | Overweight | 2026-01-08 |
| Wolfe Research | Maintain | Outperform | 2026-01-06 |
| Wedbush | Maintain | Neutral | 2025-12-19 |
| Morgan Stanley | Maintain | Overweight | 2025-12-08 |
| Arete Research | Upgrade | Buy | 2025-12-03 |
| Wells Fargo | Maintain | Overweight | 2025-11-05 |
| Guggenheim | Maintain | Buy | 2025-11-05 |
| DA Davidson | Maintain | Buy | 2025-11-05 |
Uber’s recent grades predominantly highlight positive sentiment with a consensus around Buy and Overweight ratings, showing more upgrades than downgrades and no sell ratings.
Elastic N.V. Grades
This table shows recent grades from reputable grading companies for Elastic N.V.:
| Grading Company | Action | New Grade | Date |
|---|---|---|---|
| Barclays | Maintain | Overweight | 2026-01-12 |
| RBC Capital | Maintain | Outperform | 2026-01-05 |
| Jefferies | Maintain | Buy | 2026-01-05 |
| Citigroup | Maintain | Buy | 2025-11-24 |
| Wedbush | Maintain | Outperform | 2025-11-21 |
| B of A Securities | Maintain | Neutral | 2025-11-21 |
| Guggenheim | Maintain | Buy | 2025-11-21 |
| Wells Fargo | Maintain | Equal Weight | 2025-11-21 |
| RBC Capital | Maintain | Outperform | 2025-11-21 |
| Canaccord Genuity | Maintain | Buy | 2025-11-21 |
Elastic’s grades also trend positively, with multiple Buy and Outperform ratings and no sell recommendations, indicating generally favorable analyst views.
Which company has the best grades?
Both Uber Technologies, Inc. and Elastic N.V. have predominantly Buy and Outperform ratings with no sell grades. Uber shows a higher volume of Buy ratings, while Elastic features several Outperform ratings alongside Buy. Investors may interpret these strong grades as signals of growth potential and market confidence in both companies, but nuances in grade distribution suggest slightly stronger enthusiasm for Uber.
Strengths and Weaknesses
Below is a comparison of key strengths and weaknesses for Uber Technologies, Inc. and Elastic N.V. based on the latest financial and operational data.
| Criterion | Uber Technologies, Inc. (UBER) | Elastic N.V. (ESTC) |
|---|---|---|
| Diversification | Highly diversified revenue streams: Mobility $25B, Delivery $13.75B, Freight $5.14B (2024) | Revenue mainly from Subscription $1.38B and Professional Services $99M (2025) |
| Profitability | Strong net margin at 22.41%, ROE 45.72%, ROIC neutral at 6.79% | Negative net margin (-7.29%), negative ROE (-11.66%) and ROIC (-3.45%) |
| Innovation | Growing ROIC trend (+139%), despite current value shedding, strong asset turnover (14.14) | Growing ROIC trend (+86%) but overall value destroying, very high fixed asset turnover (51.28) |
| Global presence | Extensive global footprint supported by Mobility and Delivery segments | Smaller scale with focus on subscription software, moderate global reach |
| Market Share | Large market share in ride-sharing and food delivery sectors | Niche player in search and data analytics software markets |
Key takeaways: Uber shows strong diversification and improving profitability, though still slightly value destructive. Elastic faces profitability challenges despite growth in capital efficiency, indicating a need for cautious risk management.
Risk Analysis
Below is a comparative table summarizing key risks for Uber Technologies, Inc. and Elastic N.V. as of the most recent fiscal years:
| Metric | Uber Technologies, Inc. | Elastic N.V. |
|---|---|---|
| Market Risk | Beta 1.20 indicates moderate volatility with exposure to competitive ride-sharing and delivery markets globally. | Beta 0.93 suggests slightly lower volatility but exposed to tech sector cyclicality and cloud services demand. |
| Debt level | Debt-to-assets 22.3%, debt/equity 0.53; moderate leverage with favorable interest coverage (8.9x). | Debt-to-assets 22.95%, debt/equity 0.64; moderate leverage but negative interest coverage (-0.25x) signals risk in servicing debt. |
| Regulatory Risk | High, due to ongoing scrutiny in multiple countries over labor classification and operational licenses. | Moderate, primarily data privacy regulations and compliance in multi-cloud environments. |
| Operational Risk | Extensive global operations in Mobility, Delivery, and Freight increase complexity; reliance on independent providers. | Dependent on continuous innovation and platform stability; risks from competition and technology shifts. |
| Environmental Risk | Moderate, with growing pressure to reduce carbon footprint in transportation and delivery services. | Low to moderate, given software focus but with some impact from data center energy use. |
| Geopolitical Risk | Moderate, due to international presence in politically sensitive regions, affecting operations and regulations. | Low to moderate, mainly market access issues and regulatory changes in cloud infrastructure. |
Synthesis: Uber faces the most impactful risks from regulatory challenges and operational complexity across diverse markets, combined with moderate financial leverage but strong coverage ratios. Elastic shows financial stress with negative profitability and poor interest coverage, increasing bankruptcy risk despite a safe Altman Z-score, while operational and market risks relate to rapid technological change and competition. Investors should weigh Uber’s regulatory and geopolitical exposures against Elastic’s financial vulnerability and market dynamics.
Which Stock to Choose?
Uber Technologies, Inc. (UBER) exhibits a favorable income evolution with 17.96% revenue growth in 2024 and strong profitability metrics, including a 22.41% net margin and a 45.72% ROE. Its debt level is moderate, supported by a net debt to EBITDA of 0.93, and the rating stands very favorable at B.
Elastic N.V. (ESTC) shows positive revenue growth of 17.04% in 2025 but faces challenges in profitability, with a -7.29% net margin and negative returns on equity and invested capital. Debt ratios are acceptable, and despite a very favorable rating at C-, its overall financial ratios evaluation is neutral.
For investors with a risk-tolerant profile seeking growth opportunities, UBER’s consistent profitability and improving income statement might appear more favorable. Conversely, risk-averse investors or those focusing on companies with potential turnaround stories could consider ESTC’s improving income growth despite current profitability challenges.
Disclaimer: Investment carries a risk of loss of initial capital. The past performance is not a reliable indicator of future results. Be sure to understand risks before making an investment decision.
Go Further
I encourage you to read the complete analyses of Uber Technologies, Inc. and Elastic N.V. to enhance your investment decisions: