Home > Comparison > Technology > ESTC vs MSTR
The strategic rivalry between Elastic N.V. and Strategy Inc defines the current trajectory of the technology sector. Elastic operates as a cloud-centric software innovator focused on data search and analytics, while Strategy Inc combines bitcoin treasury management with AI-driven enterprise software. This head-to-head contrasts a specialized platform builder against a diversified digital asset and analytics provider. This analysis aims to identify which company offers superior risk-adjusted potential for a diversified technology portfolio.
Table of contents
Companies Overview
Elastic N.V. and Strategy Inc shape key segments within the software application industry, each commanding distinct market niches.
Elastic N.V.: Real-Time Data Search Innovator
Elastic N.V. leads as a search technology provider specializing in multi-cloud environments. Its core revenue stems from Elastic Stack, a software suite that enables real-time data ingestion, search, and visualization. In 2026, Elastic emphasizes expanding its platform capabilities to unify diverse data types and enhance user analytics.
Strategy Inc: Bitcoin-Backed Analytics Pioneer
Strategy Inc operates as a bitcoin treasury and AI analytics company offering securities tied to Bitcoin alongside enterprise analytics software. Its revenue combines exposure to cryptocurrency with AI tools like Strategy One and Mosaic. The firm’s 2026 focus centers on integrating blockchain assets with data governance solutions for enterprise decision-making.
Strategic Collision: Similarities & Divergences
Both companies thrive in software application innovation but diverge sharply in focus—Elastic champions open, cloud-based data search; Strategy blends closed bitcoin exposure with AI insights. They compete primarily in enterprise analytics and data-driven decision-making. Elastic’s growth depends on software adoption, while Strategy’s profile hinges on cryptocurrency market dynamics, presenting distinct risk-return frameworks.
Income Statement Comparison
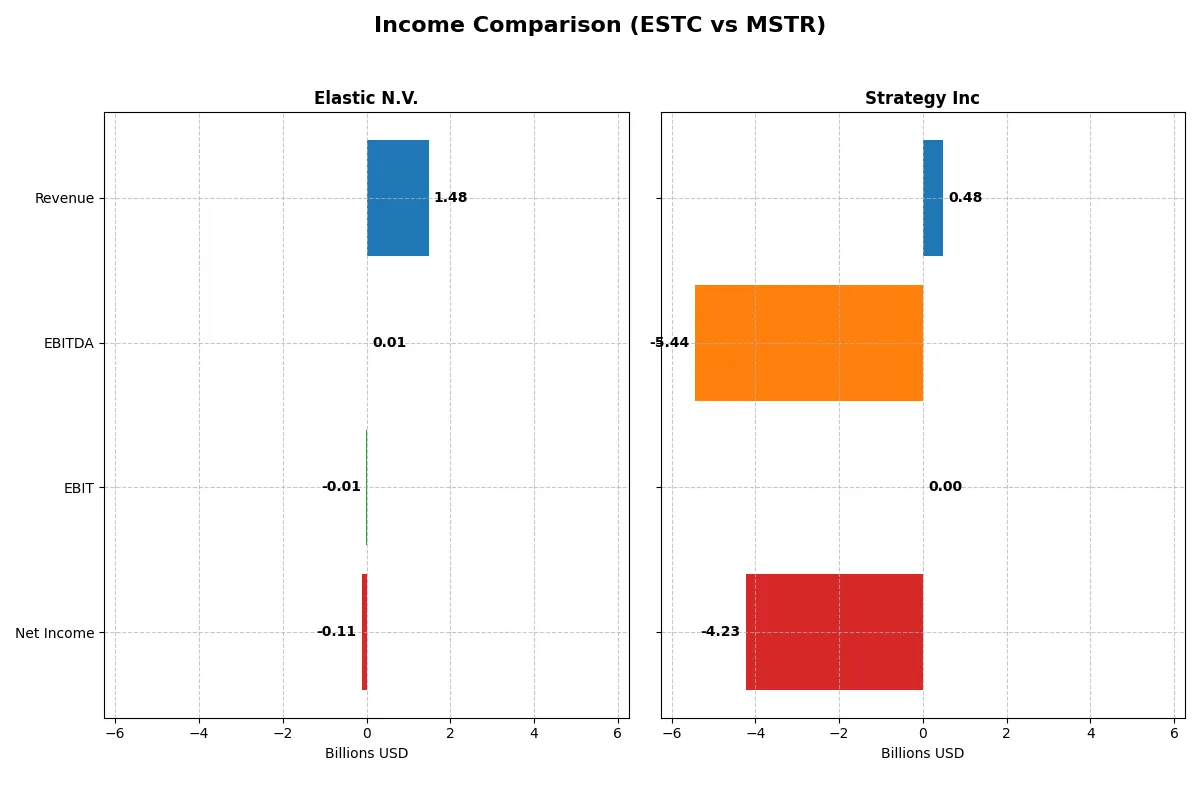
This data dissects the core profitability and scalability of both corporate engines to reveal who dominates the bottom line:
| Metric | Elastic N.V. (ESTC) | Strategy Inc (MSTR) |
|---|---|---|
| Revenue | 1.48B | 477M |
| Cost of Revenue | 380M | 149M |
| Operating Expenses | 1.16B | 5.62B |
| Gross Profit | 1.10B | 328M |
| EBITDA | 6M | -5.44B |
| EBIT | -6.26M | 0 |
| Interest Expense | 25.3M | -64.97M |
| Net Income | -108M | -4.23B |
| EPS | -1.04 | -15.23 |
| Fiscal Year | 2025 | 2025 |
Income Statement Analysis: The Bottom-Line Duel
This income statement comparison reveals which company operates with greater efficiency and financial health amid changing market dynamics.
Elastic N.V. Analysis
Elastic N.V. exhibits strong revenue growth, rising from 608M in 2021 to 1.48B in 2025. Despite a solid gross margin near 74%, the company struggles with net losses, posting -108M in 2025. Its improving EBIT margin, though negative at -0.42%, signals momentum toward operational efficiency.
Strategy Inc Analysis
Strategy Inc’s revenue hovers around 477M in 2025, showing minimal growth over five years. The gross margin remains favorable at almost 69%, but massive operating and other expenses drive a steep net loss of -4.23B. EBIT margins remain unfavorable, reflecting ongoing profitability challenges.
Margin Strength vs. Scale and Sustainability
Elastic N.V. demonstrates robust top-line growth and improving operational margins, though still not profitable at the net level. Strategy Inc maintains stable revenue and decent gross margins but suffers from overwhelming expenses leading to deep losses. For investors, Elastic’s growth trajectory and margin improvement offer a more compelling profile than Strategy’s persistent deficit.
Financial Ratios Comparison
These vital ratios act as a diagnostic tool to expose the underlying fiscal health, valuation premiums, and capital efficiency of the companies compared below:
| Ratios | Elastic N.V. (ESTC) | Strategy Inc (MSTR) |
|---|---|---|
| ROE | -11.7% (2025) | -6.4% (2024) |
| ROIC | -3.4% (2025) | -4.4% (2024) |
| P/E | -82.7 (2025) | -47.8 (2024) |
| P/B | 9.64 (2025) | 3.06 (2024) |
| Current Ratio | 1.92 (2025) | 0.71 (2024) |
| Quick Ratio | 1.92 (2025) | 0.71 (2024) |
| D/E (Debt-to-Equity) | 0.64 (2025) | 0.40 (2024) |
| Debt-to-Assets | 23% (2025) | 28% (2024) |
| Interest Coverage | -2.2 (2025) | -29.9 (2024) |
| Asset Turnover | 0.57 (2025) | 0.018 (2024) |
| Fixed Asset Turnover | 51.3 (2025) | 5.73 (2024) |
| Payout ratio | 0% (2025) | 0% (2024) |
| Dividend yield | 0% (2025) | 0% (2024) |
| Fiscal Year | 2025 | 2024 |
Efficiency & Valuation Duel: The Vital Signs
Ratios act as a company’s DNA, uncovering hidden risks and operational strengths behind the surface numbers.
Elastic N.V.
Elastic shows weak profitability with negative ROE at -11.66% and net margin at -7.29%, signaling operational challenges. Its valuation appears attractive with a favorable negative P/E, yet a high P/B of 9.64 suggests some market skepticism. The company reinvests heavily in R&D, focusing on growth rather than dividends.
Strategy Inc
Strategy Inc also struggles with profitability, posting a negative ROE of -6.4% and a deeply negative net margin of -251.73%. Despite a favorable P/E of -47.8, the low asset turnover of 0.02 and a weak current ratio of 0.71 raise liquidity concerns. It returns no dividends, likely prioritizing restructuring or strategic investments.
Valuation Stretch vs. Operational Stability
Elastic N.V. balances moderate valuation appeal against operational inefficiencies and solid liquidity. Strategy Inc’s valuation looks stretched by weak operational metrics and poor liquidity. Investors seeking a less risky profile may lean toward Elastic’s stronger financial footing, while Strategy Inc fits those prepared for higher risk and potential turnaround.
Which one offers the Superior Shareholder Reward?
Elastic N.V. (ESTC) and Strategy Inc (MSTR) both pay no dividends, focusing entirely on reinvestment and buybacks. ESTC shows zero dividend yield and zero payout ratio but boasts a free cash flow per share of 2.5 and modest buyback capacity. MSTR also pays no dividend, with negative free cash flow of -115 and negative operating cash flow, indicating no buybacks. Despite ESTC’s near break-even earnings and strong cash flow, MSTR suffers steep losses and weak liquidity (current ratio 0.71). I find ESTC’s capital allocation more sustainable and likely to generate shareholder value in 2026. Therefore, ESTC offers the superior total return profile given its healthier cash flows and prudent reinvestment strategy.
Comparative Score Analysis: The Strategic Profile
The radar chart reveals the fundamental DNA and trade-offs of Elastic N.V. and Strategy Inc, highlighting their financial strengths and weaknesses across key metrics:
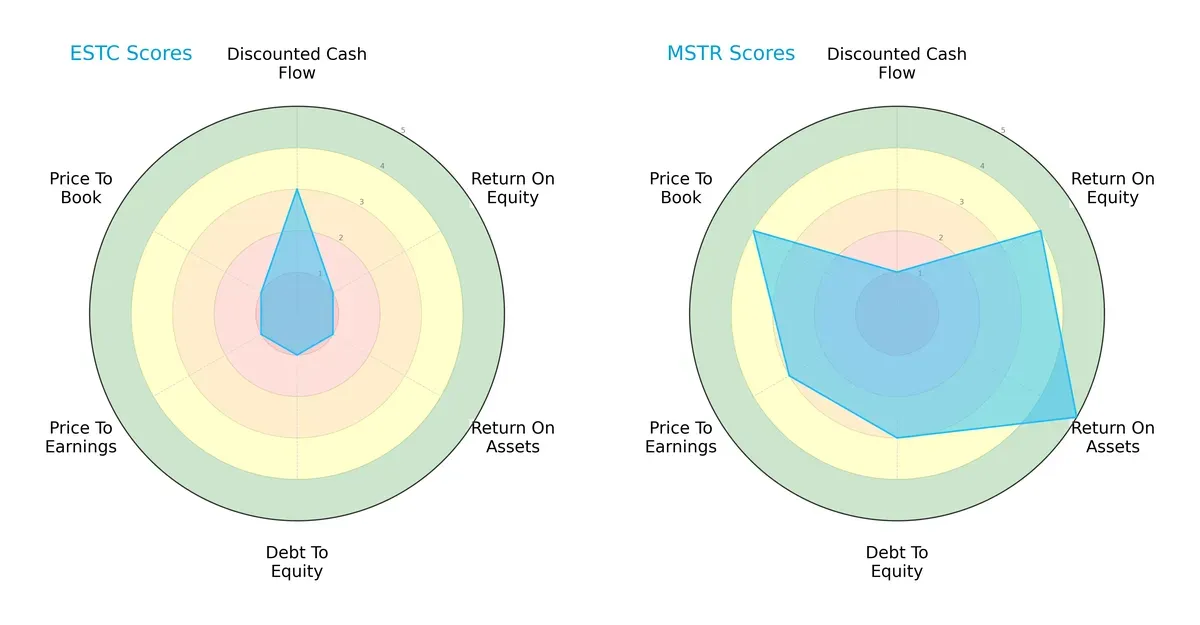
Strategy Inc delivers a more balanced profile with strong ROE (4) and ROA (5) scores, reflecting superior operational efficiency. Elastic N.V. struggles broadly, scoring 1 across ROE, ROA, Debt/Equity, and valuation metrics, relying modestly on a moderate DCF score (3). Strategy Inc’s moderate debt (3) contrasts sharply with Elastic’s weak leverage position (1), indicating better financial stability.
Bankruptcy Risk: Solvency Showdown
Both Elastic N.V. and Strategy Inc fall within the Altman Z-Score grey zone, signaling moderate bankruptcy risk in this economic cycle:
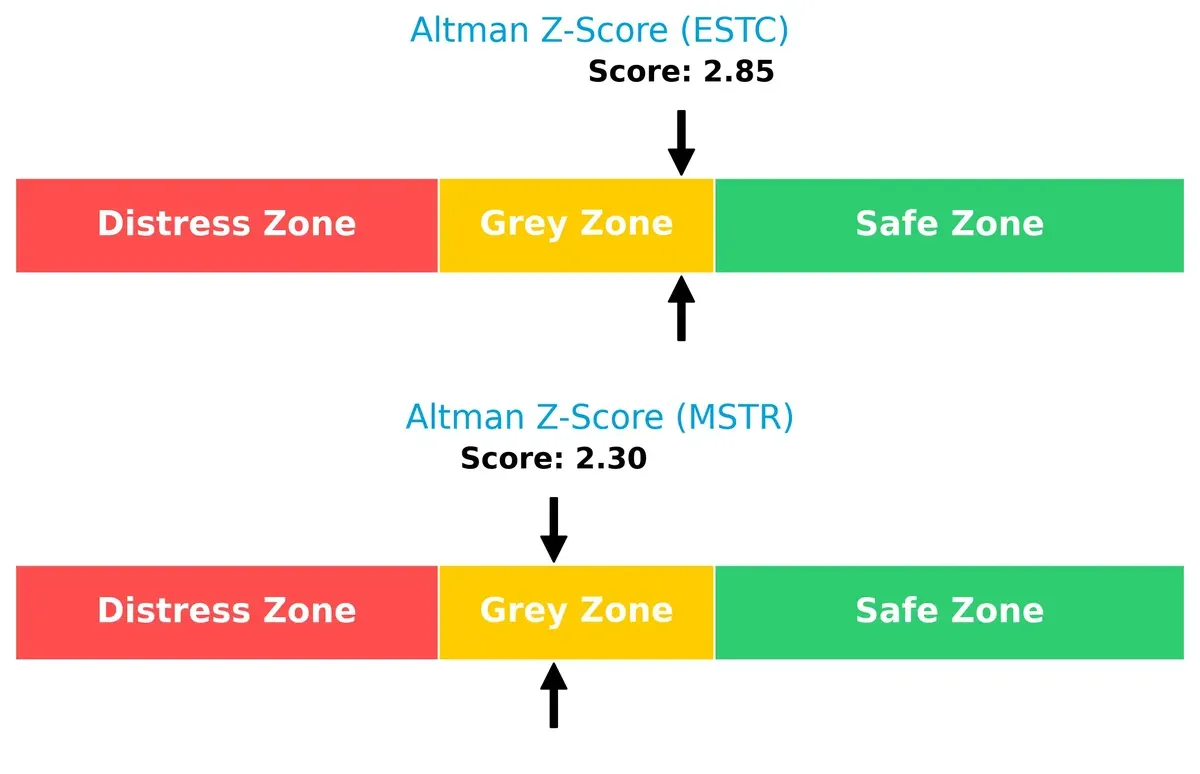
Elastic’s Z-score of 2.85 slightly exceeds Strategy Inc’s 2.30, suggesting marginally better solvency. However, neither company is firmly in the safe zone, warranting cautious monitoring.
Financial Health: Quality of Operations
Elastic N.V. and Strategy Inc share identical Piotroski F-Scores of 4, indicating average financial health with room for improvement:
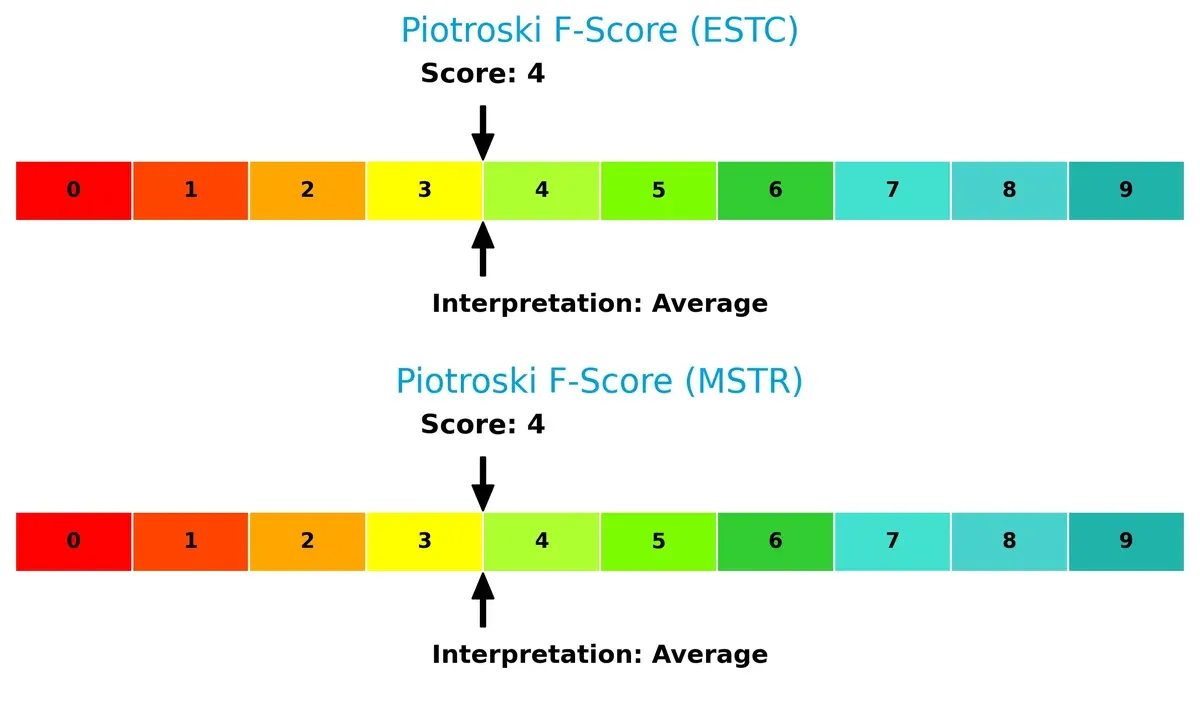
Both firms show no immediate red flags but lack the financial robustness of strong performers. Investors should watch operational efficiencies and leverage metrics closely going forward.
How are the two companies positioned?
This section dissects the operational DNA of ESTC and MSTR by comparing their revenue distribution and internal dynamics. The goal is to confront their economic moats and identify which model offers the most resilient, sustainable competitive advantage today.
Revenue Segmentation: The Strategic Mix
This visual comparison dissects how Elastic N.V. and Strategy Inc diversify their income streams and where their primary sector bets lie:
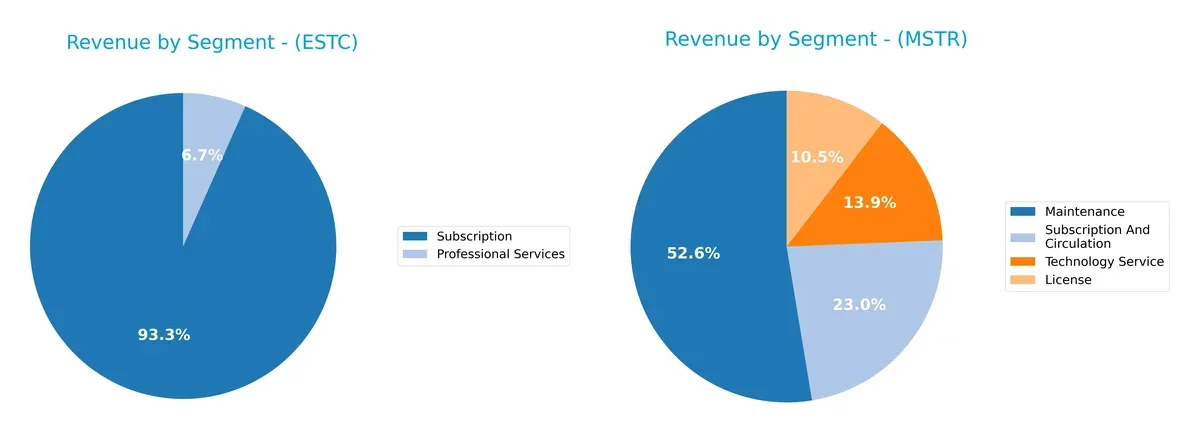
Elastic N.V. anchors its revenue heavily on subscription services, generating $1.38B in 2025, with professional services contributing a modest $99M. In contrast, Strategy Inc shows a more balanced mix: maintenance leads with $244M, followed by license ($49M), subscription and circulation ($107M), and technology services ($64M). Strategy Inc’s diverse streams reduce concentration risk, while Elastic N.V. pivots sharply on subscription dominance, signaling strong ecosystem lock-in but higher reliance on one segment.
Strengths and Weaknesses Comparison
This table compares the strengths and weaknesses of Elastic N.V. and Strategy Inc based on diversification, profitability, financials, innovation, global presence, and market share:
Elastic N.V. Strengths
- Strong subscription revenue growth
- Balanced geographic revenue between US and Non-US
- Favorable current and quick ratios indicate liquidity
- Low debt-to-assets ratio supports financial stability
- High fixed asset turnover shows efficient asset use
Strategy Inc Strengths
- Diverse revenue streams including license, maintenance, subscription, and technology services
- Favorable debt-to-equity and debt-to-assets ratios indicate prudent leverage
- Positive fixed asset turnover reflects asset productivity
- Global presence with significant North America and EMEA revenues
Elastic N.V. Weaknesses
- Negative net margin, ROE, and ROIC reflect profitability challenges
- High price-to-book ratio may signal overvaluation
- Negative interest coverage ratio raises solvency concerns
- No dividend yield limits income returns
- Moderate debt-to-equity ratio signals some leverage risk
Strategy Inc Weaknesses
- Severely negative net margin and ROE signal poor profitability
- Unfavorable current and quick ratios indicate liquidity stress
- Very low asset turnover limits operational efficiency
- Negative interest coverage ratio warns of debt servicing risk
- No dividend yield restricts investor income
Elastic N.V. shows stronger liquidity and asset utilization but struggles with profitability and valuation. Strategy Inc faces deeper profitability and liquidity issues despite diversified revenue and controlled leverage. Both companies must address profitability gaps to improve financial resilience.
The Moat Duel: Analyzing Competitive Defensibility
A structural moat alone protects long-term profits from relentless competitive erosion. Let’s dissect the moats of two tech players:
Elastic N.V.: Platform Power with Intangible Assets
Elastic’s moat stems from its proprietary Elastic Stack software, creating high switching costs and strong network effects. This manifests in stable gross margins near 75%. Rising ROIC signals improving capital efficiency in 2026 amid cloud adoption expansion.
Strategy Inc: Data-Driven AI and Bitcoin Exposure
Strategy leans on AI analytics and Bitcoin treasury exposure, differentiating its moat from Elastic’s software focus. However, revenue stagnation and sharply declining ROIC highlight weakening economic defensibility, despite AI platform potential for enterprise upgrades.
Platform Dominance vs. Diversified Innovation: Elastic’s Moat Holds Stronger
Elastic’s growing ROIC and stable margins reveal a deeper, more sustainable moat than Strategy’s fading capital returns. Elastic is better positioned to defend its market share and capitalize on cloud trends in 2026.
Which stock offers better returns?
Over the past year, both Elastic N.V. and Strategy Inc experienced significant price declines, with distinct bearish trends and decelerating momentum shaping their trading dynamics.
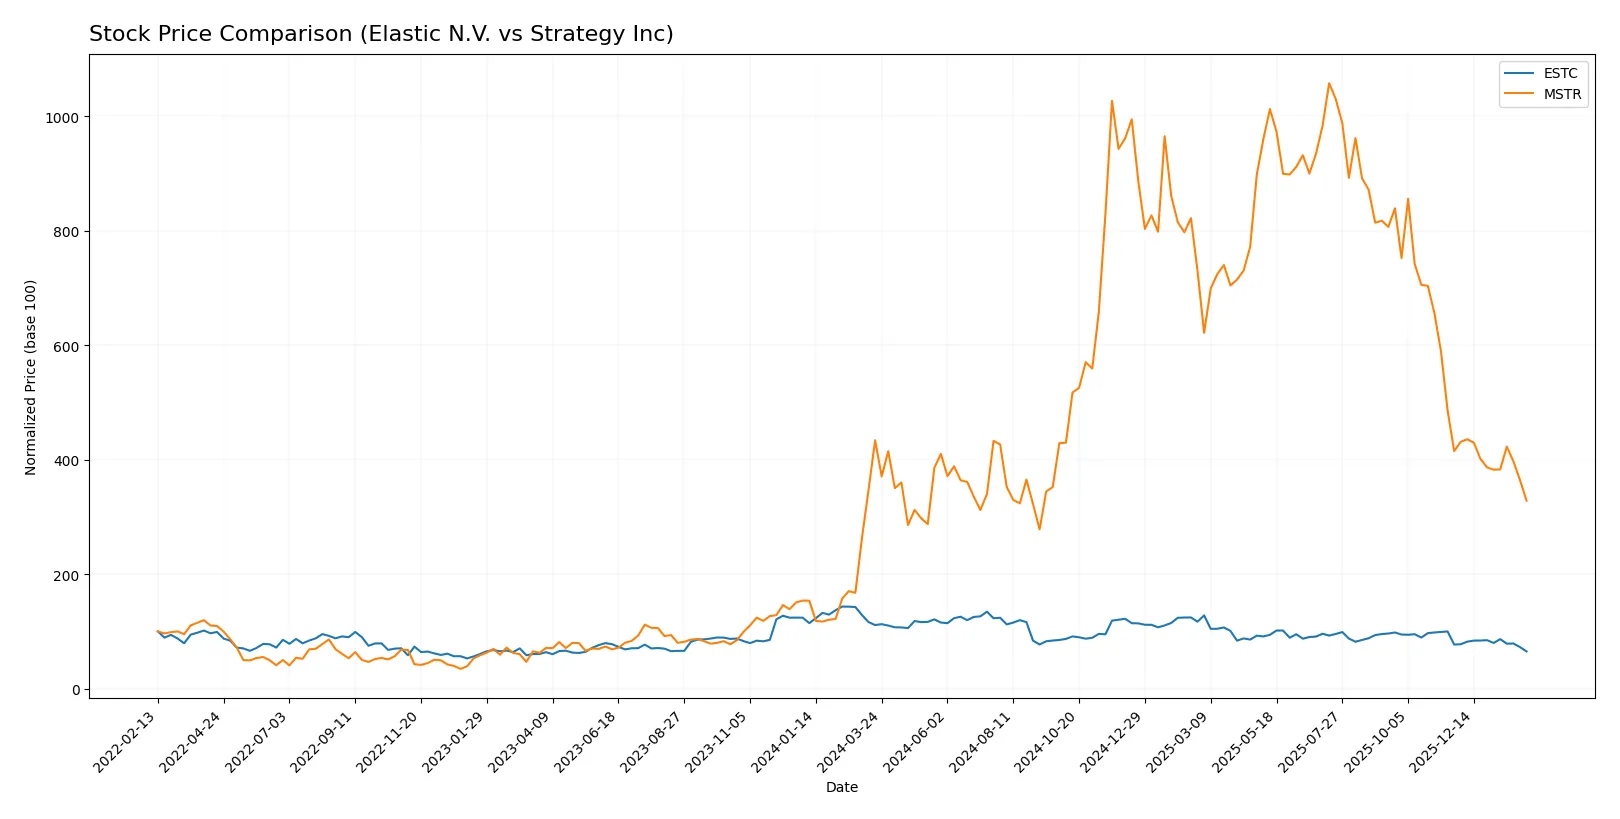
Trend Comparison
Elastic N.V. fell 41.51% over 12 months, marking a bearish trend with decelerating losses. Its volatility is moderate, ranging from 59.12 to 122.27, with recent declines slowing slightly.
Strategy Inc dropped 24.3% in the same period, also bearish with deceleration. It shows much higher volatility, swinging between 114.3 and 434.58, and recent losses accelerated more sharply.
Comparing both, Elastic N.V. posted the steeper decline but with less volatility. Strategy Inc outperformed Elastic N.V. by delivering a smaller overall loss despite greater price swings.
Target Prices
Analysts present a broad target price consensus for Elastic N.V. and Strategy Inc, signaling significant upside potential versus current prices.
| Company | Target Low | Target High | Consensus |
|---|---|---|---|
| Elastic N.V. | 76 | 134 | 108 |
| Strategy Inc | 175 | 705 | 374.5 |
Elastic N.V.’s consensus target of 108 implies an 83% upside from its 59 price, reflecting confidence in its cloud software growth. Strategy Inc’s 374.5 target suggests a nearly 177% gain, highlighting strong bullish sentiment despite its high beta risk.

Don’t Let Luck Decide Your Entry Point
Optimize your entry points with our advanced ProRealTime indicators. You’ll get efficient buy signals with precise price targets for maximum performance. Start outperforming now!
How do institutions grade them?
Here is a summary of recent institutional grades for Elastic N.V. and Strategy Inc:
Elastic N.V. Grades
The following table shows Elastic N.V.’s latest grades from recognized grading companies.
| Grading Company | Action | New Grade | Date |
|---|---|---|---|
| Rosenblatt | Maintain | Buy | 2026-01-30 |
| Barclays | Maintain | Overweight | 2026-01-12 |
| RBC Capital | Maintain | Outperform | 2026-01-05 |
| Jefferies | Maintain | Buy | 2026-01-05 |
| Citigroup | Maintain | Buy | 2025-11-24 |
| DA Davidson | Maintain | Neutral | 2025-11-21 |
| UBS | Maintain | Buy | 2025-11-21 |
| Rosenblatt | Maintain | Buy | 2025-11-21 |
| B of A Securities | Maintain | Neutral | 2025-11-21 |
| Guggenheim | Maintain | Buy | 2025-11-21 |
Strategy Inc Grades
Below are Strategy Inc’s recent institutional grades from verified grading firms.
| Grading Company | Action | New Grade | Date |
|---|---|---|---|
| BTIG | Maintain | Buy | 2026-02-06 |
| Canaccord Genuity | Maintain | Buy | 2026-02-04 |
| Mizuho | Maintain | Outperform | 2026-01-16 |
| TD Cowen | Maintain | Buy | 2026-01-15 |
| Citigroup | Maintain | Buy | 2025-12-22 |
| Bernstein | Maintain | Outperform | 2025-12-08 |
| Monness, Crespi, Hardt | Upgrade | Neutral | 2025-11-10 |
| Canaccord Genuity | Maintain | Buy | 2025-11-03 |
| HC Wainwright & Co. | Maintain | Buy | 2025-11-03 |
| TD Cowen | Maintain | Buy | 2025-10-31 |
Which company has the best grades?
Both companies maintain predominantly Buy and Outperform ratings from reputable institutions. Elastic N.V. has consistent Buy grades with few Neutral opinions. Strategy Inc shows strong Buy and Outperform grades but includes one Neutral upgrade from Sell. Investors may see Elastic as slightly more uniformly favored, though both exhibit strong institutional support.
Risks specific to each company
The following categories identify the critical pressure points and systemic threats facing both firms in the 2026 market environment:
1. Market & Competition
Elastic N.V.
- Operates in multi-cloud search software, facing intense competition from established cloud and AI providers.
Strategy Inc
- Bitcoin treasury exposure adds volatility; software business competes in crowded AI analytics market.
2. Capital Structure & Debt
Elastic N.V.
- Moderate debt-to-equity at 0.64; interest coverage negative, signaling financial strain.
Strategy Inc
- Lower debt-to-equity at 0.4, but weak liquidity with current ratio at 0.71 raises solvency concerns.
3. Stock Volatility
Elastic N.V.
- Beta near 1 (0.95) suggests market-correlated volatility.
Strategy Inc
- Extremely high beta (3.54) implies large price swings and elevated risk for investors.
4. Regulatory & Legal
Elastic N.V.
- Subject to data privacy and cloud security regulations in US and global markets.
Strategy Inc
- Cryptocurrency holdings expose to evolving regulatory scrutiny and potential legal challenges globally.
5. Supply Chain & Operations
Elastic N.V.
- Dependent on cloud infrastructure providers; potential risks in multi-cloud integration.
Strategy Inc
- Operations rely on software development and crypto asset management; operational risks from market and tech shifts.
6. ESG & Climate Transition
Elastic N.V.
- Cloud software footprint has moderate ESG risk; pressure to improve energy-efficient data processing.
Strategy Inc
- Crypto exposure involves high energy usage concerns; ESG risks heightened amid climate transition focus.
7. Geopolitical Exposure
Elastic N.V.
- Global cloud services market exposes firm to international trade tensions and data sovereignty laws.
Strategy Inc
- Bitcoin treasury and international operations expose firm to geopolitical instability and crypto regulation variability.
Which company shows a better risk-adjusted profile?
Elastic N.V. faces moderate financial strain with negative profitability but maintains better liquidity and less extreme stock volatility. Strategy Inc’s major risk lies in its heavy crypto exposure, producing extreme price swings and solvency concerns. Elastic’s balanced, albeit challenged, capital structure and operational focus offer a more stable risk-adjusted profile. Meanwhile, Strategy Inc’s aggressive crypto positioning drives outsized risk, evidenced by its 3.5 beta and sub-1 current ratio. Investors prioritizing steadier growth and lower volatility should favor Elastic N.V. despite its profitability issues.
Final Verdict: Which stock to choose?
Elastic N.V. (ESTC) impresses with its core strength as a cash-generating engine, reflected in solid free cash flow and growing operating efficiency. However, its point of vigilance lies in persistent losses and negative returns on equity, signaling caution on profitability. It suits portfolios targeting aggressive growth with tolerance for near-term volatility.
Strategy Inc (MSTR) benefits from a strategic moat anchored in specialized market positioning and relatively stable asset utilization. Compared to ESTC, it offers a more moderate safety profile despite weaker liquidity metrics. This stock fits well within GARP strategies, appealing to investors seeking growth balanced with reasonable valuation considerations.
If you prioritize rapid operational improvement and a compelling cash flow story, Elastic N.V. outshines due to its accelerating ROIC trend and improving income fundamentals. However, if you seek more established stability and a strategic niche, Strategy Inc offers better balance, albeit at the cost of recent profitability challenges and liquidity risks. Both profiles carry notable risks, demanding prudent position sizing.
Disclaimer: Investment carries a risk of loss of initial capital. The past performance is not a reliable indicator of future results. Be sure to understand risks before making an investment decision.
Go Further
I encourage you to read the complete analyses of Elastic N.V. and Strategy Inc to enhance your investment decisions: