In today’s fast-evolving tech landscape, Shopify Inc. and Elastic N.V. stand out as prominent players in the software application industry. Shopify leads in e-commerce solutions, empowering merchants worldwide, while Elastic excels in search and data analytics technology across cloud environments. Their innovative approaches and market overlap make them compelling candidates for comparison. This article will help you decide which company holds the most promise for your investment portfolio.

Table of contents
Companies Overview
I will begin the comparison between Shopify Inc. and Elastic N.V. by providing an overview of these two companies and their main differences.
Shopify Inc. Overview
Shopify Inc. is a commerce company headquartered in Ottawa, Canada, providing a platform that enables merchants to manage and sell products through multiple sales channels globally. Its services include product and inventory management, payment processing, order fulfillment, and merchant solutions such as financing and shipping. Founded in 2004, Shopify serves clients across Americas, Europe, Middle East, Africa, and Asia Pacific.
Elastic N.V. Overview
Elastic N.V., based in Mountain View, California, is a search company offering cloud-based technology solutions primarily through its Elastic Stack software portfolio. This suite supports data ingestion, storage, search, analysis, and visualization across multi-cloud environments. Founded in 2012, Elastic’s products include Elasticsearch, Kibana, Beats, Elastic Agent, and Logstash, targeting applications like app search and monitoring.
Key similarities and differences
Both Shopify and Elastic operate in the software application industry and serve global markets, emphasizing cloud-based solutions. Shopify focuses on e-commerce enabling merchants to manage sales and operations, while Elastic specializes in data search and analytics software. Shopify has a significantly higher market capitalization and employee count, reflecting its broader commercial platform, whereas Elastic offers specialized cloud-based data technologies with a smaller scale.
Income Statement Comparison
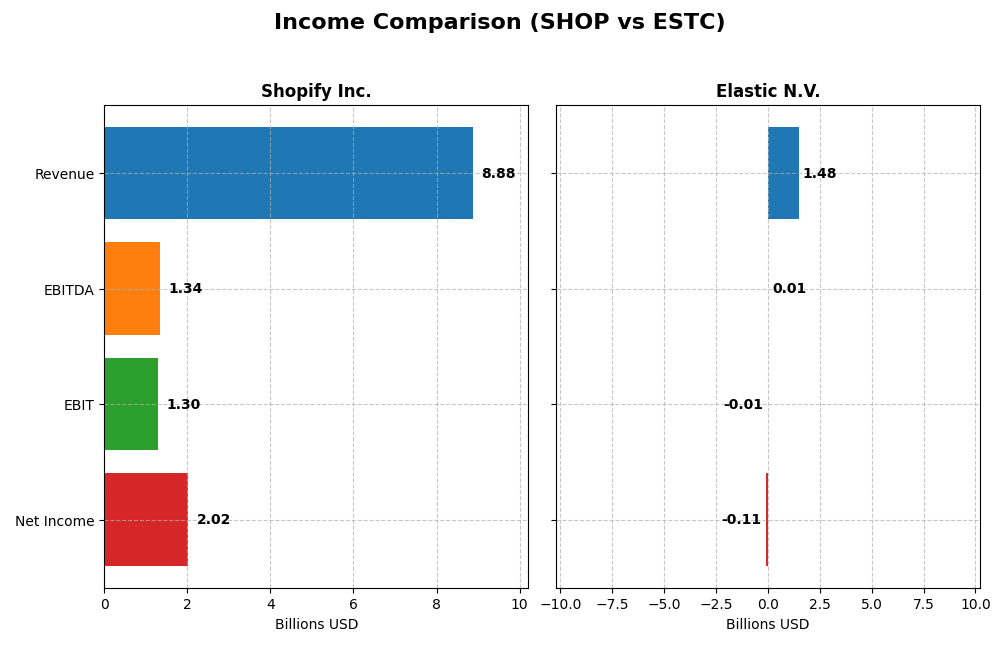
This table presents a side-by-side comparison of key income statement metrics for Shopify Inc. and Elastic N.V. based on their most recent fiscal year results.
| Metric | Shopify Inc. (SHOP) | Elastic N.V. (ESTC) |
|---|---|---|
| Market Cap | 205B | 7.8B |
| Revenue | 8.88B | 1.48B |
| EBITDA | 1.34B | 6.1M |
| EBIT | 1.30B | -6.3M |
| Net Income | 2.02B | -108M |
| EPS | 1.56 | -1.04 |
| Fiscal Year | 2024 | 2025 |
Income Statement Interpretations
Shopify Inc.
Shopify Inc. demonstrated strong revenue growth from 2020 to 2024, surging from $2.9B to $8.9B, with net income rising sharply from $320M to $2B. Margins remained robust, with a gross margin around 50% and net margin improving to 22.7%. The 2024 fiscal year saw significant margin expansion and profitability recovery after prior fluctuations, highlighting solid operational leverage.
Elastic N.V.
Elastic N.V. exhibited consistent revenue growth from $608M in 2021 to $1.48B in 2025. Gross margins were notably high at 74.4%, but profitability remained challenged with a negative EBIT margin of -0.42% and net margin at -7.3% in 2025. Despite improved revenue and operating income growth, net income declined in the latest year, reflecting ongoing profitability struggles.
Which one has the stronger fundamentals?
Shopify shows stronger fundamentals with consistent positive net income growth, expanding margins, and favorable earnings per share trends, reflecting effective cost control and scaling. Elastic, although growing revenue and gross profit, faces persistent net losses and unfavorable profitability metrics. Shopify’s financials suggest a more stable and improving income statement profile relative to Elastic’s mixed earnings performance.
Financial Ratios Comparison
This table presents the key financial ratios for Shopify Inc. and Elastic N.V. based on their most recent fiscal year data, enabling a clear side-by-side evaluation.
| Ratios | Shopify Inc. (2024) | Elastic N.V. (2025) |
|---|---|---|
| ROE | 17.47% | -11.66% |
| ROIC | 7.55% | -3.45% |
| P/E | 68.18 | -82.65 |
| P/B | 11.91 | 9.64 |
| Current Ratio | 3.71 | 1.92 |
| Quick Ratio | 3.70 | 1.92 |
| D/E (Debt-to-Equity) | 0.097 | 0.642 |
| Debt-to-Assets | 8.09% | 22.95% |
| Interest Coverage | 0 | -2.17 |
| Asset Turnover | 0.64 | 0.57 |
| Fixed Asset Turnover | 63.43 | 51.28 |
| Payout ratio | 0 | 0 |
| Dividend yield | 0 | 0 |
Interpretation of the Ratios
Shopify Inc.
Shopify’s ratios present a mixed picture with strong net margin (22.74%) and return on equity (17.47%), indicating profitability and efficient equity use. However, its high price-to-earnings (68.18) and price-to-book (11.91) ratios, alongside a suboptimal current ratio (3.71), raise valuation and liquidity concerns. The company does not pay dividends, likely reflecting reinvestment priorities in growth and innovation.
Elastic N.V.
Elastic’s financial ratios reveal weaknesses with negative net margin (-7.29%), return on equity (-11.66%), and return on invested capital (-3.45%), signaling unprofitability and capital inefficiency. Favorable liquidity ratios and low debt-to-assets (22.95%) contrast with poor interest coverage (-0.25). Elastic also does not pay dividends, emphasizing reinvestment into R&D and strategic expansion over shareholder payouts.
Which one has the best ratios?
Shopify demonstrates a more favorable overall ratio profile with stronger profitability and capital efficiency despite some valuation and liquidity drawbacks. Elastic exhibits significant profitability and return challenges but maintains better leverage and liquidity metrics. Overall, Shopify’s ratios are slightly more favorable than Elastic’s, reflecting a stronger financial position in 2026.
Strategic Positioning
This section compares the strategic positioning of Shopify Inc. and Elastic N.V. across market position, key segments, and exposure to technological disruption:
Shopify Inc.
- Leading commerce platform with strong presence globally; faces competitive pressure in software-applications.
- Revenue driven by Merchant Solutions and Subscription Services supporting merchant commerce needs.
- Operates in diverse commerce channels; exposed to evolving e-commerce tech but no explicit disruption data.
Elastic N.V.
- Specialized search technology provider with a smaller market cap; moderate competitive pressure.
- Focused on Elastic Stack subscriptions and professional services for data search and analytics.
- Cloud-based search solutions in multi-cloud environments; tech disruption exposure inherent in software evolution.
Shopify Inc. vs Elastic N.V. Positioning
Shopify pursues a diversified commerce platform strategy addressing multiple sales channels and merchant services, benefiting from scale but facing broad competition. Elastic concentrates on specialized search software and cloud services, leveraging focused expertise but with a narrower market scope.
Which has the best competitive advantage?
Both companies show slightly unfavorable MOAT evaluations, shedding value yet improving profitability. Shopify’s larger scale contrasts with Elastic’s focused niche, but neither currently demonstrates a strong sustainable competitive advantage based on ROIC versus WACC data.
Stock Comparison
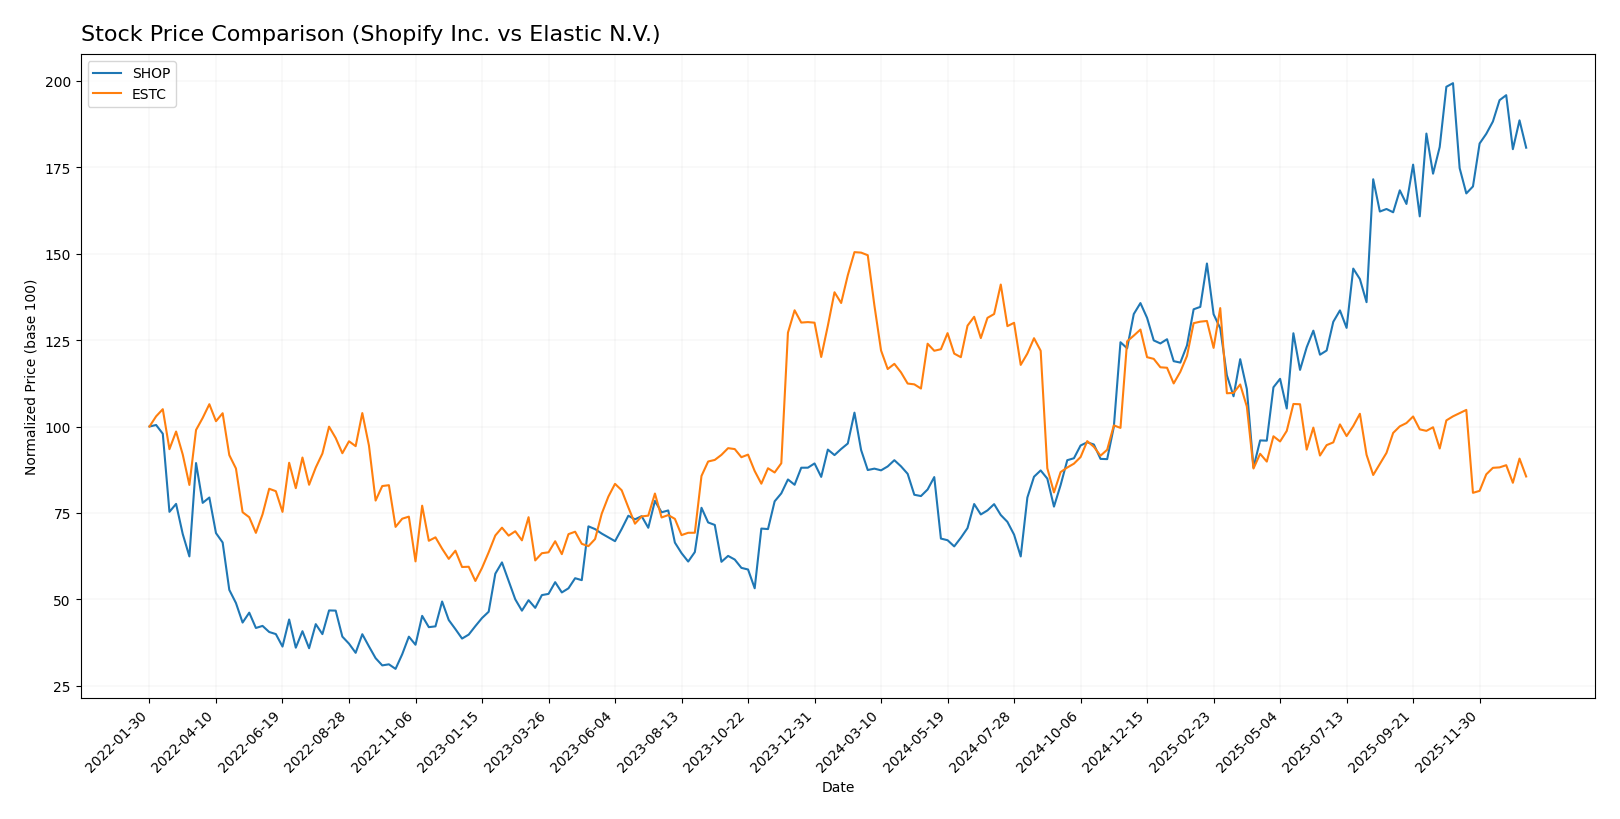
The stock price dynamics of Shopify Inc. (SHOP) and Elastic N.V. (ESTC) over the past 12 months reveal contrasting trajectories, with SHOP displaying a strong upward trend while ESTC faces significant declines.
Trend Analysis
Shopify Inc. (SHOP) has experienced a bullish trend over the past year, with a 106.69% price increase, though showing signs of deceleration. The stock ranged from a low of 54.43 to a high of 173.86, with notable volatility (std dev 33.71).
Elastic N.V. (ESTC) shows a bearish trend, declining 42.8% over the same period, also decelerating. Its price fluctuated between 70.04 and 129.62, with moderate volatility (std dev 14.04).
Comparing both, Shopify’s stock has outperformed Elastic’s by a wide margin, delivering the highest market performance among the two during the past 12 months.
Target Prices
The current analyst consensus shows optimistic target prices for both Shopify Inc. and Elastic N.V.
| Company | Target High | Target Low | Consensus |
|---|---|---|---|
| Shopify Inc. | 200 | 140 | 186.24 |
| Elastic N.V. | 134 | 76 | 108 |
Shopify’s consensus target price of 186.24 exceeds its current price of 157.47, indicating potential upside. Elastic’s target consensus at 108 is substantially above its current 74.13, suggesting expected growth.
Analyst Opinions Comparison
This section compares the analysts’ ratings and grades for Shopify Inc. and Elastic N.V.:
Rating Comparison
Shopify Inc. Rating
- Rating: B, considered very favorable by analysts.
- Discounted Cash Flow Score: 3, indicating moderate value.
- ROE Score: 4, suggesting favorable profit generation.
- ROA Score: 5, very favorable asset utilization.
- Debt To Equity Score: 3, moderate financial risk.
- Overall Score: 3, moderate overall financial standing.
Elastic N.V. Rating
- Rating: C-, status very favorable.
- Discounted Cash Flow Score: 3, also moderate.
- ROE Score: 1, very unfavorable for profit efficiency.
- ROA Score: 1, very unfavorable asset utilization.
- Debt To Equity Score: 1, very unfavorable financial risk.
- Overall Score: 1, very unfavorable overall standing.
Which one is the best rated?
Based strictly on the provided data, Shopify Inc. holds stronger ratings across key financial metrics including ROE, ROA, and debt-to-equity scores, resulting in a notably better overall score than Elastic N.V.
Scores Comparison
The scores comparison of Shopify Inc. and Elastic N.V. highlights their financial stability and strength:
SHOP Scores
- Altman Z-Score: 50.42, indicating a safe zone with very low bankruptcy risk.
- Piotroski Score: 6, classified as average financial strength.
ESTC Scores
- Altman Z-Score: 3.51, indicating a safe zone but much closer to the grey zone.
- Piotroski Score: 4, classified as average but lower than SHOP’s score.
Which company has the best scores?
Shopify Inc. shows a substantially higher Altman Z-Score, reflecting stronger financial safety compared to Elastic N.V. Both companies have average Piotroski Scores, but Shopify’s is moderately higher, indicating relatively stronger financial health.
Grades Comparison
The following tables present recent grades from reputable grading companies for Shopify Inc. and Elastic N.V.:
Shopify Inc. Grades
This table summarizes recent actionable grades from recognized financial institutions for Shopify Inc.:
| Grading Company | Action | New Grade | Date |
|---|---|---|---|
| Scotiabank | upgrade | Sector Outperform | 2026-01-08 |
| Wolfe Research | downgrade | Peer Perform | 2026-01-06 |
| Wells Fargo | maintain | Overweight | 2025-12-17 |
| Truist Securities | maintain | Hold | 2025-11-05 |
| CIBC | maintain | Outperform | 2025-11-05 |
| Cantor Fitzgerald | maintain | Neutral | 2025-11-05 |
| DA Davidson | maintain | Buy | 2025-11-05 |
| Scotiabank | maintain | Sector Perform | 2025-11-05 |
| Needham | maintain | Buy | 2025-11-05 |
| JP Morgan | maintain | Overweight | 2025-11-05 |
Overall, Shopify Inc.’s grades reflect a mixed but generally positive stance, with several downgrades balanced by upgrades and numerous maintained buy and outperform ratings.
Elastic N.V. Grades
This table summarizes recent actionable grades from recognized financial institutions for Elastic N.V.:
| Grading Company | Action | New Grade | Date |
|---|---|---|---|
| Barclays | maintain | Overweight | 2026-01-12 |
| RBC Capital | maintain | Outperform | 2026-01-05 |
| Jefferies | maintain | Buy | 2026-01-05 |
| Citigroup | maintain | Buy | 2025-11-24 |
| Wedbush | maintain | Outperform | 2025-11-21 |
| B of A Securities | maintain | Neutral | 2025-11-21 |
| Guggenheim | maintain | Buy | 2025-11-21 |
| Wells Fargo | maintain | Equal Weight | 2025-11-21 |
| RBC Capital | maintain | Outperform | 2025-11-21 |
| Canaccord Genuity | maintain | Buy | 2025-11-21 |
Elastic N.V. enjoys a consistent pattern of maintained buy and outperform grades, indicating stable analyst confidence without recent downgrades.
Which company has the best grades?
Both Shopify Inc. and Elastic N.V. hold a consensus rating of “Buy” with significant analyst support. However, Elastic N.V. shows a steadier trend of maintained buy and outperform grades, whereas Shopify experiences some recent grade fluctuations. This consistency may influence investor confidence differently depending on risk tolerance.
Strengths and Weaknesses
Below is a comparative overview of key strengths and weaknesses for Shopify Inc. and Elastic N.V., based on the most recent financial and operational data.
| Criterion | Shopify Inc. (SHOP) | Elastic N.V. (ESTC) |
|---|---|---|
| Diversification | Moderate: Revenue mainly from Merchant Solutions and Subscriptions, showing steady growth. | Limited: Primarily Subscription-based with Professional Services as a smaller segment. |
| Profitability | Strong net margin (22.74%) and ROE (17.47%), but ROIC below WACC indicates value destruction. | Negative net margin (-7.29%) and ROE (-11.66%), with ROIC also below WACC, indicating ongoing losses. |
| Innovation | High: Rapid growth in ROIC trend (+514%) suggests improving efficiency and innovation efforts. | Moderate: ROIC trend growing (+86%), but profitability remains negative, signaling innovation with delayed returns. |
| Global presence | Strong: Broad merchant base worldwide supporting diverse e-commerce solutions. | Moderate: Focused on subscription services with growing global adoption of search and analytics solutions. |
| Market Share | Leading in e-commerce platform space with expanding service offerings. | Niche player in enterprise search and analytics, with steady subscription growth but smaller scale. |
Key takeaways: Shopify demonstrates strong profitability and innovation with a diverse revenue base, though it currently destroys value due to high capital costs. Elastic is still recovering, showing improving ROIC but negative profitability, reflecting early stage growth challenges. Both companies have growth potential but differ in risk profiles.
Risk Analysis
Below is a comparative table outlining key risk factors for Shopify Inc. and Elastic N.V. based on the most recent data available for 2025-2026.
| Metric | Shopify Inc. (SHOP) | Elastic N.V. (ESTC) |
|---|---|---|
| Market Risk | High (Beta 2.84) — volatile stock price sensitive to market swings | Moderate (Beta 0.93) — relatively stable with lower volatility |
| Debt level | Low (D/E 0.1) — strong balance sheet with minimal leverage | Moderate (D/E 0.64) — higher leverage but manageable |
| Regulatory Risk | Moderate — operates in multiple regions with evolving e-commerce laws | Moderate — subject to data privacy and cloud regulations |
| Operational Risk | Moderate — complex platform operations and global merchant base | Moderate — reliance on cloud infrastructure and software integration |
| Environmental Risk | Low — primarily software, limited direct environmental impact | Low — software company with limited environmental footprint |
| Geopolitical Risk | Moderate — global presence exposes to geopolitical tensions affecting trade | Moderate — US-based but international clients exposed to global risks |
In synthesis, Shopify faces the most impactful risk from its high market volatility and unfavorable valuation metrics, despite solid financial health and low debt. Elastic’s key risks lie in operational and regulatory challenges, compounded by weaker profitability and higher leverage. Both companies are in the technology sector where rapid innovation and regulatory shifts remain critical risk factors.
Which Stock to Choose?
Shopify Inc. (SHOP) shows strong income growth with a 203% revenue increase over five years, favorable net and EBIT margins, and a solid 17.47% ROE. Its financial ratios are slightly favorable overall, with low debt and excellent liquidity, though valuation metrics appear stretched. The company has a slightly unfavorable moat, indicating value destruction despite rising profitability, and a very favorable rating of B.
Elastic N.V. (ESTC) exhibits moderate revenue growth of 144% over four years, but profitability remains challenged with negative net margins and ROE. Its financial ratios are neutral overall, with mixed debt levels and liquidity standing out positively. The company also faces a slightly unfavorable moat due to value destruction, paired with a very favorable rating of C-. Market trends show a bearish pattern.
Investors focused on growth and appreciating improving profitability might view Shopify as more favorable given its consistent income and ratio improvements. Conversely, those with a tolerance for risk and interest in potential turnaround scenarios could find Elastic’s current valuation and neutral financials worth monitoring. Each stock’s profile may appeal differently depending on the investor’s strategy and risk appetite.
Disclaimer: Investment carries a risk of loss of initial capital. The past performance is not a reliable indicator of future results. Be sure to understand risks before making an investment decision.
Go Further
I encourage you to read the complete analyses of Shopify Inc. and Elastic N.V. to enhance your investment decisions: