In the dynamic world of software applications, Salesforce, Inc. (CRM) and Elastic N.V. (ESTC) stand out as innovative leaders. Both companies operate in the technology sector, focusing on powerful data and customer relationship management solutions that cater to diverse industries. Salesforce excels in comprehensive CRM platforms, while Elastic specializes in search and analytics technology. This article will explore their strengths to determine which presents a more compelling investment opportunity for you.

Table of contents
Companies Overview
I will begin the comparison between Salesforce and Elastic by providing an overview of these two companies and their main differences.
Salesforce Overview
Salesforce, Inc. is a leading provider of customer relationship management (CRM) technology designed to connect companies and customers globally. Its Customer 360 platform offers tools for sales, service, marketing, commerce, analytics, and integration, serving industries such as financial services and healthcare. With a market cap of approximately 219B USD and over 76K employees, Salesforce emphasizes scalable, personalized customer experiences through its cloud-based solutions.
Elastic Overview
Elastic N.V. specializes in search technology solutions that operate across multi-cloud environments, primarily via its Elastic Stack software. Its products include Elasticsearch, Kibana, Beats, Elastic Agent, and Logstash, enabling data ingestion, search, analytics, and visualization for diverse data types. Elastic has a market cap near 7.8B USD, employs around 3.4K people, and focuses on real-time search and monitoring use cases within its technology sector niche.
Key similarities and differences
Both Salesforce and Elastic operate within the software application industry, focusing on cloud-based technology solutions that process and analyze data. However, Salesforce targets customer relationship management with a broad platform supporting sales, marketing, and service industries, while Elastic concentrates on search and data analytics infrastructure. Salesforce has a significantly larger market capitalization and workforce, reflecting its wider enterprise reach compared to Elastic’s more specialized product portfolio.
Income Statement Comparison
The table below presents a side-by-side comparison of key income statement metrics for Salesforce, Inc. and Elastic N.V. for the fiscal year 2025.

| Metric | Salesforce, Inc. (CRM) | Elastic N.V. (ESTC) |
|---|---|---|
| Market Cap | 219B | 7.8B |
| Revenue | 37.9B | 1.48B |
| EBITDA | 11.1B | 6.1M |
| EBIT | 7.67B | -6.3M |
| Net Income | 6.2B | -108M |
| EPS | 6.44 | -1.04 |
| Fiscal Year | 2025 | 2025 |
Income Statement Interpretations
Salesforce, Inc.
Salesforce demonstrated strong growth in revenue, increasing from $21.3B in 2021 to $37.9B in 2025, with net income rising from $4.07B to $6.2B over the same period. Margins remained robust, with a gross margin of 77.2% and a net margin of 16.4% in 2025. The latest fiscal year showed an 8.7% revenue increase and a 37.8% net margin improvement, signaling solid operational efficiency.
Elastic N.V.
Elastic’s revenue grew from $608M in 2021 to $1.48B in 2025, with net income fluctuating and ending at a loss of $108M in 2025. Gross margin stayed favorable at 74.4%, but EBIT and net margins were negative at -0.4% and -7.3%, respectively. Despite 17% revenue growth in 2025, net margin declined significantly, reflecting ongoing profitability challenges.
Which one has the stronger fundamentals?
Salesforce exhibits stronger fundamentals, supported by consistent revenue and net income growth alongside solid and improving margins. Elastic shows impressive revenue gains but struggles with negative profitability and margin volatility. Salesforce’s higher margin stability and positive net income trends present a more favorable income statement profile overall.
Financial Ratios Comparison
The table below presents a side-by-side comparison of key financial ratios for Salesforce, Inc. (CRM) and Elastic N.V. (ESTC) based on the most recent fiscal year data available.
| Ratios | Salesforce, Inc. (CRM) | Elastic N.V. (ESTC) |
|---|---|---|
| ROE | 10.13% | -11.66% |
| ROIC | 7.95% | -3.45% |
| P/E | 53.04 | -82.65 |
| P/B | 5.37 | 9.64 |
| Current Ratio | 1.06 | 1.92 |
| Quick Ratio | 1.06 | 1.92 |
| D/E (Debt-to-Equity) | 0.19 | 0.64 |
| Debt-to-Assets | 11.07% | 22.95% |
| Interest Coverage | 26.49 | -2.17 |
| Asset Turnover | 0.37 | 0.57 |
| Fixed Asset Turnover | 7.03 | 51.28 |
| Payout ratio | 24.80% | 0% |
| Dividend yield | 0.47% | 0% |
Interpretation of the Ratios
Salesforce, Inc.
Salesforce shows a mix of strong and weak ratios, with favorable debt management and interest coverage, yet an unfavorable price-to-earnings and price-to-book ratio. Asset turnover is also weak, indicating less efficient use of assets. The company pays dividends with a low yield of 0.47%, reflecting a cautious payout policy supported by solid free cash flow, but the dividend yield is considered unfavorable.
Elastic N.V.
Elastic’s ratios reveal several weaknesses, including negative net margin, return on equity, and interest coverage, signaling profitability and solvency concerns. However, liquidity ratios and fixed asset turnover are favorable. The company does not pay dividends, likely due to sustained losses and reinvestment needs, focusing on growth rather than shareholder payouts, which aligns with its negative earnings yield.
Which one has the best ratios?
Salesforce presents a slightly favorable overall ratio profile due to better profitability, debt control, and dividend coverage despite some valuation concerns. Elastic has a neutral rating with more pronounced profitability and solvency weaknesses, though it maintains strong liquidity. Salesforce’s ratios generally appear more balanced and stable compared to Elastic’s.
Strategic Positioning
This section compares the strategic positioning of Salesforce, Inc. and Elastic N.V., focusing on market position, key segments, and exposure to technological disruption:
Salesforce, Inc.
- Leading CRM provider with significant market cap; faces competitive pressure in enterprise software.
- Diverse segments including Sales, Service, Marketing Clouds, Analytics, and Platform services driving growth.
- Invests in integrated cloud solutions and analytics; potential disruption from evolving cloud and AI tech.
Elastic N.V.
- Smaller market cap focused on search technology; competes in multi-cloud environments.
- Core business centered on Elastic Stack subscriptions and professional services.
- Focused on search and data ingestion tech; exposed to rapid changes in cloud infrastructure.
Salesforce, Inc. vs Elastic N.V. Positioning
Salesforce presents a diversified business model spanning multiple cloud and analytics segments, enabling broad market reach. Elastic concentrates on its niche search and data analytics platform, which may limit scale but allows focused innovation and specialization.
Which has the best competitive advantage?
Both companies show slightly unfavorable MOAT evaluations due to ROIC below WACC but with growing profitability. Salesforce’s larger scale and diversified offerings contrast with Elastic’s niche focus, suggesting different competitive challenges without a clear superior advantage.
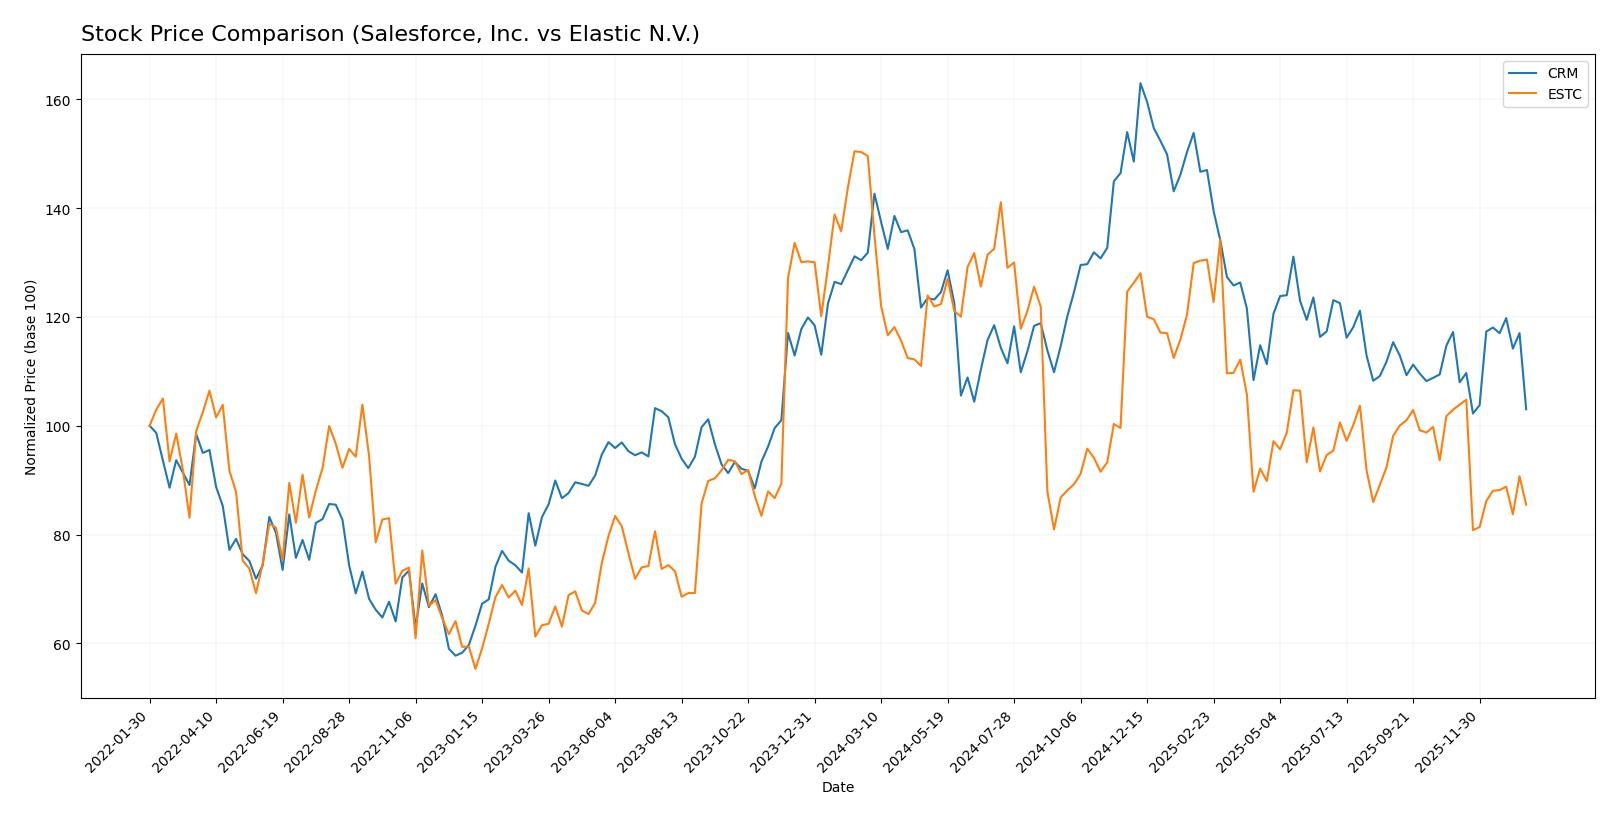
Stock Comparison
The stock price chart highlights significant bearish trends for both Salesforce, Inc. (CRM) and Elastic N.V. (ESTC) over the past 12 months, with distinct acceleration and deceleration patterns shaping their trading dynamics.
Trend Analysis
Salesforce, Inc. (CRM) shows a bearish trend with a -21.84% price change over the past year, marked by accelerating decline and high volatility (std deviation 31.79). Recent months indicate a mild upward slope despite continued losses.
Elastic N.V. (ESTC) also follows a bearish trend, with a sharper -42.83% drop over the same period. The decline shows deceleration and moderate volatility (std deviation 14.05). Recent trend analysis reveals an intensified negative slope.
Comparing both stocks, Salesforce has delivered the highest relative market performance with a smaller percentage loss and signs of recent stabilization, outperforming Elastic’s steeper decline.
Target Prices
Analysts present a cautiously optimistic target consensus for Salesforce, Inc. and Elastic N.V.
| Company | Target High | Target Low | Consensus |
|---|---|---|---|
| Salesforce, Inc. | 400 | 250 | 324.17 |
| Elastic N.V. | 134 | 76 | 108 |
Salesforce’s consensus target of 324.17 USD is significantly above its current price of 229 USD, indicating potential upside. Elastic’s consensus target of 108 USD similarly suggests upside from the current price near 74 USD.
Analyst Opinions Comparison
This section compares analysts’ ratings and grades for Salesforce, Inc. and Elastic N.V.:
Rating Comparison
Salesforce, Inc. Rating
- Rating: B+, considered very favorable by analysts.
- Discounted Cash Flow Score: 4, indicating favorable future cash flow projections.
- ROE Score: 4, reflecting strong efficiency in generating profit from equity.
- ROA Score: 4, demonstrating effective asset utilization to produce earnings.
- Debt To Equity Score: 3, representing moderate financial risk and balance sheet.
- Overall Score: 3, a moderate overall financial standing score.
Elastic N.V. Rating
- Rating: C-, considered very unfavorable by analysts.
- Discounted Cash Flow Score: 3, showing moderate outlook on cash flow valuation.
- ROE Score: 1, indicating very unfavorable profit generation from equity.
- ROA Score: 1, showing very unfavorable asset utilization.
- Debt To Equity Score: 1, indicating very unfavorable financial risk.
- Overall Score: 1, a very unfavorable overall financial standing score.
Which one is the best rated?
Based purely on the provided data, Salesforce, Inc. is better rated with a B+ rating and higher scores across discounted cash flow, ROE, ROA, debt-to-equity, and overall metrics compared to Elastic N.V.’s lower ratings and scores.
Scores Comparison
The following table compares the Altman Z-Score and Piotroski Score for Salesforce, Inc. and Elastic N.V.:
Salesforce Scores
- Altman Z-Score: 5.26, in the safe zone, indicating low bankruptcy risk.
- Piotroski Score: 7, categorized as strong financial health.
Elastic Scores
- Altman Z-Score: 3.51, in the safe zone, indicating low bankruptcy risk.
- Piotroski Score: 4, considered average financial health.
Which company has the best scores?
Salesforce shows a higher Altman Z-Score and a stronger Piotroski Score than Elastic, indicating comparatively better financial stability and health based on these metrics.
Grades Comparison
Here is a detailed comparison of the recent grades assigned to Salesforce, Inc. and Elastic N.V.:
Salesforce, Inc. Grades
The following table presents the latest grades from established grading companies for Salesforce, Inc.:
| Grading Company | Action | New Grade | Date |
|---|---|---|---|
| Barclays | Maintain | Overweight | 2026-01-12 |
| RBC Capital | Maintain | Sector Perform | 2026-01-05 |
| Morgan Stanley | Maintain | Overweight | 2025-12-09 |
| Citigroup | Maintain | Neutral | 2025-12-08 |
| DA Davidson | Maintain | Neutral | 2025-12-05 |
| Citizens | Maintain | Market Outperform | 2025-12-04 |
| Deutsche Bank | Maintain | Buy | 2025-12-04 |
| Wedbush | Maintain | Outperform | 2025-12-04 |
| Northland Capital Markets | Maintain | Market Perform | 2025-12-04 |
| Canaccord Genuity | Maintain | Buy | 2025-12-04 |
Salesforce’s grades predominantly indicate a positive outlook with many buy and outperform ratings, reflecting steady confidence from major financial institutions.
Elastic N.V. Grades
The following table presents the latest grades from established grading companies for Elastic N.V.:
| Grading Company | Action | New Grade | Date |
|---|---|---|---|
| Barclays | Maintain | Overweight | 2026-01-12 |
| RBC Capital | Maintain | Outperform | 2026-01-05 |
| Jefferies | Maintain | Buy | 2026-01-05 |
| Citigroup | Maintain | Buy | 2025-11-24 |
| Wedbush | Maintain | Outperform | 2025-11-21 |
| B of A Securities | Maintain | Neutral | 2025-11-21 |
| Guggenheim | Maintain | Buy | 2025-11-21 |
| Wells Fargo | Maintain | Equal Weight | 2025-11-21 |
| RBC Capital | Maintain | Outperform | 2025-11-21 |
| Canaccord Genuity | Maintain | Buy | 2025-11-21 |
Elastic N.V. shows a strong bias towards buy and outperform grades, with no sell or strong sell ratings, indicating solid analyst support.
Which company has the best grades?
Both Salesforce, Inc. and Elastic N.V. have consensus “Buy” ratings with a majority of buy and outperform grades. However, Salesforce has a larger volume of buy ratings (71 vs. 23) and some strong buy opinions, potentially implying greater analyst confidence and possibly more stability for investors.
Strengths and Weaknesses
Below is a comparison of key strengths and weaknesses for Salesforce, Inc. (CRM) and Elastic N.V. (ESTC), based on their latest financial and operational data.
| Criterion | Salesforce, Inc. (CRM) | Elastic N.V. (ESTC) |
|---|---|---|
| Diversification | Highly diversified product portfolio with strong revenue streams across Service Cloud (9.05B), Sales Cloud (8.32B), and others | Less diversified, mainly reliant on Subscription revenue (1.38B) with smaller Professional Services |
| Profitability | Positive net margin (16.35%), neutral ROIC (7.95%), slightly favorable financial ratios overall | Negative net margin (-7.29%), negative ROIC (-3.45%), neutral overall financial ratios |
| Innovation | Strong innovation with growing ROIC trend despite slightly unfavorable moat status | Innovation evident with growing ROIC trend, but overall shedding value and weaker profitability |
| Global presence | Established global footprint supported by significant and stable revenue growth across segments | Growing global presence but smaller scale and less diversified revenue sources |
| Market Share | Leading market position in CRM and cloud software markets | Smaller market share, niche player in search and data analytics |
Key takeaway: Salesforce demonstrates robust diversification and profitability with solid innovation capacity, though its economic moat is slightly unfavorable due to value shedding. Elastic shows promise with innovation and growing ROIC but struggles with profitability and scale. Investors should weigh Salesforce’s stability against Elastic’s higher risk and growth potential.
Risk Analysis
Below is a comparative risk table for Salesforce, Inc. (CRM) and Elastic N.V. (ESTC) based on the most recent data from 2025:
| Metric | Salesforce, Inc. (CRM) | Elastic N.V. (ESTC) |
|---|---|---|
| Market Risk | Beta 1.27, moderate volatility | Beta 0.93, lower volatility |
| Debt level | Low debt-to-equity 0.19, favorable | Moderate debt-to-equity 0.64, neutral |
| Regulatory Risk | Moderate, US tech sector regulations | Moderate, US and international regulations |
| Operational Risk | Large scale, complex integrations, manageable | Smaller scale but rapid growth challenges |
| Environmental Risk | Low, limited direct impact | Low, limited direct impact |
| Geopolitical Risk | Moderate, global operations exposure | Moderate, multi-cloud global presence |
The most impactful risks are market volatility for Salesforce, given its higher beta, and Elastic’s operational challenges related to scaling. Salesforce’s low debt and strong interest coverage reduce financial risk, while Elastic’s higher leverage and negative profitability metrics warrant caution. Both face moderate regulatory and geopolitical risks typical of global tech firms.
Which Stock to Choose?
Salesforce, Inc. (CRM) shows a favorable income evolution with 8.72% revenue growth in 2025 and strong profitability metrics, including a 16.35% net margin and a slightly favorable financial ratio profile. Its debt levels are low with a 0.19 debt-to-equity ratio, and it holds a very favorable B+ rating.
Elastic N.V. (ESTC) presents a mixed income picture with 17.04% revenue growth but negative net margin (-7.29%) and profitability ratios. The financial ratios are neutral overall, with some favorable liquidity measures but unfavorable leverage and valuation metrics. Its rating is C- and considered very unfavorable.
For investors focused on stability and profitability, Salesforce may appear more favorable due to its stronger income statement and rating, while those with a tolerance for risk and seeking higher growth potential might interpret Elastic’s profile as more suitable despite its current profitability challenges.
Disclaimer: Investment carries a risk of loss of initial capital. The past performance is not a reliable indicator of future results. Be sure to understand risks before making an investment decision.
Go Further
I encourage you to read the complete analyses of Salesforce, Inc. and Elastic N.V. to enhance your investment decisions: