In the dynamic world of technology, PTC Inc. and Elastic N.V. stand out as innovative leaders in software applications. Both companies serve enterprise customers with cutting-edge solutions—PTC focuses on digital transformation and product lifecycle management, while Elastic excels in search and data analytics across multi-cloud environments. This article will compare their market positions and innovation strategies to help you decide which company offers the most compelling investment opportunity.
Table of contents
Companies Overview
I will begin the comparison between PTC Inc. and Elastic N.V. by providing an overview of these two companies and their main differences.
PTC Inc. Overview
PTC Inc. operates in the software application industry, focusing on digital transformation solutions across the Americas, Europe, and Asia Pacific. The company offers platforms like ThingWorx for enterprise innovation, Vuforia for augmented reality, and Onshape, a SaaS product development tool. It supports product lifecycle management through software such as Creo and Windchill, complemented by consulting and cloud services. Founded in 1985, PTC is headquartered in Boston, Massachusetts.
Elastic N.V. Overview
Elastic N.V. provides search technology solutions designed for multi-cloud environments, primarily through its Elastic Stack product portfolio. This includes Elasticsearch, a real-time search engine, Kibana for data visualization, and Logstash for data processing. The company offers platform solutions for use cases like app search and application performance management. Incorporated in 2012, Elastic is headquartered in Mountain View, California, and serves global markets.
Key similarities and differences
Both PTC and Elastic operate in the software application sector, delivering solutions that enhance data handling and enterprise functionality. PTC emphasizes digital transformation and product lifecycle management across diverse industries, while Elastic specializes in search, analytics, and multi-cloud data solutions. Employee count and market capitalization differ significantly, reflecting their different scale and maturity within the technology industry.
Income Statement Comparison
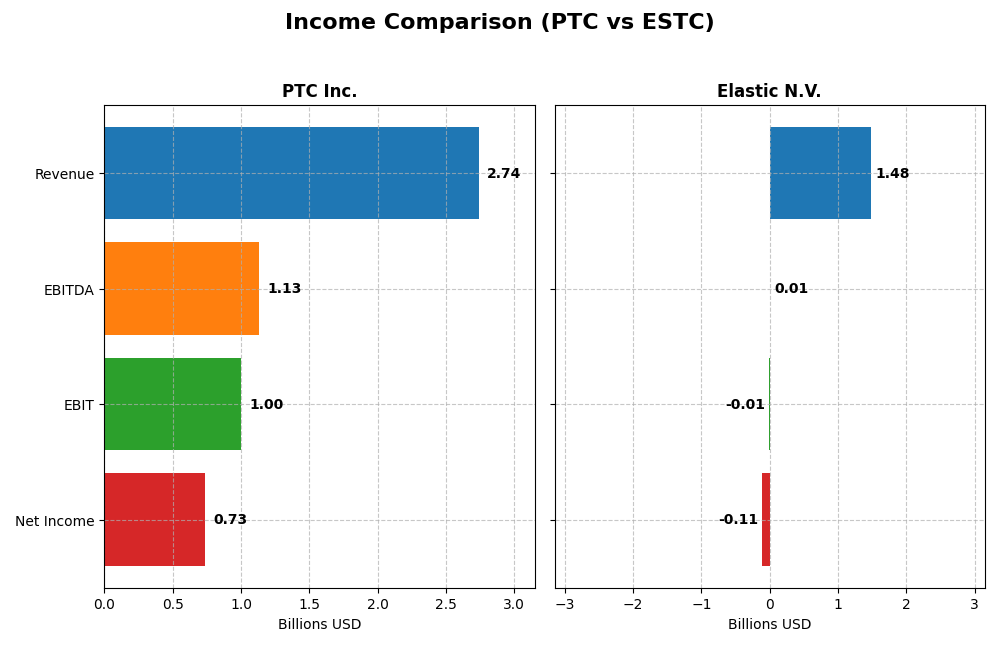
The table below presents a side-by-side comparison of key income statement metrics for PTC Inc. and Elastic N.V. for their most recent fiscal years, providing a clear view of their financial performance.
| Metric | PTC Inc. | Elastic N.V. |
|---|---|---|
| Market Cap | 19.9B | 7.5B |
| Revenue | 2.74B | 1.48B |
| EBITDA | 1.13B | 6.1M |
| EBIT | 997M | -6.3M |
| Net Income | 734M | -108M |
| EPS | 6.18 | -1.04 |
| Fiscal Year | 2025 | 2025 |
Income Statement Interpretations
PTC Inc.
PTC Inc. showed strong revenue growth from $1.81B in 2021 to $2.74B in 2025, with net income rising from $477M to $734M. Margins remained robust, with a gross margin of 83.76% and a net margin of 26.8% in 2025. The latest fiscal year saw a significant jump in EBIT and net income, reflecting improved operational efficiency and profitability.
Elastic N.V.
Elastic N.V.’s revenue increased markedly from $608M in 2021 to $1.48B in 2025, yet net income stayed negative in the most recent year at -$108M. Gross margin was favorable at 74.39%, but EBIT and net margins were negative, indicating ongoing challenges in profitability. Despite revenue growth, the latest year revealed continued net losses and margin pressures.
Which one has the stronger fundamentals?
PTC Inc. exhibits stronger fundamentals with consistent profitability, favorable margins, and solid growth in earnings and revenue over the period. Elastic N.V. demonstrates impressive revenue expansion but struggles with negative net income and EBIT margins, reflecting higher risk. PTC’s stable financial performance contrasts with Elastic’s ongoing profitability challenges.
Financial Ratios Comparison
The table below presents the most recent financial ratios for PTC Inc. and Elastic N.V., reflecting their performance and financial health as of their latest fiscal years.
| Ratios | PTC Inc. (2025 FY) | Elastic N.V. (2025 FY) |
|---|---|---|
| ROE | 19.18% | -11.66% |
| ROIC | 14.43% | -3.45% |
| P/E | 33.19 | -82.65 |
| P/B | 6.37 | 9.64 |
| Current Ratio | 1.12 | 1.92 |
| Quick Ratio | 1.12 | 1.92 |
| D/E (Debt-to-Equity) | 0.36 | 0.64 |
| Debt-to-Assets | 20.70% | 22.95% |
| Interest Coverage | 12.76 | -2.17 |
| Asset Turnover | 0.41 | 0.57 |
| Fixed Asset Turnover | 15.58 | 51.28 |
| Payout ratio | 0 | 0 |
| Dividend yield | 0 | 0 |
Interpretation of the Ratios
PTC Inc.
PTC Inc. shows a generally favorable ratio profile with strong net margin at 26.8%, ROE at 19.18%, and ROIC at 14.43%, indicating solid profitability and capital efficiency. Some unfavorable signs include a high PE of 33.19 and PB of 6.37, suggesting a premium valuation. The company does not pay dividends, which might reflect a focus on reinvestment or growth.
Elastic N.V.
Elastic N.V. exhibits mixed ratios with unfavorable profitability metrics: negative net margin (-7.29%), ROE (-11.66%), and ROIC (-3.45%), signaling operational challenges. Positive aspects include a favorable WACC of 7.83% and strong liquidity ratios (around 1.92). Elastic also does not pay dividends, likely due to ongoing reinvestment in R&D and growth initiatives.
Which one has the best ratios?
PTC Inc. presents a more favorable overall ratio profile, with a majority of metrics indicating efficient profitability and financial health. Elastic N.V. has a neutral stance with several unfavorable profitability ratios offset by strong liquidity and capital cost metrics, reflecting higher operational risks compared to PTC.
Strategic Positioning
This section compares the strategic positioning of PTC and Elastic N.V., including market position, key segments, and exposure to technological disruption:
PTC
- Leading software-applications company with a $19.9B market cap facing typical industry competition.
- Diverse product portfolio spanning licenses, cloud services, and technology services driving revenue.
- Focused on enabling digital transformation and augmented reality, less exposed to sudden disruption.
Elastic N.V.
- Smaller software firm with $7.5B market cap, operating in multi-cloud search solutions space.
- Revenue primarily from subscription services with growing professional services segment.
- Specializes in real-time search and analytics, which may face rapid changes due to cloud and data tech.
PTC vs Elastic N.V. Positioning
PTC adopts a diversified approach with multiple software and service segments, offering broad digital transformation tools. Elastic concentrates on cloud-based search and analytics, focusing on subscription revenue, which may limit diversification but enhances specialization.
Which has the best competitive advantage?
PTC holds a very favorable moat with strong and growing ROIC above WACC, demonstrating durable competitive advantage. Elastic shows slightly unfavorable moat status, shedding value despite improving profitability, indicating weaker competitive positioning.
Stock Comparison
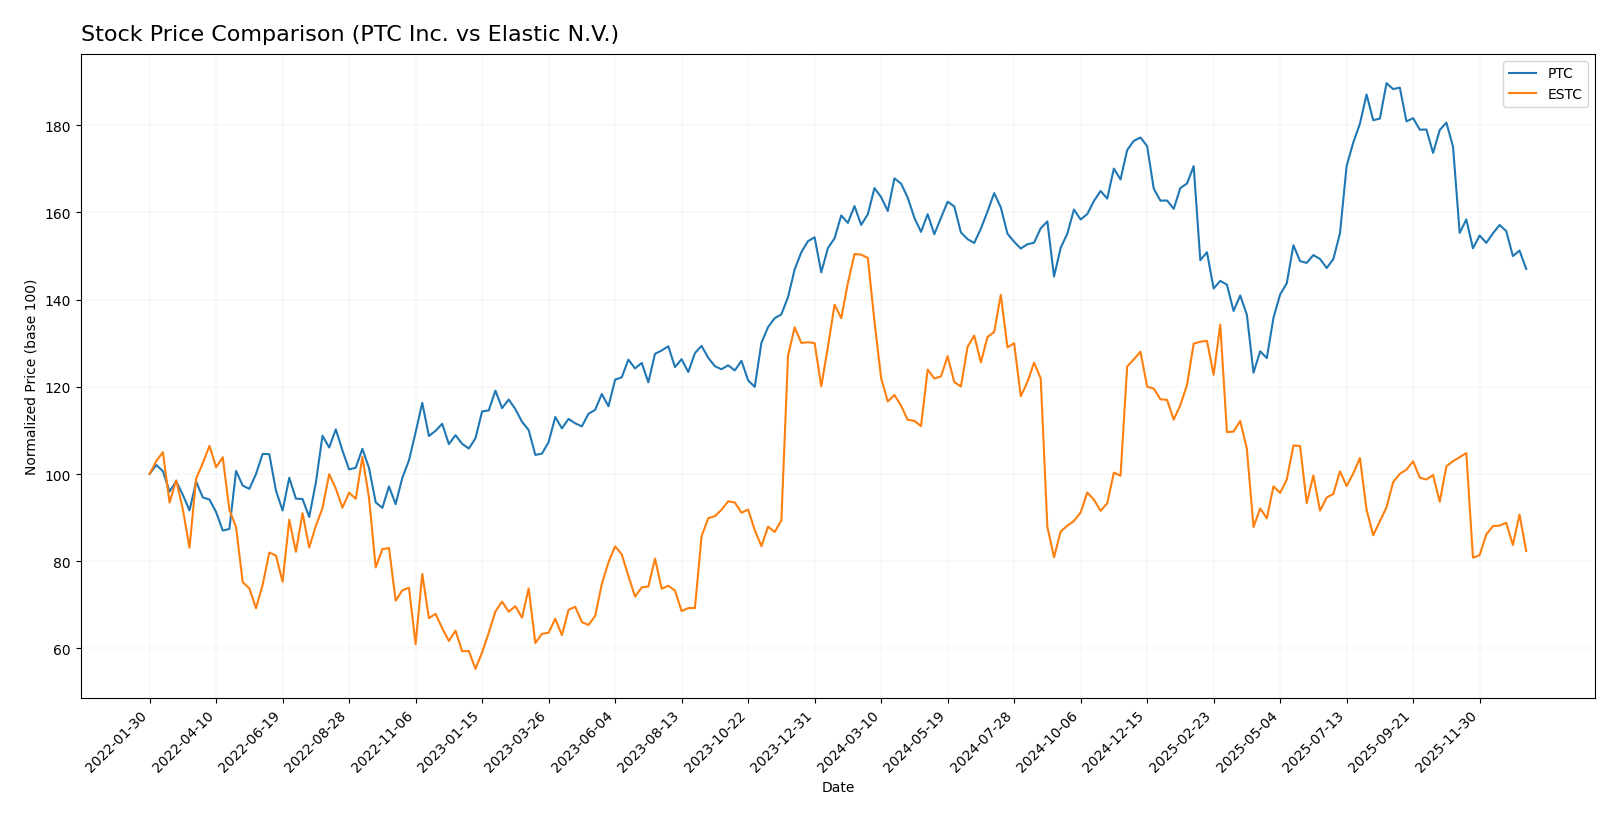
The stock price movements of PTC Inc. and Elastic N.V. over the past 12 months reflect significant bearish trends, with both showing notable declines and deceleration in price decreases, alongside varying trading volume dynamics.
Trend Analysis
PTC Inc. experienced a 7.84% price decline over the past year, indicating a bearish trend with deceleration. The stock ranged from a low of 139.77 to a high of 215.05, showing relatively high volatility with a 15.47 std deviation.
Elastic N.V. showed a more pronounced bearish trend with a 44.93% price drop over the same period. The stock’s price fluctuated between 70.04 and 129.62, with deceleration in the downtrend and a 14.08 standard deviation reflecting substantial volatility.
Comparing the two, PTC Inc. delivered a higher market performance with a smaller percentage loss than Elastic N.V., whose stock suffered a sharper decline during the analyzed timeframe.
Target Prices
Analysts present a clear target price consensus for both PTC Inc. and Elastic N.V., reflecting their expectations for future stock performance.
| Company | Target High | Target Low | Consensus |
|---|---|---|---|
| PTC Inc. | 255 | 120 | 213.25 |
| Elastic N.V. | 134 | 76 | 108 |
The consensus target prices for PTC Inc. and Elastic N.V. suggest upside potential compared to their current prices of $166.75 and $71.38, respectively, indicating moderate to strong growth expectations from analysts.
Analyst Opinions Comparison
This section compares analysts’ ratings and grades for PTC Inc. and Elastic N.V.:
Rating Comparison
PTC Rating
- Rating: B+, indicating a very favorable overall assessment.
- Discounted Cash Flow Score: 4, considered favorable.
- ROE Score: 4, showing favorable profit generation efficiency.
- ROA Score: 5, very favorable asset utilization.
- Debt To Equity Score: 2, moderate financial risk.
- Overall Score: 3, moderate overall financial standing.
ESTC Rating
- Rating: C-, reflecting a very unfavorable overall assessment.
- Discounted Cash Flow Score: 3, considered moderate.
- ROE Score: 1, indicating very unfavorable efficiency.
- ROA Score: 1, very unfavorable asset utilization.
- Debt To Equity Score: 1, very unfavorable financial risk.
- Overall Score: 1, very unfavorable overall financial standing.
Which one is the best rated?
Based strictly on the provided data, PTC Inc. is clearly better rated than Elastic N.V. It holds more favorable scores across all key financial metrics, including ROE, ROA, and discounted cash flow.
Scores Comparison
Here is a comparison of the Altman Z-Score and Piotroski Score for the two companies:
PTC Scores
- Altman Z-Score: 5.67, indicating a safe zone for bankruptcy risk.
- Piotroski Score: 8, classified as very strong financial health.
ESTC Scores
- Altman Z-Score: 3.51, also in the safe zone but lower than PTC.
- Piotroski Score: 4, indicating average financial strength.
Which company has the best scores?
PTC shows stronger scores with a higher Altman Z-Score (5.67 vs. 3.51) and a much better Piotroski Score (8 vs. 4), reflecting more robust financial health.
Grades Comparison
Here is a detailed comparison of the latest grades for PTC Inc. and Elastic N.V.:
PTC Inc. Grades
The following table summarizes recent grades from established financial institutions for PTC Inc.:
| Grading Company | Action | New Grade | Date |
|---|---|---|---|
| Piper Sandler | Maintain | Neutral | 2025-11-07 |
| Rosenblatt | Maintain | Buy | 2025-11-06 |
| Rosenblatt | Maintain | Buy | 2025-10-30 |
| Oppenheimer | Maintain | Outperform | 2025-07-31 |
| Rosenblatt | Maintain | Buy | 2025-07-31 |
| Barclays | Maintain | Overweight | 2025-07-31 |
| Stifel | Maintain | Buy | 2025-07-31 |
| Keybanc | Maintain | Overweight | 2025-07-31 |
| RBC Capital | Maintain | Outperform | 2025-07-31 |
| Piper Sandler | Maintain | Neutral | 2025-07-31 |
The grades for PTC Inc. consistently indicate a positive outlook, with the majority of ratings at Buy, Outperform, or Overweight levels.
Elastic N.V. Grades
Below is a summary of recent grades from reputable financial firms for Elastic N.V.:
| Grading Company | Action | New Grade | Date |
|---|---|---|---|
| Barclays | Maintain | Overweight | 2026-01-12 |
| RBC Capital | Maintain | Outperform | 2026-01-05 |
| Jefferies | Maintain | Buy | 2026-01-05 |
| Citigroup | Maintain | Buy | 2025-11-24 |
| Wedbush | Maintain | Outperform | 2025-11-21 |
| B of A Securities | Maintain | Neutral | 2025-11-21 |
| Guggenheim | Maintain | Buy | 2025-11-21 |
| Wells Fargo | Maintain | Equal Weight | 2025-11-21 |
| RBC Capital | Maintain | Outperform | 2025-11-21 |
| Canaccord Genuity | Maintain | Buy | 2025-11-21 |
Elastic N.V. shows a strong consensus with numerous Buy and Outperform ratings, suggesting favorable analyst sentiment.
Which company has the best grades?
Both PTC Inc. and Elastic N.V. receive predominantly positive grades, but Elastic N.V. shows a slightly stronger concentration of Outperform and Buy ratings with no Sell grades, potentially appealing more to investors seeking growth.
Strengths and Weaknesses
Below is a comparative overview of key strengths and weaknesses of PTC Inc. and Elastic N.V. based on the latest financial and operational data.
| Criterion | PTC Inc. | Elastic N.V. |
|---|---|---|
| Diversification | Strong revenue mix: License $1.16B, Cloud & Support $1.47B, Tech Services $107M (2025) | Revenue mainly from Subscription $1.38B, Professional Services $99M (2025) |
| Profitability | High net margin 26.8%, ROIC 14.43%, favorable profitability ratios | Negative net margin -7.29%, ROIC -3.45%, currently unprofitable but improving |
| Innovation | Consistent growth in ROIC (+42%), strong R&D focus in technology services | Improving ROIC trend (+85%), but still value destructive, innovation in subscription model |
| Global presence | Well-established global footprint with diversified product offerings | Growing global reach, primarily SaaS-based subscription services |
| Market Share | Solid market presence in industrial software with durable competitive advantage | Niche player in search and data analytics with expanding market but high competition |
Key takeaways: PTC shows a durable competitive advantage supported by strong profitability and diversified revenue streams, making it a value creator. Elastic is improving its profitability but remains a value destroyer, reflecting higher risk with potential upside due to its innovation in subscription services. Investors should weigh stability against growth potential carefully.
Risk Analysis
Below is a comparative table summarizing key risks for PTC Inc. and Elastic N.V. based on the latest 2025 fiscal year data.
| Metric | PTC Inc. | Elastic N.V. |
|---|---|---|
| Market Risk | Moderate (Beta 1.01) | Moderate-low (Beta 0.93) |
| Debt level | Low (Debt/Equity 0.36) | Moderate (Debt/Equity 0.64) |
| Regulatory Risk | Moderate (US & global tech regulations) | Moderate (US & EU cloud data regulations) |
| Operational Risk | Moderate (Complex software integration) | Moderate-high (Cloud infrastructure reliance) |
| Environmental Risk | Low (Software sector, limited direct impact) | Low (Software sector, limited direct impact) |
| Geopolitical Risk | Moderate (Global operations exposure) | Moderate (Global cloud services exposure) |
The most impactful risks currently stem from operational challenges and regulatory pressures in both companies. Elastic faces higher operational risks due to its cloud-based model, while PTC benefits from a stronger debt position and financial stability. Both companies must navigate evolving tech regulations and geopolitical uncertainties that could affect global markets.
Which Stock to Choose?
PTC Inc. shows a favorable income evolution with strong revenue and net income growth, supported by excellent profitability ratios including a 26.8% net margin and 19.18% ROE. Its debt levels are moderate with net debt to EBITDA near 1.05 and a solid current ratio of 1.12. The overall rating is very favorable with a B+ grade, reflecting a durable competitive advantage and value creation.
Elastic N.V. presents a mixed picture: revenue growth is robust at 143.77% over five years, but profitability remains negative with a -7.29% net margin and -11.66% ROE. Debt metrics are neutral to favorable, and liquidity ratios are strong with a current ratio near 1.92. Its overall rating is lower at C- with significant challenges in profitability despite improving ROIC trends.
Investors prioritizing financial stability, profitability, and value creation may find PTC’s favorable income statement, strong ratios, and very favorable rating suggest a more resilient profile. Conversely, those focused on rapid growth and willing to tolerate negative margins might view Elastic’s improving ROIC and growth trajectory as potentially appealing.
Disclaimer: Investment carries a risk of loss of initial capital. The past performance is not a reliable indicator of future results. Be sure to understand risks before making an investment decision.
Go Further
I encourage you to read the complete analyses of PTC Inc. and Elastic N.V. to enhance your investment decisions: