In the fast-evolving software industry, Pegasystems Inc. and Elastic N.V. stand out as innovators shaping enterprise solutions. Both companies operate in the application software sector, yet they focus on distinct but overlapping markets—Pegasystems in customer engagement and automation, Elastic in search and data analytics. This comparison explores their innovation strategies and market positions to help you decide which company is the more compelling investment opportunity today.
Table of contents
Companies Overview
I will begin the comparison between Pegasystems Inc. and Elastic N.V. by providing an overview of these two companies and their main differences.
Pegasystems Inc. Overview
Pegasystems Inc. develops, markets, licenses, hosts, and supports enterprise software applications globally, focusing on customer engagement and digital process automation. Its flagship products include the Pega Platform and Pega Infinity, which serve industries such as financial services, healthcare, and government. Headquartered in Massachusetts, Pegasystems has a market cap of 8.9B USD and employs around 5,443 people.
Elastic N.V. Overview
Elastic N.V. specializes in search technology solutions designed for multi-cloud environments, offering the Elastic Stack suite including Elasticsearch, Kibana, Beats, and Logstash. Its software supports data ingestion, search, analysis, and visualization across various data types. Founded in 2012 and based in California, Elastic holds a market cap of 7.5B USD with approximately 3,403 employees.
Key similarities and differences
Both companies operate in the software application industry, providing enterprise solutions focused on data and customer engagement. Pegasystems emphasizes process automation and customer interaction platforms, while Elastic prioritizes search, data analytics, and visualization tools in cloud environments. Pegasystems has a larger workforce and market cap, whereas Elastic is relatively younger with a focus on distributed search technology.
Income Statement Comparison
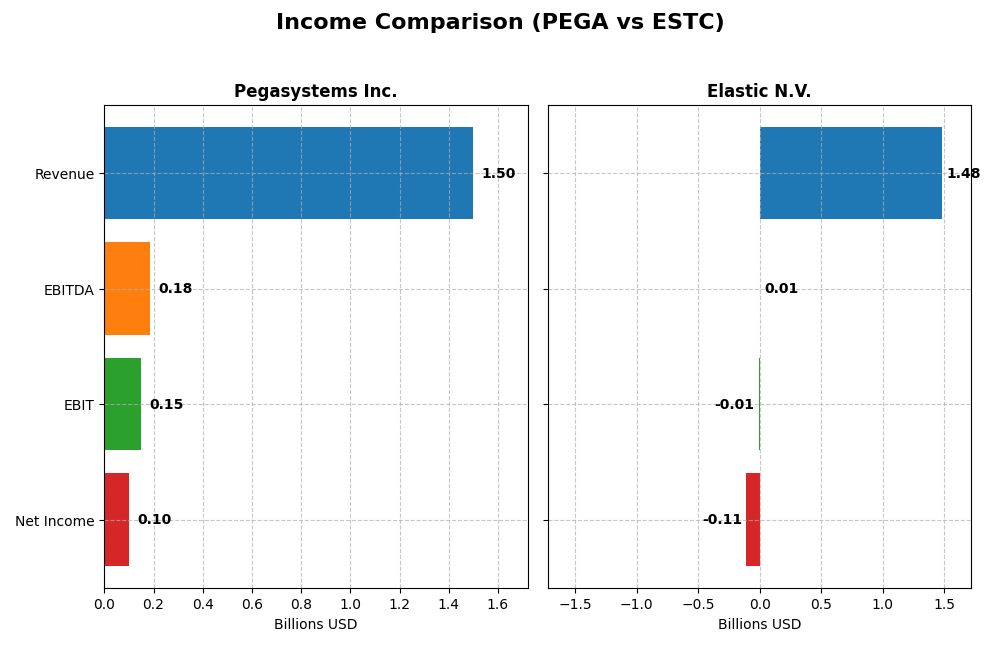
The table below presents a side-by-side comparison of key income statement metrics for Pegasystems Inc. and Elastic N.V. for their most recent fiscal years.
| Metric | Pegasystems Inc. (PEGA) | Elastic N.V. (ESTC) |
|---|---|---|
| Market Cap | 8.9B | 7.5B |
| Revenue | 1.50B | 1.48B |
| EBITDA | 185M | 6.1M |
| EBIT | 149M | -6.3M |
| Net Income | 99M | -108M |
| EPS | 0.58 | -1.04 |
| Fiscal Year | 2024 | 2025 |
Income Statement Interpretations
Pegasystems Inc.
Pegasystems has demonstrated a steady revenue increase from $1.02B in 2020 to $1.50B in 2024, with net income recovering from losses to $99M in 2024. Gross margins remained strong around 74%, while EBIT and net margins improved notably. The latest year showed a 4.5% revenue growth and a 40% rise in net margin, reflecting better profitability and operational control.
Elastic N.V.
Elastic’s revenue surged from $608M in 2021 to $1.48B in 2025, with a mixed net income trajectory culminating in a $108M loss in 2025. Gross margin stayed consistently favorable near 74%. Despite a 17% revenue growth in the latest year and a significant EBIT improvement, the net margin remains negative, impacted by rising expenses and interest costs.
Which one has the stronger fundamentals?
Pegasystems exhibits stronger fundamentals with consistent profitability improvements, healthy margins, and positive net income growth over recent years. Elastic shows impressive revenue growth but struggles with sustained net losses and unfavorable net margins. Pegasystems’ more balanced margin expansion and net income gains contrast with Elastic’s ongoing profitability challenges despite its top-line momentum.
Financial Ratios Comparison
The table below presents the most recent financial ratios for Pegasystems Inc. and Elastic N.V., providing a snapshot of their profitability, liquidity, leverage, efficiency, and dividend metrics as of their latest fiscal years.
| Ratios | Pegasystems Inc. (2024) | Elastic N.V. (2025) |
|---|---|---|
| ROE | 16.9% | -11.7% |
| ROIC | 7.4% | -3.4% |
| P/E | 80.1 | -82.7 |
| P/B | 13.6 | 9.6 |
| Current Ratio | 1.23 | 1.92 |
| Quick Ratio | 1.23 | 1.92 |
| D/E | 0.94 | 0.64 |
| Debt-to-Assets | 31.1% | 22.9% |
| Interest Coverage | 18.1 | -2.17 |
| Asset Turnover | 0.85 | 0.57 |
| Fixed Asset Turnover | 14.4 | 51.3 |
| Payout ratio | 10.3% | 0% |
| Dividend yield | 0.13% | 0% |
Interpretation of the Ratios
Pegasystems Inc.
Pegasystems shows a slightly favorable profile with a strong return on equity of 16.94% and good interest coverage at 21.87, indicating healthy profitability and debt servicing capacity. However, high price-to-earnings (80.12) and price-to-book (13.57) ratios raise valuation concerns. Its dividend yield is low at 0.13%, reflecting modest shareholder returns supported by steady payouts but limited yield.
Elastic N.V.
Elastic presents a mixed picture with unfavorable profitability ratios, including a negative net margin of -7.29% and return on equity at -11.66%, signaling operational challenges. The company does not pay dividends, likely prioritizing reinvestment and growth, as suggested by its negative earnings and strong R&D expenses. Favorable liquidity ratios and asset turnover support operational efficiency despite profit pressures.
Which one has the best ratios?
Pegasystems offers a more favorable ratio profile overall, with stronger profitability metrics and better debt coverage, though valuation multiples appear stretched. Elastic’s profitability is weak, offset partially by solid liquidity and investment in growth. The choice depends on weighing profitability strength against growth potential and risks evident in their financial ratios.
Strategic Positioning
This section compares the strategic positioning of Pegasystems Inc. and Elastic N.V. including Market position, Key segments, and disruption:
Pegasystems Inc.
- Market position and competitive pressure
- Key segments and business drivers
- Exposure to technological disruption
Elastic N.V.
- Market cap of 8.9B with presence in multiple global regions; faces competitive application software market.
- Diversified revenue streams: Pega Cloud (1.13B), Subscription License (398M), Consulting (213M), Maintenance (341M).
- Offers intelligent automation and cloud-based platforms; must adapt to evolving customer engagement technologies.
Pegasystems Inc. vs Elastic N.V. Positioning
Pegasystems adopts a diversified approach across cloud, subscription, consulting, and maintenance, offering broad enterprise software solutions. Elastic concentrates on subscription-based search and analytics software, focusing on cloud-native innovation. Both face pressures to maintain technological relevance.
Which has the best competitive advantage?
Both companies currently show slightly unfavorable MOAT evaluations, shedding value but with growing ROIC trends, indicating improving profitability. Neither holds a definitive competitive advantage based on recent MOAT data.
Stock Comparison
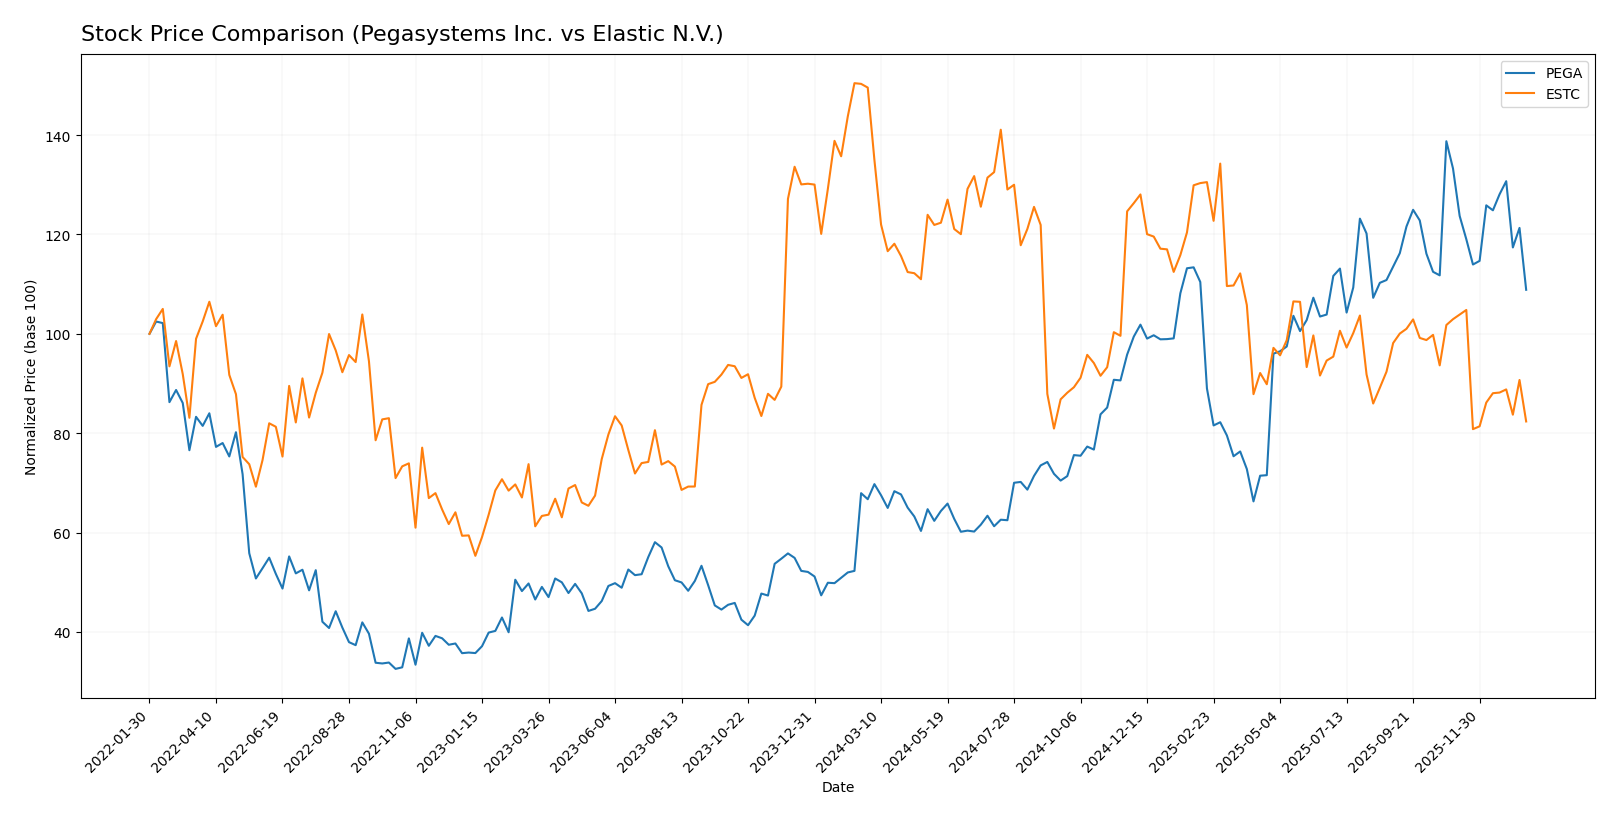
The stock prices of Pegasystems Inc. (PEGA) and Elastic N.V. (ESTC) have shown contrasting dynamics over the past 12 months, with PEGA exhibiting strong gains and ESTC facing significant declines.
Trend Analysis
Pegasystems Inc. (PEGA) recorded a 63.18% price increase over the past year, indicating a bullish trend with deceleration. The stock ranged from a low of 28.73 to a high of 66.27, with a recent downward trend of -18.32%.
Elastic N.V. (ESTC) experienced a bearish trend, with a -44.93% price change over the last 12 months and decelerating losses. The stock fluctuated between 70.04 and 129.62, continuing a recent decline of -20.0%.
Comparing both stocks, PEGA delivered the highest market performance with a strong positive gain, while ESTC showed substantial negative returns over the same period.
Target Prices
The current analyst consensus indicates promising upside potential for both Pegasystems Inc. and Elastic N.V.
| Company | Target High | Target Low | Consensus |
|---|---|---|---|
| Pegasystems Inc. | 80 | 67 | 74 |
| Elastic N.V. | 134 | 76 | 108 |
Analysts project Pegasystems shares to rise from $51.99 to around $74 on average, while Elastic’s consensus target of $108 suggests a notable increase from its current price of $71.38.
Analyst Opinions Comparison
This section compares analysts’ ratings and financial scores for Pegasystems Inc. and Elastic N.V.:
Rating Comparison
PEGA Rating
- Rating: B+ indicating a very favorable overall assessment.
- Discounted Cash Flow Score: 3, showing a moderate valuation based on cash flow.
- ROE Score: 5, reflecting very favorable profit generation from equity.
- ROA Score: 5, showing very effective asset utilization to generate earnings.
- Debt To Equity Score: 3, indicating moderate financial risk.
- Overall Score: 3, a moderate overall financial standing.
ESTC Rating
- Rating: C- indicating a very unfavorable overall assessment.
- Discounted Cash Flow Score: 3, also showing a moderate valuation.
- ROE Score: 1, reflecting very unfavorable profit generation from equity.
- ROA Score: 1, showing very ineffective asset utilization.
- Debt To Equity Score: 1, indicating very unfavorable financial risk.
- Overall Score: 1, a very unfavorable overall financial standing.
Which one is the best rated?
Pegasystems Inc. is clearly better rated with a B+ rating and strong scores in ROE and ROA, while Elastic N.V. shows a C- rating and very unfavorable scores across profitability and financial risk metrics.
Scores Comparison
Here is a comparison of the key financial scores for Pegasystems Inc. and Elastic N.V.:
PEGA Scores
- Altman Z-Score: 10.31, indicating a safe zone with very low bankruptcy risk.
- Piotroski Score: 8, reflecting very strong financial health and value.
ESTC Scores
- Altman Z-Score: 3.51, indicating a safe zone with low bankruptcy risk.
- Piotroski Score: 4, reflecting average financial strength and value.
Which company has the best scores?
Pegasystems Inc. shows a higher Altman Z-Score and a significantly stronger Piotroski Score compared to Elastic N.V., indicating better financial stability and strength based on these metrics.
Grades Comparison
Here is a detailed comparison of the recent grades assigned to Pegasystems Inc. and Elastic N.V.:
Pegasystems Inc. Grades
The following table summarizes the latest grades from notable financial institutions for Pegasystems Inc.:
| Grading Company | Action | New Grade | Date |
|---|---|---|---|
| JP Morgan | Maintain | Overweight | 2025-12-05 |
| Wedbush | Maintain | Outperform | 2025-10-23 |
| RBC Capital | Maintain | Outperform | 2025-10-23 |
| Barclays | Maintain | Equal Weight | 2025-10-23 |
| Rosenblatt | Maintain | Buy | 2025-10-23 |
| DA Davidson | Upgrade | Buy | 2025-10-22 |
| Rosenblatt | Maintain | Buy | 2025-10-15 |
| Rosenblatt | Maintain | Buy | 2025-07-24 |
| DA Davidson | Maintain | Neutral | 2025-07-24 |
| Wedbush | Maintain | Outperform | 2025-07-24 |
Overall, Pegasystems Inc. maintains a positive rating trend, with multiple “Buy” and “Outperform” grades and no downgrades reported.
Elastic N.V. Grades
The following table shows the most recent grades published for Elastic N.V.:
| Grading Company | Action | New Grade | Date |
|---|---|---|---|
| Barclays | Maintain | Overweight | 2026-01-12 |
| RBC Capital | Maintain | Outperform | 2026-01-05 |
| Jefferies | Maintain | Buy | 2026-01-05 |
| Citigroup | Maintain | Buy | 2025-11-24 |
| Wedbush | Maintain | Outperform | 2025-11-21 |
| B of A Securities | Maintain | Neutral | 2025-11-21 |
| Guggenheim | Maintain | Buy | 2025-11-21 |
| Wells Fargo | Maintain | Equal Weight | 2025-11-21 |
| RBC Capital | Maintain | Outperform | 2025-11-21 |
| Canaccord Genuity | Maintain | Buy | 2025-11-21 |
Elastic N.V. also shows a strong consensus with many “Buy” and “Outperform” ratings and no significant negative revisions.
Which company has the best grades?
Both Pegasystems Inc. and Elastic N.V. have received predominantly positive grades, with consensus ratings at “Buy.” Elastic N.V. has a slightly higher number of “Buy” and “Outperform” endorsements, which could indicate stronger analyst confidence, potentially influencing investor sentiment more favorably.
Strengths and Weaknesses
The table below compares key strengths and weaknesses of Pegasystems Inc. (PEGA) and Elastic N.V. (ESTC) based on their diversification, profitability, innovation, global presence, and market share using the most recent data available.
| Criterion | Pegasystems Inc. (PEGA) | Elastic N.V. (ESTC) |
|---|---|---|
| Diversification | Moderate – revenue mix includes Consulting (213M), Maintenance (341M), Cloud (1.13B), and Subscription (398M) | Limited – mainly Subscription (1.38B) and Professional Services (99M) |
| Profitability | Moderate profitability with 6.63% net margin, ROE 16.94%, and slightly favorable financial ratios | Negative profitability with -7.29% net margin, negative ROE and ROIC, neutral overall financial ratios |
| Innovation | Continuous growth in ROIC (+224%) indicates improving efficiency and investment return | ROIC growing (+86%) but still negative, reflecting ongoing investment in innovation but not yet profitable |
| Global presence | Established global footprint with diverse client base and product offerings | Growing international presence, primarily focused on cloud-based subscription services |
| Market Share | Strong in process automation and CRM software markets | Increasing share in search and data analytics market but faces strong competition |
Pegasystems shows moderate diversification and improving profitability, supported by a growing return on invested capital. Elastic faces profitability challenges but demonstrates strong revenue growth in subscription services, signaling potential if it can convert investments into profits. Both companies carry risks, with PEGA more stable and ESTC more growth-oriented but volatile.
Risk Analysis
Below is a comparison of key risks for Pegasystems Inc. (PEGA) and Elastic N.V. (ESTC) for the most recent fiscal years.
| Metric | Pegasystems Inc. (PEGA) | Elastic N.V. (ESTC) |
|---|---|---|
| Market Risk | Moderate (Beta 1.08, sector tech volatility) | Moderate (Beta 0.93, tech sector exposure) |
| Debt level | Moderate (Debt/Equity 0.94, interest coverage favorable) | Low (Debt/Equity 0.64, interest coverage unfavorable) |
| Regulatory Risk | Moderate (Software industry compliance) | Moderate (Cloud and data privacy regulations) |
| Operational Risk | Moderate (Global operations, software delivery) | Moderate (Cloud infrastructure, software updates) |
| Environmental Risk | Low (No significant exposure) | Low (No significant exposure) |
| Geopolitical Risk | Moderate (Global markets exposure) | Moderate (Global markets exposure) |
Pegasystems faces moderate market and debt-related risks but benefits from strong interest coverage and financial stability. Elastic struggles with profitability and interest coverage despite lower debt, increasing financial risk. Both companies operate globally, facing similar regulatory and geopolitical risks with moderate impact. Investors should weigh Pegasystems’ stable financial health against Elastic’s operational challenges.
Which Stock to Choose?
Pegasystems Inc. (PEGA) shows a favorable income evolution with a 47% revenue increase over five years and a 6.63% net margin in 2024. Its financial ratios are slightly favorable, highlighting a strong 16.94% ROE, moderate debt levels, and good liquidity. Despite shedding value with ROIC below WACC, the company’s profitability is rising. PEGA holds a very favorable B+ rating and strong financial health scores.
Elastic N.V. (ESTC) presents a favorable income growth overall but with a negative 7.29% net margin in 2025 and weaker profitability metrics including negative ROE and ROIC below WACC. Its financial ratios are neutral, showing solid liquidity and moderate debt but unfavorable profitability and valuation scores. ESTC’s rating is very favorable C- but with mixed financial stability signals and average financial strength scores.
Depending on the investor’s profile, PEGA might appear more suitable for those valuing profitability improvement and financial strength, while ESTC could be considered by investors focused on growth potential despite current profitability challenges. Both companies show growing ROIC trends but are currently shedding value, suggesting cautious interpretation of their financial outlooks.
Disclaimer: Investment carries a risk of loss of initial capital. The past performance is not a reliable indicator of future results. Be sure to understand risks before making an investment decision.
Go Further
I encourage you to read the complete analyses of Pegasystems Inc. and Elastic N.V. to enhance your investment decisions: